More Related Content
Similar to poster presentattion on algae-final rkb-final
Similar to poster presentattion on algae-final rkb-final (20)
poster presentattion on algae-final rkb-final
- 1. RESEARCH POSTER PRESENTATION DESIGN © 2011
www.PosterPresentations.com
Fluorescence Method for Rapid Estimation of Lipids in Algae
The Nile red fluorescence method has been
successfully used as a rapid screening method
for estimation of lipids in certain microalgae, but
it has been unsuccessful in many others,
particularly in those with thick, rigid cell walls
that prevent the penetration of the fluorescence
dye in to the cells. In this study, several solvents
have been used to make the cell membranes
permeable to the dye and dimethyl sulfoxide
(DMSO) was found to be the most effective. The
cellular neutral lipids were determined and
quantified using a fluorescence
spectrophotometer with an excitation wavelength
of 488 nm and an emission wavelength of
550nm.
ABSTRACT
OBJECTIVES
EXPERIMENTAL METHODS
RESULTS
MICROSCOPIC IMAGES
CONCLUSIONS
• Out of DMSO, Acetone, and DMF, DMSO was
found to be the most effective solvent for pre-
treatment of cells for fluorescence measurement
of lipids.
•DMSO did not interfere with the neutral lipids
peak as DMSO shows a peak at 600-650nm.
•Treating the cells with dimethyl-sulphoxide
(DMSO) removed the photosynthetic pigments
from the cells also.
•Some intracellular neutral lipids leaked from the
cells as a result of DMSO treatment. This
leakage was accounted for by measuring
fluorescence in the supernatants. A mathematical
model was used determine the total intracellular
neutral lipids in the cells.
•A good correlation was observed between the
Nile red fluorescence, cell volume and lipid
content determined gravimetrically.
REFERENCES
•Chen, W., Zhang, C., Song, L., Sommerfeld,
M., Hu, Q., 2009. A high throughput Nile red
method for quantitative measurement of neutral
lipids in microalgae. J. Microbiol. Meth. 77, 41–
47.
•Kimura, K., Yamaoka, M., Kamisaka, Y., 2004.
Rapid estimation of lipids in oleaginous fungi
and yeasts using Nile red fluorescence. J.
The objectives of this study were:
•Determine how to effectively stain the
intracellular lipids in microalgal cells having
thick and rigid cell walls with fluorescent dye.
•Study the effect of solvent treatment on leakage
of intracellular lipids across the cell membranes
of Chlamydomonas Reinhardtii cells.
•Correlate the measured fluorescence with lipid
content in the cells by gravimetric measurements
of neutral lipids.
Department of Chemical Engineering, University of Louisiana, PO Box 44130 , Lafayette, LA 70504
Chaitanyakumar Reddy Palakonda, Ramalingam Subramaniam, Stephen Dufreche, Mark Zappi, Rakesh Bajpai
Figure 1- Emission spectrum with different
concentrations of cells (excitation wavelength 488
nm and emission wavelength 500-700 nm).
Figure 2- Linear correlation among lipid
concentrations determined by gravimetry and
fluorescence intensity (R2
=0.99)
Cell
vol(µL) 1st
treatment 2nd
treatment
LIPID
(mg/mL)
0 0 0 0.00
250 35.1 55.85 0.04
500 69.8 124.15 0.07
750 107.88 190.64 0.11
1000 135.02 248.02 0.14
• Take 20 ml of cell broth in a 50mL corning tube
and add 10 mL of 99.8% dimethyl sulphoxide
(DMSO) (1st treatment).
• Vortex the contents for 5 minutes and
centrifuge at 3800g for 5 minutes.
• Remove the supernatant and hold it in a clean
conical flask for supernatant study.
Staining the cells with DMSO
Table 1- Fluorescence intensities at different cell
concentrations after each treatment of DMSO and
their corresponding lipid concentration determined
by gravimetric analysis (0.14 gm/L).
Emission spectra• Resuspend the pellet in 10 mL of dimethyl-
sulphoxide and vortex vigorously for 5
minutes followed by centrifugation at 3800g
for 5 minutes (2nd
treatment).
• Remove the supernatant and mix it into the
supernatant collected in the step above.
• Resuspend the pellet in 10 mL DI water for
lipid analysis by Nile red fluorescence
Method.
Fluorescence measurement:
• Take 2.5 mL of appropriately diluted cell
suspension in a four-sided quartz cuvette and
measure the emission spectrum in a
wavelength region of 500-700 nm at excitation
wavelength of 488 nm.
• Add 20 µL 1-mg/mL Nile red solution in
acetone and mix well. Five minutes later,
measure emission spectrum again.
• The spectrum without Nile red was subtracted
from the spectrum with Nile red and the peak
fluorescence intensity in 540-560 nm range
was used as a measure of lipid content in the
cells using a calibration curve.
• Intracellular lipid content was measured by
extraction and gravimetric measurement of
lipid extracted from cells and a calibration
curve relating lipid content in the broth with
Nile red fluorescence intensity was prepared
by measuring fluorescence in appropriately
diluted cell suspensions.
Lipid calibration curve
Leakage of intracellular lipids
Fig 3- Emission spectrum in supernatant mixture.
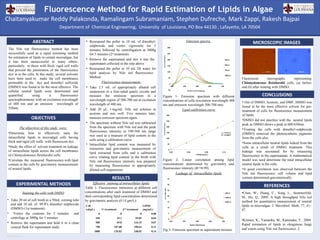
Effective staining of intracellular lipids
Fluorescent micrographs representing
Chlamydomonas Reinhardtii cells, (a) before
and (b) after treating with DMSO.
a b