The document analyzes geometric and topological characteristics of polygonal networks formed by freezing and thawing of soils in Adventdalen, Svalbard, Norway. Over 10,000 polygons across 120 networks were mapped from aerial imagery. 17 networks were analyzed in detail. Larger networks had smaller average polygon sizes while some networks with larger polygons showed signs of subdivision into smaller polygons over time. Networks with higher percentages of intersections with 4 sides (tetravalent vertices) and smaller, more uniform polygon sizes showed progression toward an equilibrium cracking pattern.
This document summarizes the scores from a winter golf competition across multiple dates from December to March. It tracks the number of entries in different scoring categories each date. It also includes running totals for the percentage of entries in each category and the number of scores in a buffer zone or better. Scores are rounded and adjusted to determine the final scratch score for each date.
José O. G. P. Lello is an experienced entrepreneur, project manager, and consultant from Carcavelos, Portugal. He has lived and worked in several European and South American countries, speaking Portuguese, English, French, Spanish, and Greek. He has a lifelong career in entrepreneurship, management experience across industries and services, and is skilled in communication, adapting to diverse cultures, and building relationships. His education includes degrees from universities in Grenoble, Caracas, and Lisbon. He has work experience in Portugal, Spain, Venezuela, and South America in roles including professor, consultant, franchisee, and founder/manager of several companies in fields like machinery, vehicle inspection, training, real
Driving Simulators
The document discusses driving simulators and their advantages. A driving simulator includes a driver's seat, steering wheel, brakes, and other car features. It can generate real-life driving situations of varying difficulty. If the driver has an "accident" in the simulator, the sequence can be replayed to avoid future mistakes. Use of simulators will reduce traffic congestion and pollution by decreasing the number of learner drivers on the roads, and save money on fuel costs. Simulators may become available for home use, making learning to drive more affordable and accessible. They can help drivers practice dangerous situations and help older drivers regain confidence. Driving instructors are likely to be against the use of driving
This production log summarizes 8 scenes from the film "No Escape". Scene 1 introduces the main characters as they arrive at a holiday home. Scene 2 shows the group looking around the house and their surroundings. Scene 3 depicts the friends drinking and having fun together. Scene 4 reveals that one of the friends, Olivia, has gone missing, introducing a complication. Scene 5 shows a suspicious man in the distance, indicating the thriller genre. Scene 6 illustrates the climax as the girls are pulled from under a bed and there is screaming. Scene 7 continues the climax as the characters run to a shed. Scene 8 ends on a cliffhanger with the characters now in a mental hospital setting.
El ábaco fue la primera computadora hace 5000 años. En 1642, Blaise Pascal inventó la calculadora con rueda numérica para ayudar a su padre con sus deberes. Esta caja de cobre llamada Pascalina utilizaba esferas móviles para sumar números de hasta ocho cifras. En 1694, Wilhelm Von Leibniz mejoró la Pascalina inventando una máquina de multiplicar que realizaba multiplicaciones mecánicas usando ruedas y mecanismos.
Accessoires indispensables, les chaussettes font souvent partie intégrante de notre habillement aussi, choisir le plus adapté demande de disposer d’ une variété à mettre en fonction de nos vêtements.
This rubric outlines the steps for an inquiry-based project, including brainstorming questions, researching various sources, refining important information, gathering materials like images and video, and creating a final product. Students are assessed on brainstorming (15%), research (25%), refining their work (25%), gathering materials (15%), and their final creation (20%). A variety of digital tools are suggested for each step, such as mind mapping software for brainstorming, and iMovie or Keynote for assembling the final project.
This document describes the creation of a geodatabase to store and organize spatial data collected during a study of ice-wedge polygonal networks in Svalbard, Norway. The geodatabase contains raster maps, vector data, field data, and metadata. Relationships and topology rules were defined to enforce data integrity. Editing tools allow multidisciplinary teams to efficiently access and analyze the linked spatial data.
This document describes the creation of a geodatabase to store spatial and attribute data related to polygonal ice-wedge networks in Svalbard, Norway. The geodatabase contains raster, vector, and numeric data from the field site. Feature classes were created to represent polygons, lines, points, and their attributes. Relationships and topology rules were defined. The geodatabase schema was exported to Microsoft Visio for visualization and to ArcCatalog to enable data editing and annotation.
This document summarizes previous work on comparing the network costs of different interconnection network topologies. It discusses mesh, hexagonal mesh, honeycomb mesh, torus, hexagonal torus, and honeycomb torus networks. Previous studies have calculated the degree, diameter, number of nodes, and network cost (defined as the product of degree and diameter) for each network as the number of nodes or network dimension increases. This paper aims to compare the network costs of the Spidergon and Honeycomb Torus networks based on these parameters.
Statistical Data Analysis On The Field Of Counseling...Jill Baldwin
Here are the key points about ultrasonic technology:
- Ultrasonic refers to sound waves that are higher in frequency than the upper audible limit of human hearing. The typical ultrasonic range is 20 kHz or above.
- Ultrasonic technology uses these high frequency sound waves, which have properties useful for applications like imaging, cleaning, machining, and more.
- In medical imaging, ultrasonic waves are used for ultrasound scans. Their high frequency allows imaging of soft tissues and internal organs. Ultrasound is widely used due to its low cost and lack of health effects compared to ionizing radiation.
- Industrial and commercial uses of ultrasound include ultrasonic cleaning, which uses high intensity sound to remove
This document presents a comparative study of high-resolution direction of arrival (DOA) estimation algorithms, specifically MUSIC, ESPRIT, and Q-MUSIC. It provides background on array signal processing and direction of arrival estimation. The key high-resolution DOA estimation algorithms - MUSIC, ESPRIT, and Q-MUSIC - are explored in detail. Through simulation, Q-MUSIC is shown to be highly accurate, stable, and provide high angular resolution for multidimensional complex data signals compared to MUSIC and ESPRIT.
IJERA (International journal of Engineering Research and Applications) is International online, ... peer reviewed journal. For more detail or submit your article, please visit www.ijera.com
This document summarizes a research paper that proposes a new texture analysis and classification method based on wavelet transforms and linear regression models. The method analyzes the correlation between different frequency regions obtained from a 2D wavelet packet transform of sample texture images. A linear regression model is used to extract texture features characterizing this correlation. The method is compared to other multiresolution techniques like tree-structured wavelet transforms and Gabor transforms. Experimental results on a dataset of 40 textures show the new method significantly improves texture classification rates compared to existing approaches.
1) The document analyzes the micro-relief and geometry of ice-wedge polygons in Adventdalen, Svalbard, Norway.
2) Two field campaigns were conducted to survey over 8,000 data points across 163 polygons using GPS. This data was used to generate a detailed digital terrain model.
3) Vertical distances along the major and minor axes of each polygon were calculated and analyzed. Results showed 85% of polygons had higher vertical distances along the major axis, suggesting polygon geometry is influenced by micro-relief slopes.
This document provides an overview of synthetic aperture radar (SAR). SAR uses motion of a radar antenna mounted on a moving platform to synthesize a large antenna and create high-resolution radar images. It describes the basic principles of SAR, including how successive radar pulses are transmitted and echoes received to build up an image. Applications of SAR include remote sensing, mapping, and monitoring changes over time. Spectral estimation techniques are used to process SAR data and improve resolution. Polarimetry and interferometry are additional SAR techniques. Typical SAR systems are mounted on aircraft or satellites.
IRJET-Mapping of Mineral Zones using the Spectral Feature Fitting Method in J...IRJET Journal
This document summarizes a study that used the Spectral Feature Fitting (SFF) algorithm to map mineral zones in the Jahazpur belt area of Rajasthan, India using Airborne Visible/Infrared Imaging Spectrometer Next Generation (AVIRIS-NG) hyperspectral imagery. The SFF algorithm was applied to process the AVIRIS-NG imagery to identify and enhance mineral mapping with better accuracy. Preprocessing steps including noise removal and dimensionality reduction using Minimum Noise Fraction transformation were applied. Pixel Purity Index and n-Dimensional visualization were used to extract pure pixel endmembers. The SFF method then helped classify the imagery and produce a mineral distribution map of the study area with high efficiency.
This document summarizes a research paper that analyzes the symbol error rate (SER) performance of multiple-input multiple-output (MIMO) multi-channel beam forming in double-scattering channels. It derives an asymptotic expansion of the MIMO channel matrix's eigenvalue distribution and uses it to obtain an approximate high signal-to-noise ratio (SNR) expression for average SER. The expression shows that SER is characterized by diversity gain and array gain, where diversity gain determines slope and array gain determines SNR gap from a benchmark curve. The analysis finds that sufficient scatterers are needed to achieve the diversity gain of Rayleigh channels, and below a threshold the array gain varies logarithmically with SNR.
IJERA (International journal of Engineering Research and Applications) is International online, ... peer reviewed journal. For more detail or submit your article, please visit www.ijera.com
CP-NR Distributed Range Free Localization Algorithm in WSNIJAAS Team
Advancements in wireless communication technology have empowered the researchers to develop large scale wireless networks with huge number of sensor nodes. In these networks localization is very active field of research. Localization is a way to determine the physical position of sensor nodes which is useful in many aspects such as to find the origin of events, routing and network coverage. Locating nodes with GPS systems is expensive, power consuming and not applicable to indoor environments. Localization in three dimensional space and accuracy of the estimated location are two factors of major concern. In this paper, a new three dimensional Distributed range-free algorithm which is known as CP-NR is proposed. This algorithm has high localization accuracy and resolved the problem of existing NR algorithm. CP-NR (Coplanar and Projected Node Reproduction) algorithm makes use of co-planarity and projection of point on plane concepts to reduce the localization error. Results have shown that CP-NR algorithm is superior to NR algorithm and comparison is done for the localization accuracy with respect to variations in range, anchor density and node density.
A Survey on Area Planning for Heterogeneous NetworksGiselleginaGloria
This paper deals with the survey of basic networks like Spidergon network and Honeycomb Torus network with respect to network cost. The basic network can be modelled in different structures to overcome the problems in handling the user density patterns, utilizing the available bandwidth effectively and improvising the efficiency. These bottlenecks are overcome by selecting the proper structure for a particular network based on network cost. In this paper the efficiency of specified network is estimated with respect to the number of nodes
1. An FPGA is used as the control circuit to generate PWM signals for a cascaded H-bridge multilevel inverter.
2. FPGA-based PWM control provides advantages like flexibility, high speed processing, and reprogrammability.
3. The FPGA generates the switching pulses for each H-bridge cell of the multilevel inverter independently to synthesize the stepped output voltage waveform.
The document describes applying an adaptive neuro-fuzzy inference system (ANFIS) for grade estimation of copper at the Sarcheshmeh porphyry copper deposit in Iran. ANFIS combines artificial neural networks and fuzzy logic to estimate copper grades based on sample coordinates. Training ANFIS adjusts membership functions to minimize error between predicted and actual grades. ANFIS achieved a higher R2 value of 0.8987 compared to 0.4571 for ANN and 0.6889 for kriging, demonstrating its ability to improve grade estimation.
This document summarizes a research paper about designing beampatterns for MIMO radar systems using a covariance-based method while accounting for the locations of transmitter antennas. It discusses how changing antenna locations is equivalent to changing carrier frequency. The paper proposes optimizing two cost functions: 1) Pushing sidelobes away from the main lobe to minimize interference, and 2) Maximizing power around target locations without extra sidelobes to improve target detection. It formulates these cost functions and outlines an algorithm to optimize them using the cross-correlation matrix and antenna locations as design variables.
A Generalized Regression Neural Network Approach to Wireless Signal Strength ...ijtsrd
This study presents a Generalized Regression Neural network GRNN based approach to wireless communication network field strength prediction. As case study, the rural area between the cities of Bauchi and Gombe, Nigeria, was considered. The GRNN based predictor was created, validated and tested with field strength data recorded from multiple Base Transceiver Stations at a frequency of 1800MHz. Results indicate that the GRNN based model with Root Mean Squared Error RMSE value of 5.8dBm offers significant improvements over the empirical Okumura and COST 231 Hata models. While the Okumura model overestimates the field strength, the COST 231 Hata significantly underestimates it. Finangwai D. Jacob | Deme C. Abraham | Gurumdimma Y. Nentawe "A Generalized Regression Neural Network Approach to Wireless Signal Strength Prediction" Published in International Journal of Trend in Scientific Research and Development (ijtsrd), ISSN: 2456-6470, Volume-4 | Issue-3 , April 2020, URL: https://www.ijtsrd.com/papers/ijtsrd30501.pdf Paper Url :https://www.ijtsrd.com/computer-science/artificial-intelligence/30501/a-generalized-regression-neural-network-approach-to-wireless-signal-strength-prediction/finangwai-d-jacob
Lake sediment thickness estimation using ground penetrating radareSAT Publishing House
This document summarizes a study that used ground penetrating radar (GPR) to estimate the thickness and volume of sediments in Punem Lake, India. GPR profiles identified two sediment layers in the lake. The thickness of the first layer ranged from 0.02m to 1.16m with an average of 0.5m, while the second layer ranged from 0.08m to 0.99m with an average of 0.37m. Sediment volume was estimated at 260,303 cubic meters for the first layer and 188,171 cubic meters for the second layer. Thicker sediments were found toward the north, northeast, and east of the lake for the first layer and toward the north, northeast, and west for
More Related Content
Similar to Contraction polígonal networks, topologic characterization
This document describes the creation of a geodatabase to store spatial and attribute data related to polygonal ice-wedge networks in Svalbard, Norway. The geodatabase contains raster, vector, and numeric data from the field site. Feature classes were created to represent polygons, lines, points, and their attributes. Relationships and topology rules were defined. The geodatabase schema was exported to Microsoft Visio for visualization and to ArcCatalog to enable data editing and annotation.
This document summarizes previous work on comparing the network costs of different interconnection network topologies. It discusses mesh, hexagonal mesh, honeycomb mesh, torus, hexagonal torus, and honeycomb torus networks. Previous studies have calculated the degree, diameter, number of nodes, and network cost (defined as the product of degree and diameter) for each network as the number of nodes or network dimension increases. This paper aims to compare the network costs of the Spidergon and Honeycomb Torus networks based on these parameters.
Statistical Data Analysis On The Field Of Counseling...Jill Baldwin
Here are the key points about ultrasonic technology:
- Ultrasonic refers to sound waves that are higher in frequency than the upper audible limit of human hearing. The typical ultrasonic range is 20 kHz or above.
- Ultrasonic technology uses these high frequency sound waves, which have properties useful for applications like imaging, cleaning, machining, and more.
- In medical imaging, ultrasonic waves are used for ultrasound scans. Their high frequency allows imaging of soft tissues and internal organs. Ultrasound is widely used due to its low cost and lack of health effects compared to ionizing radiation.
- Industrial and commercial uses of ultrasound include ultrasonic cleaning, which uses high intensity sound to remove
This document presents a comparative study of high-resolution direction of arrival (DOA) estimation algorithms, specifically MUSIC, ESPRIT, and Q-MUSIC. It provides background on array signal processing and direction of arrival estimation. The key high-resolution DOA estimation algorithms - MUSIC, ESPRIT, and Q-MUSIC - are explored in detail. Through simulation, Q-MUSIC is shown to be highly accurate, stable, and provide high angular resolution for multidimensional complex data signals compared to MUSIC and ESPRIT.
IJERA (International journal of Engineering Research and Applications) is International online, ... peer reviewed journal. For more detail or submit your article, please visit www.ijera.com
This document summarizes a research paper that proposes a new texture analysis and classification method based on wavelet transforms and linear regression models. The method analyzes the correlation between different frequency regions obtained from a 2D wavelet packet transform of sample texture images. A linear regression model is used to extract texture features characterizing this correlation. The method is compared to other multiresolution techniques like tree-structured wavelet transforms and Gabor transforms. Experimental results on a dataset of 40 textures show the new method significantly improves texture classification rates compared to existing approaches.
1) The document analyzes the micro-relief and geometry of ice-wedge polygons in Adventdalen, Svalbard, Norway.
2) Two field campaigns were conducted to survey over 8,000 data points across 163 polygons using GPS. This data was used to generate a detailed digital terrain model.
3) Vertical distances along the major and minor axes of each polygon were calculated and analyzed. Results showed 85% of polygons had higher vertical distances along the major axis, suggesting polygon geometry is influenced by micro-relief slopes.
1) The document analyzes the micro-relief and geometry of ice-wedge polygons in Adventdalen, Svalbard, Norway.
2) Two field campaigns were conducted to survey over 8,000 data points across 163 polygons using GPS. This data was used to generate a detailed digital terrain model.
3) Vertical distances along the major and minor axes of each polygon were calculated and analyzed. Results showed 85% of polygons had higher vertical distances along the major axis, suggesting polygon geometry is influenced by micro-relief slopes.
This document provides an overview of synthetic aperture radar (SAR). SAR uses motion of a radar antenna mounted on a moving platform to synthesize a large antenna and create high-resolution radar images. It describes the basic principles of SAR, including how successive radar pulses are transmitted and echoes received to build up an image. Applications of SAR include remote sensing, mapping, and monitoring changes over time. Spectral estimation techniques are used to process SAR data and improve resolution. Polarimetry and interferometry are additional SAR techniques. Typical SAR systems are mounted on aircraft or satellites.
IRJET-Mapping of Mineral Zones using the Spectral Feature Fitting Method in J...IRJET Journal
This document summarizes a study that used the Spectral Feature Fitting (SFF) algorithm to map mineral zones in the Jahazpur belt area of Rajasthan, India using Airborne Visible/Infrared Imaging Spectrometer Next Generation (AVIRIS-NG) hyperspectral imagery. The SFF algorithm was applied to process the AVIRIS-NG imagery to identify and enhance mineral mapping with better accuracy. Preprocessing steps including noise removal and dimensionality reduction using Minimum Noise Fraction transformation were applied. Pixel Purity Index and n-Dimensional visualization were used to extract pure pixel endmembers. The SFF method then helped classify the imagery and produce a mineral distribution map of the study area with high efficiency.
This document summarizes a research paper that analyzes the symbol error rate (SER) performance of multiple-input multiple-output (MIMO) multi-channel beam forming in double-scattering channels. It derives an asymptotic expansion of the MIMO channel matrix's eigenvalue distribution and uses it to obtain an approximate high signal-to-noise ratio (SNR) expression for average SER. The expression shows that SER is characterized by diversity gain and array gain, where diversity gain determines slope and array gain determines SNR gap from a benchmark curve. The analysis finds that sufficient scatterers are needed to achieve the diversity gain of Rayleigh channels, and below a threshold the array gain varies logarithmically with SNR.
IJERA (International journal of Engineering Research and Applications) is International online, ... peer reviewed journal. For more detail or submit your article, please visit www.ijera.com
CP-NR Distributed Range Free Localization Algorithm in WSNIJAAS Team
Advancements in wireless communication technology have empowered the researchers to develop large scale wireless networks with huge number of sensor nodes. In these networks localization is very active field of research. Localization is a way to determine the physical position of sensor nodes which is useful in many aspects such as to find the origin of events, routing and network coverage. Locating nodes with GPS systems is expensive, power consuming and not applicable to indoor environments. Localization in three dimensional space and accuracy of the estimated location are two factors of major concern. In this paper, a new three dimensional Distributed range-free algorithm which is known as CP-NR is proposed. This algorithm has high localization accuracy and resolved the problem of existing NR algorithm. CP-NR (Coplanar and Projected Node Reproduction) algorithm makes use of co-planarity and projection of point on plane concepts to reduce the localization error. Results have shown that CP-NR algorithm is superior to NR algorithm and comparison is done for the localization accuracy with respect to variations in range, anchor density and node density.
A Survey on Area Planning for Heterogeneous NetworksGiselleginaGloria
This paper deals with the survey of basic networks like Spidergon network and Honeycomb Torus network with respect to network cost. The basic network can be modelled in different structures to overcome the problems in handling the user density patterns, utilizing the available bandwidth effectively and improvising the efficiency. These bottlenecks are overcome by selecting the proper structure for a particular network based on network cost. In this paper the efficiency of specified network is estimated with respect to the number of nodes
1. An FPGA is used as the control circuit to generate PWM signals for a cascaded H-bridge multilevel inverter.
2. FPGA-based PWM control provides advantages like flexibility, high speed processing, and reprogrammability.
3. The FPGA generates the switching pulses for each H-bridge cell of the multilevel inverter independently to synthesize the stepped output voltage waveform.
The document describes applying an adaptive neuro-fuzzy inference system (ANFIS) for grade estimation of copper at the Sarcheshmeh porphyry copper deposit in Iran. ANFIS combines artificial neural networks and fuzzy logic to estimate copper grades based on sample coordinates. Training ANFIS adjusts membership functions to minimize error between predicted and actual grades. ANFIS achieved a higher R2 value of 0.8987 compared to 0.4571 for ANN and 0.6889 for kriging, demonstrating its ability to improve grade estimation.
This document summarizes a research paper about designing beampatterns for MIMO radar systems using a covariance-based method while accounting for the locations of transmitter antennas. It discusses how changing antenna locations is equivalent to changing carrier frequency. The paper proposes optimizing two cost functions: 1) Pushing sidelobes away from the main lobe to minimize interference, and 2) Maximizing power around target locations without extra sidelobes to improve target detection. It formulates these cost functions and outlines an algorithm to optimize them using the cross-correlation matrix and antenna locations as design variables.
A Generalized Regression Neural Network Approach to Wireless Signal Strength ...ijtsrd
This study presents a Generalized Regression Neural network GRNN based approach to wireless communication network field strength prediction. As case study, the rural area between the cities of Bauchi and Gombe, Nigeria, was considered. The GRNN based predictor was created, validated and tested with field strength data recorded from multiple Base Transceiver Stations at a frequency of 1800MHz. Results indicate that the GRNN based model with Root Mean Squared Error RMSE value of 5.8dBm offers significant improvements over the empirical Okumura and COST 231 Hata models. While the Okumura model overestimates the field strength, the COST 231 Hata significantly underestimates it. Finangwai D. Jacob | Deme C. Abraham | Gurumdimma Y. Nentawe "A Generalized Regression Neural Network Approach to Wireless Signal Strength Prediction" Published in International Journal of Trend in Scientific Research and Development (ijtsrd), ISSN: 2456-6470, Volume-4 | Issue-3 , April 2020, URL: https://www.ijtsrd.com/papers/ijtsrd30501.pdf Paper Url :https://www.ijtsrd.com/computer-science/artificial-intelligence/30501/a-generalized-regression-neural-network-approach-to-wireless-signal-strength-prediction/finangwai-d-jacob
Lake sediment thickness estimation using ground penetrating radareSAT Publishing House
This document summarizes a study that used ground penetrating radar (GPR) to estimate the thickness and volume of sediments in Punem Lake, India. GPR profiles identified two sediment layers in the lake. The thickness of the first layer ranged from 0.02m to 1.16m with an average of 0.5m, while the second layer ranged from 0.08m to 0.99m with an average of 0.37m. Sediment volume was estimated at 260,303 cubic meters for the first layer and 188,171 cubic meters for the second layer. Thicker sediments were found toward the north, northeast, and east of the lake for the first layer and toward the north, northeast, and west for
Similar to Contraction polígonal networks, topologic characterization (20)
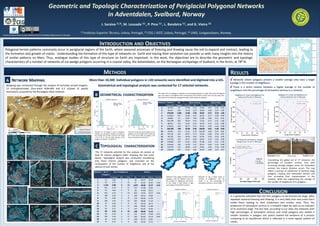
1. Geometric and Topologic Characterization of Periglacial Polygonal Networks
in Adventdalen, Svalbard, Norway
J. Saraiva (1,3), M. Lousada (1) , P. Pina (1) , L. Bandeira (1), and G. Vieira (2)
(1) Instituto Superior Técnico, Lisboa, Portugal, (2) CEG / IGOT, Lisboa, Portugal, (3) UNIS, Longyearbyen, Norway.
Research developed within the project ANAPOLIS (PTDC/CTE-SPA/099041/2008),funded by FCT (Portugal)
INTRODUCTION AND OBJECTIVES
Polygonal terrain patterns commonly occur in periglacial regions of the Earth, where seasonal processes of freezing and thawing cause the soil to expand and contract, leading to
the formation and growth of cracks. Understanding the formation of this type of networks on Earth and tracing their evolution can provide us with many insights into the history
of similar patterns on Mars. Thus, analogue studies of this type of structure on Earth are important. In this work, the objectives are to describe the geometric and topologic
characteristics of a number of networks of ice-wedge polygons occurring in a coastal valley, the Adventdalen, on the Norwegian archipelago of Svalbard, in the Arctic, at 78⁰ N.
METHODS RESULTS Adventdalen Topographic Map and ESRI Base Maps
A NETWORK MAPPING More than 10,300 individual polygons in 120 networks were identified and digitized into a GIS. Networks where polygons present a smaller average area have a larger
average in the number of neighbours.
Mapping was conducted through the analysis of remotely sensed imagery: Geometrical and topological analysis was conducted for 17 selected networks. There is a direct relation between a higher average in the number of
53 orthophotomaps (four-band RGB+NIR and 0.2 m/pixel of spatial
neighbours and the percentage of tetravalent vertices in a network.
resolution), acquired by the Norwegian Polar Institute.
The mean axis of a polygon is defined as the average between its major and minor orthogonal
B GEOMETRICAL CHARACTERIZATION axes; the aspect or elongation ratio corresponds to the division of the minor by the major axis.
The values in the table are averages for each of the networks selected.
Neighbours Vs. Areas and Neighbours Vs.
Vertices (tri) for the 17 Networks
Neighbours Vs. Areas and Neighbours Vs.
Vertices (tetra) for the 17 Networks
Network Network Nb. Mean Axis (m) Aspect Ratio
Area (m2) Polygons Average Min Max Average Min Max
1 20,572 95 17.08 9.14 31.83 0.67 0.32 0.93
2 49,157 262 15.58 5.24 36.69 0.69 0.24 1.00
3 270,529 1,666 14.68 3.50 46.65 0.71 0.19 1.00
4 114,631 671 14.49 4.51 65.04 0.71 0.28 0.99
5 28,882 95 19.87 7.86 53.98 0.66 0.31 0.95
6 264,199 821 20.29 5.43 71.62 0.71 0.31 1.00
7 88,612 253 21.67 6.22 50.76 0.72 0.37 0.98
8 178,501 264 28.77 6.23 95.69 0.69 0.28 0.98
9 255,783 328 32.28 8.46 100.92 0.67 0.30 0.99
Network 3 is the largest in area; its polygons, Network 9 is also among the largest, but its 10 59,781 116 21.51 6.70 162.99 0.69 0.25 0.96
however, are among the smallest, according to polygons are much larger, with a mode over 11 87,118 161 26.67 5.73 63.58 0.68 0.30 0.95
the average value of their mean axis; the mode 25 m and almost 80% of polygons with
is 10 to 15 m, and the large majority of the mean axis between 20 and 40 m. 12 99,110 216 24.43 4.44 67.92 0.70 0.35 0.99
polygons sit between 10 and 20 m. 13 112,765 215 26.57 8.69 58.69 0.70 0.29 0.98 % of Vertex (tri and tetra) Vs. Average
14 139,684 197 31.01 8.56 67.08 0.67 0.21 1.00 Polygon areas for the 17 Networks
15 154,644 294 25.78 7.67 99.19 0.69 0.33 0.98
C TOPOLOGICAL CHARACTERIZATION 16 129,783 215 28.08 9.42 59.83 0.68 0.28 0.96
17 130,645 357 21.01 4.85 83.02 0.68 0.25 0.97
The 17 networks selected for this analysis all contain at
least 20 interior polygons (after stripping the two outer Tetravalent Vertex (field views) Trivalent Vertex
layers). Topological analysis was conducted considering
only those interior polygons, and consisted on the Considering the global set of 17 networks, the
percentage of trivalent vertices rises with
computation of the number of neighbours and of the
increasing average polygon areas; for tetravalent
valence of each vertex.
vertices, the inverse situation occurs. This may
Network Nb. of Nb. of Neighbours Vertices reflect a process of subdivision of formerly large
Polygons polygons, creating new tetravalent vertices and
Average Min Max Nb % Tri %Tetra % Penta Network 3 has a large number of small Network 13 has a lower mean in thus increasing their representation in the
1 21 6.62 5 9 46 69.57 30.43 ---
polygons, with the highest mean for number of neighbours, and the network, while also augmenting the average of
the number of neighbours and seven mode is six; the percentage of
2 44 6.75 4 10 97 63.92 34.02 2.06 as the mode; it also shows a high tetravalent vertices is much lower.
the number of neighbours of its polygons.
3 1,132 6.98 3 12 1,875 68.00 31.57 0.43 percentage of tetravalent vertices.
4 415 6.78 3 11 737 75.98 24.02 ---
5
6
7
25
433
108
6.64
6.73
6.25
5
4
3
9
14
9
58
822
70.69
74.94
29.31
24.57
---
0.49 CONCLUSION
249 89.16 10.84 --- It is generally admitted that the first polygons to be formed are large. After
8 43 6.02 4 8 134 88.06 11.94 ---
9 108 6.29 3 10
repeated seasonal freezing and thawing, it is very likely that new cracks form
265 88.68 11.32 ---
10 35 6.66 5 9 70 64.29 35.71 --- inside them, leading to their subdivision into smaller ones. Thus, the
11 37 6.03 4 11 100 89.00 11.00 --- proportion of tetravalent vertices in a network might be seen as an indicator
12 56 6.27 4 9 147 84.35 15.65 --- of its evolution stage. The fact that, according to our data, the networks with
13 69 6.13 4 10 168 88.69 11.31 --- high percentages of tetravalent vertices and small polygons also exhibit a
14 58 6.53 3 11 141 83.69 15.60 0.71
15 146 6.44 4 11 303 84.82 14.19 0.99
smaller variation in polygon size, points toward the existence of a process
16 40 6.18 3 8 108 85.19 14.81 --- conducing to an equilibrium which is reflected in a more regular pattern of
17 77 6.27 4 9 201 82.59 17.41 --- cracks.