PR A CTI C E P R O B L E M S
Position, Velocity, Acceleration
Graphs
SPS8. Students will determine relationships among
force, mass, and motion.
a. Calculate velocity and acceleration.
2.
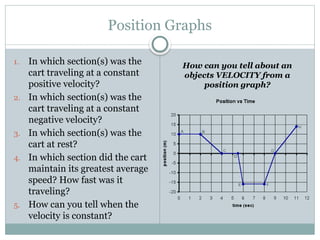
Position Graphs
1. Inwhich section(s) was the
cart traveling at a constant
positive velocity?
2. In which section(s) was the
cart traveling at a constant
negative velocity?
3. In which section(s) was the
cart at rest?
4. In which section did the cart
maintain its greatest average
speed? How fast was it
traveling?
5. How can you tell when the
velocity is constant?
How can you tell about an
objects VELOCITY from a
position graph?
3.
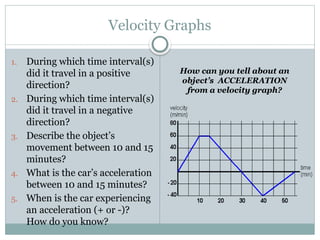
Velocity Graphs
1. Duringwhich time interval(s)
did it travel in a positive
direction?
2. During which time interval(s)
did it travel in a negative
direction?
3. Describe the object’s
movement between 10 and 15
minutes?
4. What is the car’s acceleration
between 10 and 15 minutes?
5. When is the car experiencing
an acceleration (+ or -)?
How do you know?
How can you tell about an
object’s ACCELERATION
from a velocity graph?
4.
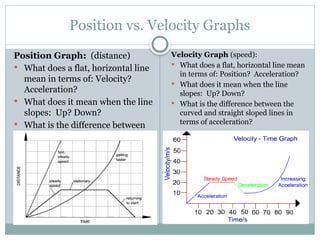
Position vs. VelocityGraphs
Position Graph: (distance)
What does a flat, horizontal line
mean in terms of: Velocity?
Acceleration?
What does it mean when the line
slopes: Up? Down?
What is the difference between
the curved and straight sloped
lines in terms of velocity and
acceleration?
Velocity Graph (speed):
What does a flat, horizontal line mean
in terms of: Position? Acceleration?
What does it mean when the line
slopes: Up? Down?
What is the difference between the
curved and straight sloped lines in
terms of acceleration?
5.
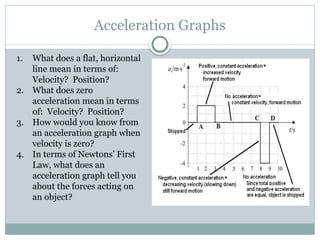
Acceleration Graphs
1. Whatdoes a flat, horizontal
line mean in terms of:
Velocity? Position?
2. What does zero
acceleration mean in terms
of: Velocity? Position?
3. How would you know from
an acceleration graph when
velocity is zero?
4. In terms of Newtons’ First
Law, what does an
acceleration graph tell you
about the forces acting on
an object?
6.
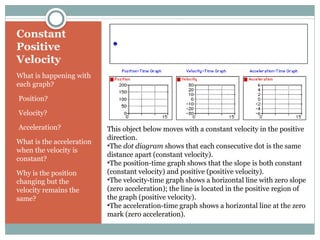
Constant
Positive
Velocity
What is happeningwith
each graph?
•Position?
•Velocity?
•Acceleration?
What is the acceleration
when the velocity is
constant?
Why is the position
changing but the
velocity remains the
same?
This object below moves with a constant velocity in the positive
direction.
•The dot diagram shows that each consecutive dot is the same
distance apart (constant velocity).
•The position-time graph shows that the slope is both constant
(constant velocity) and positive (positive velocity).
•The velocity-time graph shows a horizontal line with zero slope
(zero acceleration); the line is located in the positive region of
the graph (positive velocity).
•The acceleration-time graph shows a horizontal line at the zero
mark (zero acceleration).
7.
Constant
Negative
Velocity
What is happeningwith
each graph?
•Position?
•Velocity?
•Acceleration?
Why does the position
graph slope downward?
Why is the velocity
graph negative?
Why is the acceleration
graph at zero?
This object below moves with a constant velocity in the negative
direction.
The dot diagram shows that each consecutive dot is the same
distance apart (constant velocity).
The position-time graph shows that the slope is both constant
(constant velocity) and negative (negative velocity).
The velocity-time graph shows a horizontal line with zero slope
(zero acceleration); the line is located in the negative region of
the graph (negative velocity).
The acceleration-time graph shows a horizontal line at the zero
mark (zero acceleration).
8.
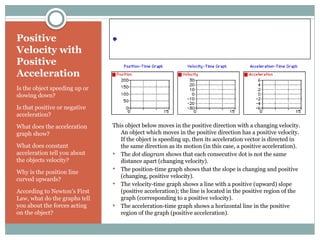
Positive
Velocity with
Positive
Acceleration
Is theobject speeding up or
slowing down?
Is that positive or negative
acceleration?
What does the acceleration
graph show?
What does constant
acceleration tell you about
the objects velocity?
Why is the position line
curved upwards?
According to Newton’s First
Law, what do the graphs tell
you about the forces acting
on the object?
This object below moves in the positive direction with a changing velocity.
An object which moves in the positive direction has a positive velocity.
If the object is speeding up, then its acceleration vector is directed in
the same direction as its motion (in this case, a positive acceleration).
The dot diagram shows that each consecutive dot is not the same
distance apart (changing velocity).
The position-time graph shows that the slope is changing and positive
(changing, positive velocity).
The velocity-time graph shows a line with a positive (upward) slope
(positive acceleration); the line is located in the positive region of the
graph (corresponding to a positive velocity).
The acceleration-time graph shows a horizontal line in the positive
region of the graph (positive acceleration).
9.
Positive
Velocity and
Negative
Acceleration
Is theobject speeding up or
slowing down?
Is that positive or negative
velocity?
What does the acceleration
graph show?
What would happen to the
objects movement if the
object keeps moving at a
constant, negative velocity?
According to Newton’s
First Law, what do the
graphs tell you about the
forces acting on the object?
This object below moves in the positive direction with a changing velocity.
An object which moves in the positive direction has a positive velocity. If
the object is slowing down then its acceleration vector is directed in the
opposite direction as its motion (in this case, a negative acceleration).
The dot diagram shows that each consecutive dot is not the same
distance apart (changing velocity).
The position-time graph shows that the slope is changing positive
(changing, positive velocity).
The velocity-time graph shows a line with a negative (downward) slope
(negative acceleration); the line is located in the positive region of the
graph (positive velocity).
The acceleration-time graph shows a horizontal line in the negative
region of the graph (negative acceleration).
10.
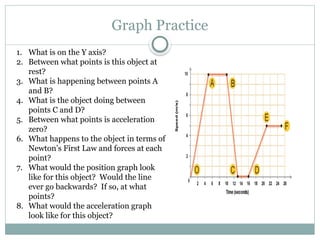
Graph Practice
1. Whatis on the Y axis?
2. Describe how this object is
moving.
3. Does this object ever stop?
4. When is it moving slowest?
5. When is it moving fastest?
6. When does the object have a
constant velocity? How do
you know? (What does
constant velocity look like on
a position graph?)
7. What does this tell you about
the object’s acceleration?
11.
Graph Practice
1. Whatis on the Y axis?
2. Between what points is this object at
rest?
3. What is happening between points A
and B?
4. What is the object doing between
points C and D?
5. Between what points is acceleration
zero?
6. What happens to the object in terms of
Newton’s First Law and forces at each
point?
7. What would the position graph look
like for this object? Would the line
ever go backwards? If so, at what
points?
8. What would the acceleration graph
look like for this object?
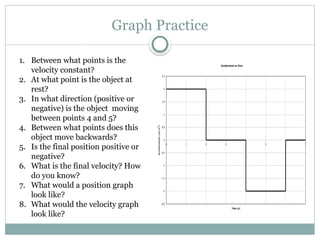
12.
Graph Practice
1. Betweenwhat points is the
velocity constant?
2. At what point is the object at
rest?
3. In what direction (positive or
negative) is the object moving
between points 4 and 5?
4. Between what points does this
object move backwards?
5. Is the final position positive or
negative?
6. What is the final velocity? How
do you know?
7. What would a position graph
look like?
8. What would the velocity graph
look like?
13.
1. CARS INGARAGE – CLASS ACTIVITY
2. SONG: POSITION, VELOCITY,
ACCELERATION
3. VELOCITY & ACCELERATION - PRACTICE
& PROBLEM SOLVING WORKSHEETS
4. VELOCITY & ACCELERATION GIZMO
5. GRAPHING VELOCITY & ACCELERATION
PROBLEMS
6. READ TEXTBOOK – CHAPTER 9
Do problems on page 331 (Relax, there are only 6 of them!)
Assignments
#2 F-G,G-H
B-C, D-E
A-B, C-D, E-F
D-E – 32 m/s
If the line is straight, velocity is constant. If the velocity is increasing or decreasing (acceleration) then the line will be curved.
#3 0-30
30-55
Moving at a constant velocity of 60 m/min
Zero
Any time the line is NOT flat and horizontal, there is an acceleration – change in velocity.
#4 Position:
Horizontal, flat line means the object is stopped – zero velocity, zero acceleration
Up: moving forward (positive velocity); Down: moving backwards (negative velocity)
Straight slope mans the object is moving at a constant velocity – speed is increasing at a steady rate (no acceleration)
Curved line means that the object’s velocity is increasing (or decreasing) and there is an acceleration because the velocity is changing
Velocity:
Any flat, horizontal line means an object is moving at a constant velocity – moving at a steady speed - but no acceleration (Newton’s first law – I keeps doing what it has been doing)
Up: increasing speed – positive acceleration; Down: decreasing speed – negative acceleration
Straight slope is constant acceleration – speed is changing at a constant rate
Curved slope is changing acceleration – speed is changing at an increasing (or decreasing) rate
#5 Constant positive acceleration means it is moving at an increasing velocity – speeding up – while constant negative velocity means it is moving at a decreasing velocity – slowing down
Zero acceleration means the object will keep doing what it has been doing – either continue moving at a constant velocity, or remaining at rest
When the total positive and negative acceleration equals zero – cancels each other out
If there is an acceleration then a force is acting on an object changing it motion.
#6 Discuss the relationship between graphs.
Constant velocity (flat, horizontal line) = zero acceleration
Constant velocity (flat, horizontal line) means it will keep moving at the same speed
How does this apply to Newtons’ Laws?
#7 Discuss the relationship between graphs.
Negative velocity means it is moving backwards – downward slope.
Negative velocity means reverse motion.
Constant velocity (flat, horizontal line) means no acceleration although it is still moving.
How does this apply to Newton’s Laws?
#8 Speeding up
Positive, Constant acceleration
Position line is curved because velocity is changing (Increasing speed)
Speed is not constant – it is moving faster and faster each second but with a constant acceleration so the velocity line has a straight slope
Because there is an acceleration – a change in motion – there is a net force acting on the object
#9 Slowing down
Constant, negative acceleration
Position line is curved because velocity is changing (decreasing speed)
Speed is not constant – it is moving slower and slower each second but with a constant, negative acceleration so the velocity line has a straight slope
Because there is an acceleration - a change in motion – there is a net force acting on the object, only this time the force is in the opposite direction
#10 1. Distance
2. Moves forward slowly (1), then faster (2), then backwards (3-4), then forward again much faster (4-7), then slower (7-8), then backwards again (8-10) – since all line segments are straight, all velocity is constant
3. Not according to this graph
0-1
4-7
Each section has a constant velocity because the position is changing at a steady rate – Any straight line is constant velocity
The object is accelerating each time the velocity changes, and the acceleration is constantly changing
#11 Speed (velocity)
C-D
Constant velocity – moving forward at a constant speed
Stopped (at rest)
A-B, C-D, E-F
O-A, B-C, D-E = force, all others = no net force
O-A moving forward, curving upward, A-B moving forward, constant slope, B-C moving forward at slower speed and curving down, C-D stopped – no movement, D-E moving forward again slower speed than before, E-F moving forward, steady slope – this object never goes backwards
O-A positive acceleration, A-B, no acceleration, B-C negative, C-D none, D-E positive, E-F none
#12 2-3
At the end (6-7)
Positive (forward) – just at a slower velocity
It doesn’t
Positive – it never goes backwards because there is never a net negative acceleration
Zero – because the sum of the positive forces is equal to the sum of the negative ones
Moving forward with an upwards curve (0-2), then continues forward with a steady slope (2-4), then still moves forward but with a downwards curve (4-6), then it stops (straight line)
Steady increase in velocity – steady slope up (0-2), then straight line, constant velocity (2-4), then decrease in velocity – steady slope down (4-6), the stopped