1. Drift During Overground
Locomotion in Newly Hatched
Chicks Varies With Light
Exposure During Embryogenesis
ABSTRACT: In an earlier study of newly hatched chicks we reported that
continuous bright light exposure throughout incubation accelerated locomotor
development and continuous dark exposure delayed it, compared to less intense,
intermittent light exposure. Commonly studied gait parameters indicated
locomotor skill was similar across groups. However, dark incubated chicks
walked with a greater step width, raising the possibility of differences in dynamic
balance and control of forward progression. In this study, we established
methods to retrospectively examine the previously published locomotor data for
differences in lateral drift. We hypothesized that chicks incubated in darkness
would exhibit more drift than chicks incubated in light. Analyses identified
differences in forward progression between chicks incubated in the two extreme
light conditions, supporting the study’s hypothesis. We discuss the significance of
our findings and potential design considerations for future studies of light-
accelerated motor development in precocial and nonprecocial animals. ß 2015
Wiley Periodicals, Inc. Dev Psychobiol 57:459–469, 2015.
Keywords: navigation; motor control; walking; kinematics; neonatal
INTRODUCTION
It is well established in birds that light exposure during
embryogenesis can accelerate morphogenesis (Coleman
& McDaniel, 1976; Ghatpande, Ghatpande, Khan,
1995), promote greater motor activity (Wu, Streicher,
Lee, Hall, Muller, 2001) and the onset of hatching
(Bohren & Siegel, 1975; Fairchild & Christensen,
2000). However, investigation into the impact of
extended prenatal exposure on postnatal motor develop-
ment has been limited (Sindhurakar & Bradley, 2010).
Studies have examined the effects of light exposure in
the final days before hatching, providing evidence that
light is a salient stimulus capable of influencing vision-
mediated behavior (Casey & Lickliter, 1998; Rogers,
1982; Rogers & Bolden, 1991), hemispheric special-
ization (Casey, 2005; Casey & Martino, 2000; Rogers,
1982), and social behavior (Rogers, 1982). A few
studies in domestic chicks have also shown that
extended light exposure during embryogenesis can
accelerate development of respiratory control (Bradley
& Jahng, 2003), interlimb stepping prior to hatching
(Ryu & Bradley, 2009; Sindhurakar & Bradley, 2012),
and overground locomotion at hatching (Sindhurakar &
Bradley, 2010). However, it has yet to be determined if
this acceleration in motor development is associated
with any immediate or longer term negative behavioral
or other biological consequences.
In a study examining the impact of light on develop-
ment of overground locomotion, chicks incubated in
continuous bright light hatched and began walking 1–2
days earlier than chicks incubated in less or no light
(Sindhurakar & Bradley, 2010). Despite early hatching,
these chicks appeared to walk with an equivalent level
Manuscript Received: 17 December 2014
Manuscript Accepted: 11 March 2015
Correspondence to: Nina S. Bradley
Contract grant sponsor: National Institute of Child Health and
Human Development
Contract grant number: ROI HD 053367
Article first published online in Wiley Online Library
(wileyonlinelibrary.com): 11 April 2015
DOI 10.1002/dev.21306 ß 2015 Wiley Periodicals, Inc.
Developmental Psychobiology
Jay H. Porterfield1
Anil Sindhurakar2
James M. Finley3
Nina S. Bradley3
1
Department of Biomedical Engineering
Viterbi School of Engineering of University
of Southern California
Los Angeles, CA
2
Motor Recovery Laboratory
Burke-Cornell Medical Research Institute
White Plains, NY
3
Division of Biokinesiology and Physical
Therapy
Herman Ostrow School of Dentistry of
University of Southern California
Los Angeles, CA
E-mail: nbradley@usc.edu
2. of skill compared to those incubated in 12L and 24D
conditions. Skill was assessed using measures derived
from consecutive foot placements. Curiously, chicks
incubated in continuous darkness walked with a greater
step width than chicks incubated in continuous bright
light. The greater step width raised the possibility that
dark-incubated hatchlings had less mature dynamic
balance control (Sindhurakar Bradley, 2010). During
walking, dynamic balance control is required for
normal forward progression. If vision, vestibular, or
somatosensory inputs for balance control are manipu-
lated, human subjects show deficits in navigation ability
and begin to drift, e.g., lateral veering from a predicted
vector of forward progression (Bestaven, Guillaud,
Cazalets 2012; Boyadjian, Marin, Danion, 1999;
Earhart et al., 2001; Fitzpatrick, Wardman, Taylor,
1999). In our first study we did not examine path
trajectory. Thus it remained to be determined if
navigation differed between hatchlings incubated in
less or more light and if drift might be greater in chicks
incubated in continuous darkness.
In this study, we examined navigation performance
as an indicator of dynamic balance and specifically
sought to determine if measures of drift during forward
progression varied with light exposure during incuba-
tion. We hypothesized that if chicks incubated in
continuous darkness had less mature dynamic balance,
they would exhibit more drift compared to chicks
incubated in light 12 or 24 hr daily. To this end,
methods were established to quantify forward progres-
sion, e.g., path length, and the step-by-step lateral
deviations in forward progression, e.g., foot placement
angles. Measures of path length were examined to
determine the overall efficiency of forward progression
and foot placement angles to determine the magnitude,
variability, and potential bias of lateral drift during
forward progression. We applied these methods of
analysis to previously published locomotor data (Sind-
hurakar Bradley, 2010) and report the findings for a
novel retrospective analysis. Evidence is provided
indicating that drift during overground locomotion
varied with light exposure during embryogenesis and
that chicks incubated in darkness navigated with the
most drift, consistent with our hypothesis. The signifi-
cance of our key findings and considerations for future
studies are discussed.
METHODS
Subjects and Incubation Conditions
Fertile Leghorn chicken (Gallus gallus) eggs from a local
hatchery were incubated in standard poultry incubators
modified to house fluorescent lighting. Incubation conditions
for this study were previously described (Sindhurakar
Bradley, 2010, 2012). In brief, incubators were configured for
one of three light exposures that varied light intensity and
exposure duration: 650–3,000 lux, 12 hr daily (12L); 4,000–
7,000 lux, 24 hr daily (24L); or 1 lux, 24 hr daily (24D). A
total of 30 hatchlings were incubated in one of the three light
exposure conditions, 10 hatchlings per condition. Hatchlings
were maintained in a brooder before training and between
data collection sessions. Hatchlings were euthanized by lethal
injection at the end of data collection. All procedures were
approved by the University Institutional Animal Care and Use
Committee.
Testing Procedures
Testing procedures were previously reported (Sindhurakar
Bradley, 2010) and only key methods for analyses are
reported here. Within 2–3 hr after hatching, chicks were first
trained to attend and walk toward finger taps accompanied by
the tester’s vocal encouragement. They were then trained to
walk from end to end along a tunnel (90 cm  9 cm  12 cm)
fabricated from black poster board and having a Plexiglas
floor. The chicks were placed in a darkened chamber at the
starting end of the walkway and then cued by tapping and
voice to walk to the other (lightened) end when a trap door
was lifted. Chicks were included in the study if they walked
the full length of the walkway within three practice trials.
The metatarsal pads of both feet were marked and foot
placements were video recorded from beneath the tunnel. A
total of four walk trials from end to end were recorded during
each of two sessions spaced 4 hr apart. The first session was
conducted immediately after training.
Kinematic Analyses
Foot placements within the central 40 cm of the tunnel were
previously digitized (60 samples/s) to obtain two-
dimentional (2D) coordinates (x, y) for calculating basic
spatial (e.g., stride length) and corresponding temporal
parameters of gait (Sindhurakar Bradley, 2010). In this
study, the 2D coordinates were used to estimate the projected
location of the center of mass (COM) when both feet were in
contact with the floor and foot placement angle for each step
(Fig. 1). The COM positions and foot placement angles were
in turn used to quantify lateral deviation in forward progres-
sion based on four measures: path length, drift magnitude,
drift variability, and drift bias. Each measure is defined and
its calculation described within the following sections.
Stride Count
A stride is typically defined as two consecutive placements of
the ipsilateral foot and stride count is the sum of all strides
taken. For example, in Figure 1A, points one and two (closed
squares), identify two left foot placements, and together they
define one stride for the left foot (Perry, 1992). In this study,
stride count was operationally defined as the number of
consecutive ipsilateral strides taken to complete a walk trial,
e.g., nine strides of the left foot are shown in Figure 1A.
460 Porterfield et al. Developmental Psychobiology
3. Stride count was calculated for the left and right foot
separately for the first five experiments analyzed in each of
the three incubation conditions, as the number of strides
might differ between feet depending on the foot associated
with the initial and terminal foot placements within the
portion of the path video recorded. Also, a chick might briefly
pause along the walkway, then resume by taking a second
step with the same foot. However, 2-way analyses of variance
indicated there was no difference in total number of strides
for the left and right foot in either session I (p .3) or session
II (p .6), so strides of the left foot were selected for stride-
related analyses. We chose the left foot because it was also
selected as the reference foot for spatial parameters analyzed
in the earlier study, after determining there were no signifi-
cant left–right differences.
Path Length
The COM location was estimated for each step to calculate
three measures of path length as follows: (1) straight path
length, the shortest distance between the first and final step,
(2) total path length, the total distance traveled between the
first and final step, and (3) normalized path length, the ratio
of the total path length to the straight path length. The
distance midway between consecutive left-to-right and right-
to-left foot placements was calculated to estimate the COM
location for each step. For example, in Figure 1B, an “X”
identifies the estimated COM for four left-to-right foot place-
ments. COM locations were then used to calculate the straight
path length, defined as the longitudinal distance (x axis of
walkway) between the estimated COM for the first and last
steps, i.e., the horizontal distance between the 1st and 4th
“X” in Figure 1B. However, forward progression included
lateral deviations that increased the total distance COM
traveled. To capture all distance traveled, we used COM
location estimates to calculate the total path length, defined as
the sum of the resultant vectors formed by the forward and
lateral deviations for consecutive steps. The straight path
length was less than or equal to 40 cm, the length of the
digitized area, and varied from trial to trial because a portion
of the first and/or last step was outside the video region. The
variations in first and last step also contributed to total path
length variability, thus we also calculated a normalized path
length, defined as the total path length relative to the straight
path length for each trial. A normalized total path length of
1.0 indicated no lateral drift in forward progression and
values 1.0 indicated drift to one or both sides during
forward progression.
A Matlab
1
(Mathworks, Natick, MA) function was
developed to automate the calculation of total path length,
straight path length and normalized path length for each walk
trial. Left and right foot placements were first identified by
successive stride number. For example, the first left foot
placement in a given walk trial was (Lx1, Ly1), as illustrated
in Figure 1C. The function used the 2D coordinates for foot
placements to calculate the estimated location of the center of
mass (eCOM) between successive placements of the left (Lx1,
Ly1) and right foot (Rx1, Ry1) (Equations 1 and 2). The
function then calculated the distance between successive
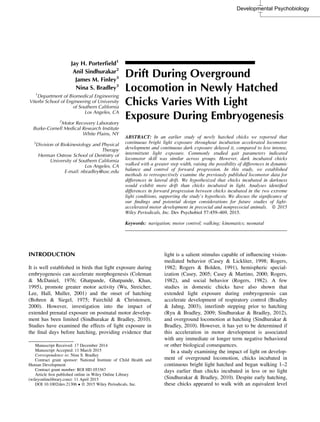
FIGURE 1 Kinematic analysis of navigation. (A) Digitized
locations of foot placements are shown for consecutive steps
progressing from right to left during one walk trial. Foot
placements were video recorded from beneath the walkway,
reversing left–right orientation for the left foot (LF, closed
squares) and right foot (RF, open squares). This trial was
selected from a hatchling incubated in 12L conditions. (B)
The estimated center of mass location, noted by an “X or •,”
is shown for consecutive steps of the left foot to right (X) and
right foot to left (•) during 1 walk trial for a chick incubated
in 12L conditions. Center of mass locations were used to
complete path length analyses (see Methods for details). (C)
Methods for measurement of left foot placement angle (a1)
are shown for the first of two foot placements, identified by
the step vector (VS1). Terms (LXi, LYi) defined the 2D
coordinates of each left placement. The progression vector
(VX1) defined forward progression relative to the foot place-
ment coordinates and the basis vector (VB1) extended
orthogonal to VX1 (see text for details). An a 908 indicated
the stride deviated to the left of VX1 during forward
progression.
Developmental Psychobiology Drift During Forward Progression in Chicks 461
4. eCOM coordinates and summed the distances (Equation 3) to
generate the total path length (PL).
eCOMxi ¼
Lxi þ Rxi
2
ð1Þ
eCOMyi ¼
Lyi þ Ryi
2
ð2Þ
PL ¼
XnÀ1
i¼1
ffiffiffiffiffiffiffiffiffiffiffiffiffiffiffiffiffiffiffiffiffiffiffiffiffiffiffiffiffiffiffiffiffiffiffiffiffiffiffiffiffiffiffiffiffiffiffiffiffiffiffiffi
eCOMxiþ1 À eCOMxið Þ2
þ
q
eCOMyiþ1 À eCOMyi
À Á2
ð3Þ
The two final iterations of the function computed the straight
path length (SPL) between the initial and final eCOM
(Equation 4), and the normalized total path length (PLnorm,
Equation 5).
SPL ¼
ffiffiffiffiffiffiffiffiffiffiffiffiffiffiffiffiffiffiffiffiffiffiffiffiffiffiffiffiffiffiffiffiffiffiffiffiffiffiffiffiffiffiffiffiffiffiffiffi
eCOMxf À eCOMxið Þ2
þ
q
eCOMyf À eCOMyi
À Á2
ð4Þ
PLnorm ¼ 100 Ã
PL À SPL
SPL
ð5Þ
Foot Placement Angle
Foot placement angle is a 2D (x, y) measure that can be used
to quantify the step by step lateral deviation during forward
progression. If each foot placement is directly in front of the
previous placement (e.g., x axis of walkway), the foot
placement angle is 908 relative to the y axis. In this study,
foot placement angle was defined as the exterior angle for
consecutive strides of the left foot, as represented by a in
Figure 1C. The a angle is often used as an indicator of foot
orientation relative to the direction of travel (Kernozek
Richard, 1990). We used foot placement angle to calculate
three measures indicative of lateral deviation in forward
progression: drift magnitude, drift variability, and drift bias.
The angle was calculated by first creating three vectors: VX,
VS, and VB (Figure 1C).
A forward progression unit vector (VX), defining forward
advancement in a straight path at each step, extended forward
from the foot placement and was parallel with the axis (x) of
the tunnel. The base vector (VB) was a unit vector that
extended through the foot placement coordinates and ran
orthogonal to VX. The stride vector (VS) extended from one
left foot placement to the next left foot placement and was
the resultant of the concurrent stride length and lateral
deviation in successive placements of the left foot. The foot
placement angle (a) was defined as the angle between VS and
VB at each foot placement (Zverev, 2006).
A Matlab
1
function was developed to automate the
calculation of foot placement angles. The 2D coordinates for
all left or right strides per walk trial were matrix-formatted as
an ASCII file for input to the function. The function
subtracted the difference in coordinates for successive foot
placements (Equation 6) to generate VS (Figure 1C). VB was
also generated for each foot placement. The function used a
1 Â 1 column vector (i.e., [0 1]) to generate VB at each foot
placement coordinate.
Vs ¼ Lxiþ1;yiþ1 À Lxi;yi ð6Þ
The second iteration calculated the dot product of a unit
vector in the direction of VS and VB, and took the arccosine
of the product. The third iteration subtracted the arccosine of
the product from 1808 to generate the exterior angle between
the base vector and stride vector (Equation 7).
a ¼ cosÀ1
ðVS Á VBÞ ð7Þ
Performance of the Matlab
1
function was verified by compar-
ing foot placement angles generated by the function with
angles measured by protractor. All foot placement angles for
nine experiments (72 walk trials), from the first three experi-
ments analyzed per condition, where manually measured.
Matlab-generated calculations were then compared to the
measured angles to confirm the accuracy of the algorithms.
Linear regression analyses for each of the nine experiments
indicated that there was uniformly strong agreement between
the measurement methods. Correlation coefficients ranged
from .95 to .99 and slopes from 1.02 to 1.11 for sample sizes
of 45–83 foot placement angles per experiment. Analyses for
120 walk trials (15 hatchlings, five per condition) also
indicated that placement angles did not differ between left
and right feet. Thus, left foot placement angles were used to
test for between group differences in three measures of lateral
drift with respect to the progression vector, because the left
foot was used as the reference for all gait parameters in the
earlier study.
Any stride creating an angle greater or less than 908
between VS and VB was considered a deviation from a
straight path, e.g., drift. Straight ahead was defined as
movement parallel to VX and orthogonal to VB (Figure 1C).
Drift magnitude (DM) quantified how much foot placement
deviated laterally during a single stride (Equation 8), and drift
variability was equal to the standard deviation of drift
magnitude. Drift bias (DB) determined the direction of lateral
deviation for each stride (Equation 9). DB was calculated and
averaged over all steps per session (four walk trials) to
determine if there was a drift bias within session.
DM ¼ j908 À aj ð8Þ
DB ¼ 908 À a ð9Þ
Statistical Analyses
We employed a within-subject and between group design. For
each subject, trial data were combined and averages were
462 Porterfield et al. Developmental Psychobiology
5. calculated for session I (trials 1–4) and session II (trials 5–8)
to perform statistical comparisons. Subject means were
compared using the two-way ANOVA analysis for repeated
measures. Averaged standard deviations were similarly calcu-
lated and tested as an indicator of differences in mean
variability across sessions and between groups. Pearson linear
regression analyses were used to determine the fit (R2
) and
slope for manually measured and automated calculation of
foot placement angle to confirm the performance of our
Matlab function. Significance was set at p .05. The Stu-
dent’s t-test was used for post hoc comparisons and the
significance level was adjusted for multiple comparisons
using a Bonferroni correction.
RESULTS
Our kinematic findings for stride-to-stride drift summa-
rize analyses for 240 walk trials equally representing
30 chicks, 10 chicks per incubation condition, eight
trials per chick. All chicks progressed toward the open
end of the walkway, walking the full length each trial.
Although chicks occasionally paused in route, no chick
backtracked toward the darkened chamber. Analyses
were derived from 1,626 strides, 36–83 strides per
chick. We first describe the general forward progression
behavior of hatchlings based on path analyses, then the
characteristics of lateral drift based on stride-by-
stride analyses of foot placement angles.
Stride Count and Path Length
Chicks typically took 6–10 strides to complete a walk
trial. On average, chicks incubated in 24L conditions
took the fewest strides per trial; chicks incubated in
24D took the most (Fig. 2A). The two-way ANOVA
indicated that the difference across incubation condi-
tions was significant, F(2,54) ¼ 8.6, p .0006. In
addition, the main effect for session indicated that
chicks took significantly fewer strides during session II
than session I, F(1,54) ¼ 11.8, p .001. The ANOVA
interaction was not significant, F(2,54) ¼ 2.7, p .08.
Post hoc analyses for group differences and a Bonfer-
roni correction for three comparisons (p .017) indi-
cated that chicks incubated in 24L took significantly
fewer strides to complete a walk trial than both chicks
incubated in 12L (p .01) and 24D (p .001).
The straight path length and total path length varied
across all trials, potentially masking real differences in
behavior (see Methods), whereas normalized path
length identified several significant findings. Normal-
ized path length indicated, as summarized in
Figure 2B, that chicks incubated in 24L tended to walk
the straightest path for any given distance and chicks
incubated in 24D tended overall to walk with greater
lateral deviation. The two-way ANOVA for normalized
path distance revealed a significant main effect of
incubation conditions F(2,54) ¼ 5.7, p .002. Also,
normalized path decreased from session I to session II,
F(1,54) ¼ 8.1, p .002. The interaction was not signifi-
cant. Post hoc analyses for group differences (Bonfer-
roni correction p .017) indicated that normalized path
length for chicks incubated in 24L was significantly
FIGURE 2 Stride count and normalized path distance
varied significantly across groups and between sessions. (A)
The group means and SD for number of strides per walk trial
are plotted by session (I, II) for chicks incubated in one of the
three light conditions (24L, 12L, 24D), N ¼ 10 hatchlings per
condition. Stride count varied significantly across incubation
conditions (a, p .0006) and between sessions (b, p .001).
Post hoc comparisons for incubation condition (a1) indicated
that hatchlings incubated in 24L took fewer steps than
hatchlings incubated in 12L (p .01) and 24D (p .001). (B)
The average normalized path length is plotted by session for
each incubation group. Normalized path length varied signifi-
cantly across incubation conditions (c, p .002) and between
sessions (d, p .002). Post hoc comparisons for the main
group effect (c1) indicated that the normalized path length
was less for hatchlings incubated in 24L compared to 24D
(p .0005).
Developmental Psychobiology Drift During Forward Progression in Chicks 463
6. less than for chicks incubated in 24D (p .0005).
Chicks walked a total path length of 28–42 cm and
a straight path length of 28–40 cm. There was no
difference in total path distance across incubation
conditions, F(2,54) ¼ 1.8, p .18, or between sessions,
F(1,54) ¼ 3.0, p .09, and the interaction was not
significant, F(2,54) ¼ .68, p .51. Further, there was no
difference in straight path distance across conditions, F
(2,54) ¼ 2.3, p .11, or session, F(1,54) ¼ 2.0, p .17,
and the interaction was not significant, F(2,54) ¼ .45,
p .64.
Drift Magnitude and Variability
Individual foot placement angles varied from 08 to 848
and trial averages ranged from 28 to 228. Two
exemplary walk trials from a 12L experiment are
shown in Figure 3. The magnitude of foot placements
angles is summarized by group and session in
Figure 4A. Chicks incubated in 24L conditions exhib-
ited the smallest angles and chicks in 24D exhibited
overall the greatest angles. The two-way ANOVA
indicated that foot placement angles differed across
conditions, F(2,54) ¼ 8.6, p .0006, and decreased
from session I to session II (Fig. 4A), F(1,54) ¼ 11.9,
p .001. The interaction was not significant, F
(2,54) ¼ 2.8, p .07. Post hoc comparisons for group
differences (Bonferroni correction p .017) indicated
that foot placement angles were smaller for chicks
incubated in 24L conditions compared to chicks
incubated in 12L (p .008) and 24D (p .002).
FIGURE 3 Exemplary plots of two walk trials from a
hatchling incubated in the 12L condition. (A) The 11
digitized foot placements (closed squares) identify 10 (num-
bered) strides of the left foot for one trial during session I.
The extent of lateral deviation (drift) during forward pro-
gression was most apparent for trials in session I, e.g., note
the larger lateral deviations for foot placements for strides 6–
10. (B) The eight digitized foot placements identify seven
strides for a trial in session II. Forward progression is
relatively straight-ahead due to minimal drift.
FIGURE 4 Comparisons for foot placement angle magni-
tude and variability across incubation conditions and between
sessions. (A) Group means and SD are plotted for absolute
foot placement angles as a measure of drift magnitude in
session I and II. Placement angle magnitude varied signifi-
cantly across incubation conditions (a, p .0006) and
between sessions (b, p .001). Post hoc comparisons for
incubation condition (a1) indicated placement angle magni-
tudes were smaller for chicks incubated in 24L compared to
12L (p .008) and 24D (p .002). (B) Average variability of
absolute foot placement angles are plotted as a measure of
drift magnitude variability. Variability differed significantly
across incubation conditions (c, p .03), between sessions (d,
p .003), and the interaction (i) was significant F(2,54) ¼ 5.7,
p .006. Post hoc comparisons indicated that during session I
(i1) chicks incubated in 24L exhibited less drift variability
than chicks incubated in 12L (p .006) and that chicks
incubated in 12L reduced drift variability (i2) from session I
to II (p .0004).
464 Porterfield et al. Developmental Psychobiology
7. Foot placement angle variability for each walk trial
ranged from 18 to 318 (Fig. 4B). The two-way ANOVA
indicated there was a significant difference in drift
magnitude variability across conditions, F(2,54) ¼ 3.8,
p .03, and that variability decreased from session I to
II, F(1,54) ¼ 9.8, p .003. The interaction was also
significant F(2,54) ¼ 5.7, p .006. Post hoc compari-
sons (Bonferroni correction p .0083) indicated that
chicks incubated in 24L exhibited less variability than
chicks incubated in 12L during session I (p .006),
and chicks incubated in 12L achieved a significant
reduction in drift variability from session I to session II
(p .0004).
Drift Bias
With few exceptions, average foot placement angle for
all hatchlings fell within Æ 38 of the progression vector,
and group averages for foot placement angle were near
08 for both sessions I and II (Fig. 5A). The two-
way ANOVA indicated that there were no differences
in drift bias across incubation conditions, F(2,54) ¼ 2.5,
p .09, or between sessions, F(1,54) ¼ .04, p .84,
and the interaction was not significant, F(2,54) ¼ 1.8,
p .18.
Drift bias variability, like drift magnitude and
variability, generally appeared to be least for chicks
incubated in 24L and greatest for chicks incubated in
24D (Fig. 5B). Two-way ANOVA analyses indicated
that drift bias variability differed across conditions, F
(2,54) ¼ 6.7, p .003, and decreased from session I to
session II, F(1,54) ¼ 12.2, p .001. The interaction was
also significant, F(2,54) ¼ 4.4, p .02. The post hoc
comparisons between conditions (Bonferroni correction
p .017) indicated that hatchlings incubated in 24L
conditions progressed forward with less drift bias
variability than hatchlings incubated in 12L (p .009)
and 24D (p .004). Post hoc comparisons for the
interaction (Bonferroni correction p .01) indicated
that hatchlings incubated in 24L conditions exhibited
less drift bias variability than hatchlings incubated in
12L during session I (p .003) and that hatchlings
incubated in 12L conditions exhibited less variability
than in 24D conditions during session II (p .009).
Further, hatchlings incubated in 12L significantly
reduced drift bias variability from session I to session
II (p .001).
DISCUSSION
Incubation in continuous bright light (24L conditions)
throughout embryogenesis promotes accelerated devel-
opment of interlimb stepping (Sindhurakar Bradley,
2012) and walking with the completion of early
hatching (Sindhurakar Bradley, 2010). Conversely,
incubation in the absence of light (24D conditions)
throughout embryogenesis delays development of these
motor milestones. Although we found no clear negative
impact of dark exposure on gait at hatching in our
FIGURE 5 Comparisons for mean drift bias direction and
drift bias variability across incubation conditions and between
sessions. (A) Group means and SD are plotted for foot
placement angle as an indication of direction in drift bias for
session I and II, positive means indicate that average bias was
leftward directed. No significant differences were found for
drift bias across conditions or between sessions. (B) Average
drift bias variability is plotted. Variability differed signifi-
cantly across incubation conditions (a, p .003), between
sessions (b, p .001) and the interaction (i) was significant
(p .02). Post hoc results for incubation condition indicated
hatchlings incubated in 24L (a1) exhibited less drift bias
variability than in 12L (p .009) or 24D (p .004). Post hoc
results for the interaction indicated that hatchlings incubated
in 24L were less variable than chicks incubated in 12L during
session I (i1, p .003), and chicks incubated in 12L were less
variable than those incubated in 24D (i2, p .009). Chicks
incubated in 12L significantly reduced drift bias variability
from session I to II (i3, p .001).
Developmental Psychobiology Drift During Forward Progression in Chicks 465
8. earlier study, we observed that chicks incubated in 24D
conditions walked with a greater step width than chicks
incubated in 24L, and proposed that the wider-
based gait might indicate less optimal balance control
(Sindhurakar Bradley, 2010). In this retrospective
study, we further examined their locomotor perform-
ance to determine if there was additional evidence of
subtle differences in motor skill not detected by our
original analyses. We hypothesized that the dark
incubated chicks would exhibit more drift, e.g., ataxia,
during forward locomotion than chicks incubated in
12L or 24L conditions. We predicted there would be a
relationship between step width and forward navigation
because increasing step width, and thereby enlarging
the base of support, has been shown to be an effective
strategy for increasing stability in the medio-
lateral direction (McAndrew Young Dingwell, 2012).
This strategy is commonly observed when postural
stability is threatened, or when the sensorimotor
processes responsible for balance control are compro-
mised. In humans, when balance is threatened by the
possibility of a trip, step width is increased in
anticipation of a potentially destabilizing perturbation
(Pijnappels, Bobbert, Van Dieen, 2001). Addition-
ally, if the sensory signals used for balance control,
such as vision or proprioception, are compromised,
individuals will also increase step width to expand their
base of support (Bauby Kuo, 2000; Richardson,
Thies, DeMott, Ashton-Miller, 2004). Increases in step
width are also observed in pathological conditions
affecting the cortical or cerebellar circuits involved in
balance control (Chen, Patten, Kothari, Zajac, 2005;
Stolze et al., 2002).
Given the presumably slower rate of morphologic
maturation (Sindhurakar Bradley, 2012) and progres-
sion towards hatching (Sindhurakar Bradley, 2010),
we considered that chicks incubated in 24D conditions
might take wider steps because the neural structures
responsible for dynamic balance control also might be
less mature. This may include, for example, an inability
to use available visual cues for balance control due to
delayed visual pathway development in the absence of
light exposure during embryogenesis (Rogers Bol-
den, 1991). In other words, light during incubation may
be a necessary stimulus to enable chicks to optimize
the use of visual information posthatching, particularly
during functional activities such as walking. Alterna-
tively, the integration of balance-related sensory infor-
mation may have been compromised because the
vestibular system was less mature than in hatchlings
incubated in light. This is consistent with observations
from a recent study demonstrating that chicks incubated
in 24D had greater sway amplitude and sway velocity
than chicks incubated in 12L or 24L (Racz, Sindhur-
akar, Bradley, Valero-Cuevas, 2011). Another poten-
tial source of differences in balance control could be
biomechanical. Though there were no differences in
egg weight, body weight or toe length, tibia length
varied positively with light exposure and was signifi-
cantly shorter for chicks incubated in 24D compared to
24L. Further, differences in muscle activity and practice
of locomotor-related leg movements in ovo (Sindhur-
akar Bradley, 2012), might have contributed to
differences in balance control at hatching. Both muscle
fiber development and muscle activity are enhanced by
light exposure and also contribute to bone maturation
(Hall Herring, 1990; Liu, Wang, Chen, 2010). If
the observed differences in dynamic postural stability
stemmed from a 1–2 day delay in maturation, one
might expect that 24–48 hr after hatching, chicks
incubated in 24D would perform comparably to chicks
incubated in 24L upon hatching. However, this remains
to be explored.
In this retrospective analysis of forward progression
we identified four key findings relative to our hypoth-
esis. One, chicks incubated in 24L conditions exhibited
the least drift during forward navigation, consistently
outperforming chicks incubated in 24D. Two, there was
less apparent difference in navigation parameters
between chicks incubated in 24D and 12L conditions,
though small consistent trends were noted suggesting
potential benefits of less intense light relative to dark
exposure. Three, all chicks acquired greater navigation
skill over a 4 hr period on the day of hatching. Four,
under the constraints of our experimental paradigm,
chicks did not exhibit a drift bias, e.g., evidence of
laterality during forward navigation. We consider these
points in the sections that follow.
Chicks Incubated in 24L Conditions Exhibited
the Most Efficient Forward Navigation
Chicks exposed to continuous bright light throughout
embryogenesis navigated with the greatest locomotor
skill, significantly outperforming chicks incubated in
24D, thus supporting the study’s hypothesis that chicks
incubated in 24D would exhibit more drift. Chicks
incubated in 24L conditions took fewer strides per trial
and walked a shorter normalized path to cover the
same total and straight line distance. The fewer strides
and shorter normalized path could be partly attributable
to slightly longer (approximately 1 mm on average)
tibia length compared to chicks incubated in 24D.
However, as previously reported, stride length did not
differ between 24L and 24D, suggesting the fewer
strides and shorter path were due at least in part to
lateral deviations in stride. The shorter normalized path
and smaller foot placement angles also indicated that
466 Porterfield et al. Developmental Psychobiology
9. chicks incubated in 24L walked with less side to side
drift during forward progression than hatchlings incu-
bated in 24D conditions. Excepting normalized path
length, chicks incubated in 24L also outperformed
chicks incubated in 12L. Chicks incubated in 24L
hatched 1 day sooner than chicks incubated in 12L and
2 days sooner than chicks incubated in 24D, and did
not appear to differ morphologically (Sindhurakar
Bradley, 2010). Thus, our new results also strengthen
the earlier conclusion that 24L conditions accelerated
locomotor development without any apparent cost to
motor skill.
Chicks Incubated in 24D and 12L Conditions
Navigated With Seemingly Similar Efficiency
Potential differences between 12L incubated and 24D
incubated chicks were less clear. Stride count, path
length parameters, and foot placement angles did not
differ significantly between the two groups, and during
session I, all progression parameters appeared to be
similar for the two groups. However, chicks incubated
in 12L exhibited notable improvements between ses-
sions on all parameters, and in one measure, drift bias
variability, the improvement achieved significance. In
contrast, 24D incubated chicks consistently exhibited
the least improvement between sessions (Figures, 4,
and 5 2). Collectively, these trends suggest that modest
light exposure may have offered some small advantage
over that of dark incubation that would be more
apparent in a larger and more comprehensive study of
potential dosage effects. Several studies suggest that
further investigation is warranted. For example, during
normal chick embryogenesis, the right eye at least
intermittently experiences greater light exposure than
the left eye and the exposure contributes to selective
visual pathway development (Rogers, 1982; Rogers
Bolden, 1991). Differential exposure of the two eyes
also strengthens hemispheric specialization for a variety
of postnatal behaviors, such as attack, copulation, foot
preference, and turning bias (Casey Lickliter, 1998;
Rogers, 1982). Conversely, the absence of light expo-
sure, as during 24D conditions, may compromise neural
circuit development, hemispheric specialization and
lateralized control of environmentally and socially cued
behaviors (Casey Lickliter, 1998), which could
contribute to locomotor behavior.
Chicks Acquired Greater Navigational Skill
Over 4 hr of Walk Experience
Collectively, chicks achieved significant improvements
in forward progression from session I to session II, as
noted by decreases in stride count, normalized path
length, foot placement angle and variability, and drift
bias variability. The improvements in locomotor per-
formance are consistent with our previous study of
global gait parameters and suggest the day of hatching
may be a particularly sensitive and therefore useful
window during development for further study of motor
skill acquisition more generally. We found that the
improvements in forward navigation between sessions
were most apparent for chicks incubated in 12L. They
significantly reduced their variability in performance
from session I to II. Further, by session II, hatchlings
incubated in 12L exhibited navigation performance
within the range of hatchlings incubated in 24L, again
raising the possibility that some light exposure during
embryogenesis may impart a motor learning advantage
over that of dark incubation. Chicks incubated in 24L
did not demonstrate substantial improvements between
sessions, but this may be indicative of a ceiling effect
in performance skill. Specifically, their strong perform-
ance in session I relative to the other groups may
indicate they already realized the maximum benefits of
light exposure on locomotor control by the time the
first test trials began, attenuating the benefits of a 4 hr
practice interval. Collectively these trends suggest there
is some benefit of light exposure impacting locomotor
development worthy of further study in a larger
population sample.
Chicks Did Not Exhibit a Drift Bias to Either
Side During Forward Progression
Average drift bias was less than 18 to the left or right
of the forward progression vector for all groups during
both session I and II, and less than 48 individually,
indicating that veering during any stride was adequately
compensated during subsequent strides in a walk trial,
as also observed in Figures 1A and 3A. We anticipated
that the significant delay in onset of hatching under
24D conditions would impose a longer period of
asymmetric posture in ovo during prehatching and
hatching that might enhance any lateralized control of
posture and stepping and produce a drift bias. During
the final 3–4 days, the chick is deeply folded on itself
with the upper spine and head rotated rightward relative
to the lower segments, even as it rotates and extends
the neck to press the egg tooth against the shell.
Conversely, disruptions of the asymmetric hatching
posture have been shown to reduce normal trends in
lateralized behavior after hatching, such as turning bias
and footedness during locomotion in a T-maze (Casey
Martino, 2000). Nonetheless, under our test condi-
tions, chicks did not drift selectively in either direction
during walk trials.
The absence of lateral deviation in path and foot
placement angle in our study should not be inter-
Developmental Psychobiology Drift During Forward Progression in Chicks 467
10. preted as indicating an absence of lateralized behavior
or brain function. Several features of our task may
account for the lack of a lateral bias during walk
trials. Evidence indicates lateral bias in forward
navigation is best observed when subjects are blind-
folded (Bestaven et al., 2012; Boyadjian et al., 1999).
In our task, chicks were not deprived of vision and
they could see low level room light at the end of the
darkened tunnel. Lateral bias in forward progression
is more reliably observed with or without vision if
distances are sufficiently long (Boyadjian et al.,
1999). Our walk trail analysis was limited to a region
of 40 cm in the center of a tunnel 9 cm wide. Thus,
our results suggest that future studies of lateral bias
during locomotion employ a longer, wider apparatus,
and include more restrictive visual conditions. Finally,
our task did not require a choice in direction (turning
left or right), as employed by others (Casey, 2005;
Casey Lickliter, 1998; Casey Martino, 2000;
Casey Sleigh, 2001), leading us to speculate that
bias may not be as readily observed for shorter walk
trials if choice is not a requirement.
In this study we sought to determine if the absence
of light exposure during embryogenesis had a negative
impact on locomotor navigation. We asked if the
greater step width observed during walk trials in an
earlier study was indicative of reduced dynamic
balance skill by examining forward progression in the
same group of animals. All other global temporal and
spatial parameters examined in our earlier study of
overground locomotion suggested locomotor skill did
not vary with light exposure during embryogenesis. In
contrast, findings for this retrospective analysis of
forward progression revealed consistent differences
between chicks incubated in 24L versus 12L or 24D
conditions. Further, the significant differences between
24L and 24D incubated chicks were consistent with
differences in step width between these groups. Thus
we conclude that in contrast to the effects of bright
light exposure during incubation, dark exposure can
negatively impact locomotor navigation at hatching. To
what extent this reduced competency is due to slower
maturation of dynamic balance remains to be more
fully examined. Further, the potential costs and benefits
of light exposure on motor development in precocial,
and possibly nonprecocial animals, are important ques-
tions yet to be fully understood.
NOTES
Anil Sindhurakar is now at Motor Recovery Laboratory,
Burke-Cornell Medical Research Institute. The kinematic
findings for trial data employed in this study are an extension
of a previously published study on locomotor performance
(Sindhurakar and Bradley, 2010). This study was supported by
NIH National Institute of Child Health and Human Develop-
ment grant ROI HD – 053367 (to NSB). Research reported in
this publication was also supported by the Eunice Kennedy
Shriver National Institute Of Child Health Human Devel-
opment of the National Institutes of Health under Award
Number K12 HD – 073945.
REFERENCES
Bauby, C. E., Kuo, A. D. (2000). Active control of lateral
balance in human walking. Journal of Biomechanics, 33,
1433–1440.
Bestaven, E., Guillaud, E., Cazalets, J. R. (2012). Is
“Circling” Behavior in Humans Related to Postural
Asymmetry? PLoS ONE, 7, e43861.
Bohren, B. B., Spiegel, P. B. (1975). Light effects during
incubation on lines of White Leghorns selected for fast
and show hatching. Poultry Science, 54, 1372–1374.
Boyadjian, A., Marin, L., Danion, F. (1999). Veering in
human locomotion: The role of the effectors. Neuroscience
Letters, 265, 21–24.
Bradley, N. S., Jahng, D. Y. (2003). Selective effects of
light exposure on distribution of motility in the chick
embryo at E18. Journal of Neurophysiology, 90, 1408–
1417.
Casey, M. B. (2005). Asymmetrical hatching behaviors: The
development of postnatal motor laterality in three preco-
cial bird species. Developmental Psychobiology, 47,
123–135.
Casey, M. B., Lickliter, R. (1998). Prenatal visual
experience influences the development of turning bias in
bobwhite quail chicks (Colinus virginianus). Developmen-
tal Psychobiology, 32, 327–338.
Casey, M. B., Martino, C. M. (2000). Asymmetrical
hatching behaviors influence the development of postnatal
laterality in domestic chicks (Gallus gallus). Developmen-
tal Psychobiology, 37, 13–24.
Casey, M. B., Sleigh, M. J. (2001). Cross-
species investigations of prenatal experience, hatching
behavior, and postnatal behavioral laterality. Developmen-
tal Psychobiology, 39, 84–91.
Chen, G., Patten, C., Kothari, D. H., Zajac, F. E. (2005).
Gait differences between individuals with post-
stroke hemiparesis and non-disabled controls at matched
speeds. Gait Posture, 22, 51–56.
Coleman, M. A., McDaniel, G. R. (1976). Light alterated
changes in the embryonic age versus incubation age of
White Leghorn embryos. Poultry Science, 55, 2483–2485.
Earhart, G. M., Jones, G. M., Horak, F. B., Block, E. W.,
Weber, K. D., Fletcher, W. A. (2001). Forward versus
backward walking: transfer of podokinetic adaption.
Journal of Neurophysiology, 86, 1666–1670.
Fairchild, B. D., Christensen, V. L. (2000). Photostimula-
tion of turkey eggs accelerates hatching times without
affecting hatchability, liver or heart growth or glycogen
content. Poultry Science, 79, 1627–1631.
468 Porterfield et al. Developmental Psychobiology
11. Fitzpatrick, R. C., Wardman, D. L., Taylor, J. L. (1999).
Effects of galvanic vestibular stimulation during human
walking. Journal of Physiology, 517, 931–939.
Ghatpande, A., Ghatpande, S., Khan, M. Z. (1995). Effect of
different intensities of fluorescent light on the early develop-
ment of chick embryos in ovo. Cellular Molecular Biology
Research, 41, 613–621.
Hall, B. K., Herring, S. W. (1990). Paralysis and growth of
the musculoskeletal system in the embryonic chick. Journal
of Morphology, 206, 45–56.
Kernozek, T. W., Richard, M. D. (1990). Foot placement
angle and arch type: Effect on rearfoot motion. Archives
of Physical Medicine and Rehabilitation, 71, 988–991.
Liu, W. J., Wang, Z. X., Chen, Y. X. (2010). Effects of
monochromatic light on developmental changes in satellite
cell population of pectoral muscle in broilers during early
posthatch period. Anatomical Record, 293, 1315–1324.
McAndrew Young, P. M., Dingwell, J. B. (2012). Voluntarily
changing step length or step width affects dynamic stability
of human walking. Gait Posture, 35, 472–477.
Perry J. (1992). Gait Analysis: Normal and Pathological
Function. New Jersey: Slack Incorporated.
Pijnappels, M., Bobbert, M. F., Van Dieen, J. H. (2001).
Changes in walking pattern caused by the possibility of a
tripping reaction. Gait Posture, 14, 11–18.
Racz K., Sindhurakar A., Bradley N. S., Valero-Cuevas
F. J. (2011). Prenatal motor development affects observed
motor behavior for different incubation periods in domes-
tic chick. In Proceedings of the 35th Annual Meeting of
the American Society of Biomechanics, Long Beach, CA:
American Society of Biomechanics, http://www.asbweb.
org/conferences/2011/pdf/327.pdf.
Richardson, J. K., Thies, S. B., DeMott, T. K., Ashton-
Miller, J. A. (2004). A comparison of gait characteristics
between older women with and without peripheral neuro-
pathy in standard and challenging environments. Journal
of American Geriatrics Society, 52, 1532–1537.
Rogers, L. J. (1982). Light experience and asymmetry of
brain function in chickens. Nature, 297, 223–225.
Rogers, L. J., Bolden, S. W. (1991). Light-dependent
development and asymmetry of visual projections. Neuro-
science Letters, 121, 63–67.
Ryu, Y. U., Bradley, N. S. (2009). Precocious locomotor
behavior begins in the egg: Development of the leg
muscle patterns for sleeping in the chick. PLoS ONE, 4,
e6111.
Sindhurakar, A., Bradley, N. S. (2010). Kinematic analysis
of overground locomotion in chicks incubated under
different light conditions. Developmental Psychobiology,
52, 802–812.
Sindhurakar, A., Bradley, N. S. (2012). Light accelerates
morphogenesis and acquisition of interlimb stepping in
chick embryos. PLoS ONE, 12, e51348.
Stolze, H., Klebe, S., Petersen, G., Raethjen, J., Wenzel-
burger, R., Witt, K., Deuschl, G. (2002). Typical
features of cerebellar ataxic gait. Journal of Neurology,
Neurosurgery, Psychiatry, 73, 310–312.
Wu, K. C., Streicher, J., Lee, M. L., Hall, B. K., Muller,
G. B. (2001). Role of motility in embryonic development
I. Embryo movements and amnion contractions in the
chick and the influence of illumination. Journal of
Experimental Zoology, 291, 186–194.
Zverev, Y. P. (2006). Spatial parameters of walking gait and
footedness. Annals of Humans Biology, 33, 161–176.
Developmental Psychobiology Drift During Forward Progression in Chicks 469