This document summarizes three competing interpretations of declining public confidence in the U.S. government: the symbolic change thesis, regime effects thesis, and devolution thesis. It outlines hypotheses derived from each and discusses how the authors will evaluate these hypotheses by analyzing the relationship between government confidence and policy preferences over time, across policy domains, and with respect to Congress and the presidency using General Social Survey data. The analysis aims to advance understanding of declining confidence and its potential role in contemporary policy conflicts and welfare state retrenchment.
December 26, 2017 "Information Clearing House" - Gallup headlined on December 18th, “Americans View Government as Nation’s Top Problem in 2017”. Their report made clear that though this finding was unprecedented, it’s part of a longer-term trend, toward Americans naming America’s own “government as the most important problem facing the nation.” In a democracy, the public do not view the nation’s government to be (as in America) their enemy (which is the case if they view the “government as the most important problem facing the nation”). Americans increasingly view the Government as their enemy.
Education, Intelligence, and Attitude ExtremityVishwa Jeet
Education and general intelligence both serve to inform opinions, but do they lead to greater attitude extremity? We use questions on economic policy, social issues, and environmental issues from the General Social Survey to test the impact of education and intelligence on attitude extremity, as measured by deviation from centrist or neutral positions. Using quantile regression modeling, we find that intelligence is a moderating force across the entire distribution in economic, social, and environmental policy beliefs. Completing high school strongly correlates to reduced extremity, particularly in the upper quantiles. College education increases attitude extremity in the lower tail of environmental beliefs. The relevance of the low extremity tail (lower quantiles) to potential swing-voters and the high extremity tail (upper quantiles) to a political party’s core are discussed.
Exposure to opposing views on social media can increase political polarizatio...eraser Juan José Calderón
Exposure to opposing views on social media can
increase political polarization. Christopher A. Baila & others.
Christopher A. Baila,1, Lisa P. Argyleb, Taylor W. Browna, John P. Bumpusa, Haohan Chenc, M. B. Fallin Hunzakerd, Jaemin Leea, Marcus Manna, Friedolin Merhouta, and Alexander Volfovskye
Governing a Divided Nation - Insights about the 2016 U.S. Presidential ElectionMSL
Public affairs and policy experts from Qorvis MSLGROUP have compiled an extensive election coverage and analysis of how the new U.S. President and Congress will move forward after one of the most bitter campaigns in American history.
For more updates, follow @qorvis or reach out to us on Twitter @msl_group.
Using individual data on voting and political parties manifestos in European coun- tries, we empirically characterize the drivers of voting for populist parties (the demand side) as well as the presence of populist parties (the supply side). We show that the economic insecurity drivers of the demand of populism are significant, especially when considering the key interactions with turnout incentives, neglected in previous studies. Once turnout effects are taken into account, economic insecurity drives consensus to populist policies directly and through indirect negative effects on trust and attitudes towards immigrants. On the supply side, populist parties are more likely to emerge when countries are faced with a systemic crisis of economic security. The orientation choice of populist parties, i.e., whether they arise on left or right of the political spec- trum, is determined by the availability of political space. The typical mainstream parties response is to reduce the distance of their platform from that of successful populist entrants, amplifying the aggregate supply of populist policies.
Firearm suicide among the elderly poses a serious challenge to public health. One of the greatest barriers to finding a solution to this problem is the highly politicized and bipartisan nature of the gun control debate. This paper studies the underlying risk factors contributing to suicide and existing legislation to develop recommendations for reducing firearm suicide among the elderly. Various databases were searched for evidence of successful interventions including PscyhInfo, PubMed and Scopus. The search criteria were limited to studies published within the U.S. between 2008 and 2018. Based on available evidence, the social ecological model provides the best intervention for reducing firearm suicide and firearm mortality among the target population through small interventions at the intrapersonal, interpersonal, community and societal levels.
Social Policy Responsiveness in Developed DemocraciesAu.docxgertrudebellgrove
Social Policy Responsiveness in Developed Democracies
Author(s): Clem Brooks and Jeff Manza
Source: American Sociological Review, Vol. 71, No. 3 (Jun., 2006), pp. 474-494
Published by: American Sociological Association
Stable URL: https://www.jstor.org/stable/30039000
Accessed: 19-09-2018 01:13 UTC
JSTOR is a not-for-profit service that helps scholars, researchers, and students discover, use, and build upon a wide
range of content in a trusted digital archive. We use information technology and tools to increase productivity and
facilitate new forms of scholarship. For more information about JSTOR, please contact [email protected]
Your use of the JSTOR archive indicates your acceptance of the Terms & Conditions of Use, available at
https://about.jstor.org/terms
American Sociological Association is collaborating with JSTOR to digitize, preserve and
extend access to American Sociological Review
This content downloaded from 128.122.158.14 on Wed, 19 Sep 2018 01:13:30 UTC
All use subject to https://about.jstor.org/terms
Social Policy Responsiveness
in Developed Democracies
Clem Brooks
Indiana University, Bloomington
Jeff Manza
Northwestern University
Do mass policy preferences influence the policy output of welfare states in developed
democracies? This is an important issue for welfare state theory and research, and this
article presents an analysis that builds from analytical innovations developed in the
emerging literature on linkages between mass opinion and public policy. The authors
analyze a new dataset combining a measure of social policy preferences with data on
welfare state spending, alongside controls for established causal factors behind social
policy-making. The analysis provides evidence that policy preferences exert a significant
influence over welfare state output. Guided also by statistical tests for endogeneity, the
authors find that cross-national differences in the level of policy preferences help to
account for a portion of the differences among social, Christian, and liberal welfare state
regimes. The results have implications for developing fruitful connections between
welfare state scholarship, comparative opinion research, and recent opinion/policy
studies.
Do mass policy preferences influence the
size and scope of social policy output in
democracies? Are cross-national differences in
the level of policy preferences a factor behind
comparative differences in developed welfare
states? These questions are fundamental ones for
empirical democratic theory, as the growth of
Direct correspondence to Clem Brooks,
Department of Sociology, Indiana University, 1020
E. Kirkwood Ave., Bloomington, IN 47405-7103
([email protected]). Data were provided by the
Organization for Economic Cooperation and
Development, the Inter-University Consortium for
Political and Social Research, and the Comparative
Welfare States Dataset was provided by Evelyne
Huber, Char ...
Voter Preferences and Political Change: Evidence From the Political Economy o...Marcellus Drilling News
A research report that looks at the effect of shale drilling on political races and finds that in areas with shale drilling, more Republican and conservative candidates win and those people tend to vote more conservative. The research was conducted by researchers at Bocconi University (Italy), University of Pennsylvania, and Boston College.
Oligarchy rules democracy: Testing Theories of American Politics: Elites, Int...Sadanand Patwardhan
Each of four theoretical traditions in the study of American politics – which can be characterized as theories of Majoritarian Electoral Democracy, Economic Elite Domination, and two types of interest group pluralism, Majoritarian Pluralism and Biased Pluralism – offers different predictions about which sets of actors have how much influence over public policy: average citizens; economic elites; and organized interest groups, mass-based or business-oriented. A great deal of empirical research speaks to the policy influence of one or another set of actors, but until recently it has not been possible to test these contrasting theoretical predictions against each other within a single statistical model. This paper reports on an effort to do so, using a unique data set that includes measures of the key variables for 1,779 policy issues. Multivariate analysis indicates that economic elites and organized groups representing business interests have substantial independent impacts on U.S. government policy, while average citizens and mass-based interest groups have little or no independent influence. The results provide substantial support for theories of Economic Elite Domination and for theories of Biased Pluralism, but not for theories of Majoritarian Electoral Democracy or Majoritarian Pluralism. The study is by Martin Gilens, Princeton University and Benjamin I. Page, Northwestern University.
Welfare state retrenchment is widely seen as a highly unpopular endeavor and, therefore, as politically difficult to pursue. This assumption has underpinned most of the political science research on this issue, notably Paul Pierson‘s seminal contributions about the ‗new politics of the welfare state‘. Yet, the question remains why and under what circumstances cutbacks take place in highly developed welfare states despite these formidable political obstacles. This article reviews the literature on the politics of retrenchment, namely on the impact of socioeconomic problem pressure, political parties, political institutions, welfare state structures and ideas. Most authors agree that socio-economic problems – particularly domestic problems – contribute to an atmosphere of ‗permanent austerity‘ which inspires cutbacks. Moreover, according to most scholars, the extent of retrenchment possible depends on the specific institutional configuration of a political system and the path dependence of existing welfare state structures. The debate on the relevance of political parties and ideas, by contrast, is still far from settled. Further unresolved issues include the nature of the dependent variable in retrenchment studies. Also, the exact motives for cutbacks are theoretically still little understood, as are the political mechanisms through which they are realized. I argue that, because of the nature of these persisting issues, the pluralistic dialogue between different methods and approaches – as well as their combination – remains the most promising way forward in the study of welfare state politics.
Report #3 Changing Public Opinion Before beginning this MoseStaton39
Report #3: Changing Public Opinion
Before beginning this assignment, make certain that you have read Chapter 6 in your text (“Public Opinion
and Political Action”), the 2021 Pew Research Center Report titled “Americans See Broad Responsibilities for
Government; Little Change Since 2019” (March 17), and the 2020 article by Eli Finkel et al. from Science titled,
“Political Sectarianism in America” (October, Vol. 370, Issue 6516). Then write a brief report that contains
three separate sections that address all the points in each set of questions. Notice the expected word count
for each section (exceeding the word count will not negatively affect your grade, but please try to stay within
the range).
1. Relying on the Pew Research Center Report, briefly summarize what Americans think about the role
of the federal government in addressing various policy issues (indicate specific areas and indicate
where support is strongest and where it is weakest). Also, describe general levels of trust of and
contentment with the federal government and indicate what changes can be detected over time.
(approximately 150-200 words)
2. How do attitudes about federal government responsibilities differ by age, race, income, and
partisanship (Democrats and Republicans)? Be sure to indicate where the differences are the least and
where they are the greatest on each of these dimensions (age, race, income, and partisanship).
(approximately 150-200 words)
3. Based on your reading of “Political Sectarianism in America,” (a) summarize the article’s major
findings, (b) list and describe the three causes identified for the increase in political sectarianism, and
(c) identify and elaborate on a few of the consequences of this trend. (approximately 150-200 words)
Be careful not to plagiarize. If you want to quote directly, do so using quotation marks (giving the page number
if available). But try to do this sparingly and simply use your own words in addressing the questions.
In your writing, use an analytical tone that is free of your personal opinions. In other words, try to answer the
questions in a straightforward and objective manner.
When you are done, save the document as a Word file or as an Adobe PDF file (it cannot be Google docs, etc.)
and upload it through Moodle (these parts are very important!). Papers not uploaded by the deadline will receive
a grade penalty.
WARNING: This is an individual assignment and you are to do your own work. Use of another person’s
words without proper citation or copying from another student’s paper is considered plagiarism. All papers are
checked and retained in a plagiarism software program to identify cheating. Any suspicion of plagiarism or
other violations of the university’s academic conduct policies are turned over to the Dean of Students.
Links to the articles:
Pew Report: "Americans See Broad Responsibilities for Government"
Science: "Political Sectarianism in America"
...
1) Write a summary of the key points presented by the author;2) TatianaMajor22
1) Write a summary of the key points presented by the author;
2) Express your thoughts on the topic
Summary should be no longer than 3 typewritten, double-spaced pages.
Most social scientists who study public opinion and public policy in democratic countries agree that (1) public opinion influences public policy; (2) the more salient an issue to the public, the stronger the rela- tionship is likely to be; and (3) the relationship is threatened by the power of interest organizations,' political parties, and economic elites (see, e.g., Aldrich 1995; Dahl 1989; Mueller 1999; Stimson, MacKuen, and Erikson 1995; Page and Shapiro 1983; Smith 2000). There would be much less consensus, however, on the answers to five follow-up questions widely seen as impor- tant but seldom addressed directly: 1. How much impact does public opinion have on public policy? 2. How much does the impact of opinion on policy increase as the importance of an issue to the public increases? 3. To what extent do interest groups, social movement organizations, political parties, and elites influence policy even when opposed by public opinion? 4. Has government responsiveness to public opinion changed over time? 5. How generalizable are our findings about the impact of opinion on policy?
This article distills considerable research directed at these questions. It is not, however, a literature review in the usual sense. Rather than summarizing publications in a con- ventional narrative, I use each publication as a source of data, tabulating the issues and countries studied, and the authors' predictions, variables, and findings. The analysis will provide the publications' collective answer to each question, and, at times, show how little evidence is avail- able. Highlighting how little we know on some issues will point to an agenda for future research. It turns out that public opinion influences policy most of the time, often strongly Responsiveness appears to increase with salience, and public opinion matters even in the face of activities by interest organizations, political par- ties, and political and economic elites. Claims that respon- siveness is changing over time or varies across issues rest on very little evidence. The next section describes issues that arise in attempts to answer the questions. This is followed by a description of the data, presentation of findings, and conclusion.
ISSUES AND CONTROVERSIES The Impact of Public Opinion on Public Policy No one believes that public opinion always determines public policy; few believe it never does. Even dedicated pro- ponents of democratic theory acknowledge that democratic governments sometimes ignore the public (e.g., Page and Shapiro 1983: 189); those whose theories attribute little power to the public concede that governments sometimes follow public opinion (e.g., Block 1987: 66; Domhoff 1998: 301; Korpi 1989: 313). What distinguishes those who believe democracy gives citizens genuine control over their governmen ...
Bennett’s hypothesis contradicts the popular image of the media as a watchdog; it constantly looks over the shoulders of the ones in power. However, Robinson’s model uses the indexing theory as a foundation but still opens up for instances when the media may assert influence on a policy decision (lapdog).
Social Work, Politics, and Social Policy Education ApplyingAlleneMcclendon878
Social Work, Politics, and Social Policy Education: Applying
a Multidimensional Framework of Power
Amy Krings , Vincent Fusaro , Kerri Leyda Nicoll, and Na Youn Lee
ABSTRACT
The call to promote social justice sets the social work profession in
a political context. In an effort to enhance social workers’ preparedness to
engage in political advocacy, this article calls on educators to integrate
a broad theoretical understanding of power into social policy curricula. We
suggest the use of a multidimensional conceptualization of power that
emphasizes mechanisms of decision making, agenda control, and attitude
formation. We then apply these mechanisms to demonstrate how two
prominent features of contemporary politics—party polarization and
racially biased attitudes—affect the ability of social workers to influence
policy. Finally, we suggest content that social work educators can integrate
to prepare future social workers to engage in strategic and effective social
justice advocacy.
ARTICLE HISTORY
Accepted: January 2018
As part of their broader mandate, codified in the National Association of Social Workers (2017)
Code of Ethics, social workers are called to advance social and economic justice by participating in
political action with, or on behalf of, disadvantaged groups. The goals of such action are broad
democratic participation, a fair distribution of power and resources, and an equitable distribution of
opportunities (Reisch & Garvin, 2016). To achieve these goals, social workers must go beyond an
analysis of how existing policies reinforce or reduce social problems to recognize and strategically
engage with the power embedded in political processes themselves. This power not only influences
how problems are addressed or ignored but also how they are constructed and understood. Thus, to
be effective practitioners and change agents, it is necessary for social workers to “see power as central
to understanding and addressing social problems and human needs” (Fisher, 1995, p. 196).
At its inception, the social work profession emerged as a leader in shaping policies and programs
that improved the health and well-being of disadvantaged people and families. Social workers played
key roles in policy areas such as aid to families, Social Security, the juvenile court system, minimum
wage, and unemployment insurance (Axinn & Stern, 2012). Over time, external pressures, including
austerity-driven policies that emphasize market-based approaches to social service delivery and the
reduction of the social safety net, have limited the range of microlevel interventions and margin-
alized mezzo- and macrolevel community and policy practice (Abramovitz & Sherraden, 2016;
Reisch, 2000). Consequently, many social work educators have expressed concern that the profession
has become increasingly depoliticized and decontextualized by focusing disproportionately on
individual interventions at the expense of systematic interventions that could help individuals an ...
Running Head POLITICS AND HEALTH CASE SYSTEMS IN USPOLITICS A.docxcharisellington63520
Running Head: POLITICS AND HEALTH CASE SYSTEMS IN US
POLITICS AND HEALTH CARE SYSTEM IN US. 12
Politics and Healthcare System in US
Student’s Name
Institution
Date
Abstract
It should be noted that the U.S health care delivery system is constantly undergoing transformation through new legislation or improvement and amendments of the existing legislations. Some of the most common areas that are often improved concern the financing sector, insurance sector, delivery sector and quality sector. New laws are often introduced in these sectors with the purpose of ensuring that the resultant health care is of high quality and that it is cheaper and accessible to many. Affordability is another crucial component of health care delivery system. The four basic functional components of the U.S. health care delivery system include financing, insurance, delivery and quality would be discussed.
The paper will explore and analyze the association between the politics and the health care reforms in the United States. The analysis will try to find out the role of politics in the key healthcare reforms such as Medicare, Medicaid, Managed care and even the most current act called Affordable Care Act. The paper will demonstrate that politicians have been using gaps in the healthcare system to campaign for their consideration for being elected as Congress or senetors. It will also demonstrate that some politicians such as Clinton plan to initiate reforms to suit their political interest. The paper will conclude by indicating how the politics and politicians manipulate the health care reform as their campaign strategies of winning voters.
Politics and healthcare system in USA
A closer look at the health care reform in United States reveals that any reform is politically orchestrated. In fact it is as if one of the campaign strategies of most of the politicians is to come up with a reform that can improve cost of care, quality of care and access to care. A closer look at the history of the United States reveals that politics started intervening in health care between 1930s and 1960s (Patel & Rushefsky, 1999). During this time, there was depression, unemployment insurance and hence the government was in pressure to provide cheaper if not free medical care or reimbursement for its cost (Patel & Rushefsky, 1999).
In 1935, the Social Security Act of 1935 was formed to provide for unemployment compensation, old-age pensions and other benefits (Patel & Rushefsky, 1999). It should be noted that the political party in leadership had to be careful on how it handles the issue of health care lest it lose the confidence in people. Before the idea of insurance was introduced, the American Medical Association was strongly opposing it. On the other hand, the politicians and the ruling political government had to force it happen because that was the only option in which politicians could help its citizens and p.
Mass Media and the Depoliticization of Personal Experience.docxaryan532920
Mass Media and the Depoliticization of Personal Experience
Author(s): Diana C. Mutz
Source: American Journal of Political Science, Vol. 36, No. 2 (May, 1992), pp. 483-508
Published by: Midwest Political Science Association
Stable URL: http://www.jstor.org/stable/2111487
Accessed: 22-11-2016 19:15 UTC
JSTOR is a not-for-profit service that helps scholars, researchers, and students discover, use, and build upon a wide range of content in a trusted
digital archive. We use information technology and tools to increase productivity and facilitate new forms of scholarship. For more information about
JSTOR, please contact [email protected]
Your use of the JSTOR archive indicates your acceptance of the Terms & Conditions of Use, available at
http://about.jstor.org/terms
Wiley, Midwest Political Science Association are collaborating with JSTOR to digitize, preserve and
extend access to American Journal of Political Science
This content downloaded from 129.219.247.33 on Tue, 22 Nov 2016 19:15:23 UTC
All use subject to http://about.jstor.org/terms
Mass Media and the Depoliticization of Personal
Experience*
Diana C. Mutz, Department of Political Science and School of Journalism and
Mass Communication, University of Wisconsin-Madison
This study combines contemporary research on the effects of mass communication with findings
on sociotropic voting to build a general model that explains the origins and effects of economic per-
ceptions. This model is then tested in the context of retrospective personal and social concerns about
unemployment.
Survey evidence suggests that retrospective assessments of unemployment result primarily from
mediated information rather than from direct experiences. Mass media are found to have an "imper-
sonal impact," influencing social, but not personal perceptions of the issue, while personal experi-
ences with unemployment influence exclusively personal-level judgments.
Mass media also influence the weighting of pocketbook as opposed to sociotropic concerns by
means of a "sociotropic priming effect." Rather than priming all considerations that surround eco-
nomic issues, high levels of media exposure to economic news prime the importance of collective
perceptions to political evaluations and decrease the importance of personal concerns.
Early studies of economic influences on voting simply assumed that people
voted their pocketbooks: when national economic conditions worsened, more
citizens experienced economic problems in their own lives, and these people
logically voted against the incumbent party. When empirical findings at the indi-
vidual level failed to support this explanation, research shifted from a focus on
personal economic experiences to an emphasis on "sociotropic" judgments; that
is, individuals' retrospective assessments of economic change at the collective
level (see, e.g., Kinder and Kiewiet 1979, 1981; Schlozman and Verba 1979;
Kinder 1981; Kiewiet 1983).
Perceptions ...
2. 1344 / Social Forces 79:4, June 2001
government confidence is distinguished not only by its magnitude but also by its
temporal duration. Whereas over 70% of Americans in 1960 indicated that they
trusted government "almost always" or "most of the time," this proportion dipped
below 40% in 1974, recovering slightly in the mid-1980s only to reach new lows
in the 1990s (Erikson & Tedin 1995; Orren 1997). The cumulative decrease in
public confidence in government has figured in two generations of scholarly debate
concerning the proper interpretation of these trends.
The central issue in first-generation debates concerned the possibility that low
levels of government confidence signaled the declining legitimacy of U.S. politicai
institutions. Miller (1974a: 951; 1974b), for instance, construed low confidence
levels as indicative of growing and ideologically based public dissatisfaction with
the overall direction of national policy-making, warning that "a democratic political
systern cannot survive for long without the support of a majority of its citizens:'
Citrin (1974), by contrast, hypothesized that declining confidence was limited to
negative feelings about political incumbents and their policies. Given that such
attitudes could readily be reversed (e.g., if popular leaders were elected to office),
Citrin's interpretation cast doubt on the proposition that dedining government
confidence could threaten the legitimacy of political institutions. Extending this
line of reasoning, Lipset and Schneider (1983) raised even more fundamental
questions about the significance of declining confidence, arguing that distrust of
national institutions is a central feature of U.S. political culture and that citizens'
underlying commitment to democratic institutions remained high during this time.
While a rebound in public confidence during the early 1980s momentarily
quelled debates, an even steeper decline since 1984 has renewed scholarly interest
in these opinion trends (see Braithwaite & Levi 1998; Hetherington 1998;
Hibbing & Theiss-Morse 1995; Miller & Borrelli 1991; Miller & Listhaug 1990;
Nye 1997). While building from previous work, an emnerging focus within
contemporary debates is on questions about public satisfaction with the direction
of federal policy-making (Barnes 1995). As developed in the work of Jennings
(1998), the devolution thesis views declining public confidence as linked to a general
dissatisfaction with the role of the federal government in favor of state or local
responsibility for public policy. Although the evidence for the devolution thesis is
at best controversial (Smith 1995), assumptions of a relationship between
government confidence and devolution have become a popular device with which
a number of commentators have explained political change and policy conflicts
in the 1990s (see Greenberg 1995; Morris 1998; Skocpol 1996).
We believe that the devolution thesis provides an important opportunity for
advancing theory and research on confidence in government. Coupled with the
absence of the type of widespread unrest or rebellion envisioned by analysts in the
early 1970s, Lipset and Schneider's (1983, 1987) evidence for strong public beliefs
in democratic institutions has largely resolved earlier debates over the possible
relationship between legitimacy and government confidence. However, the
3. Dedining Government Confidence in the U.S. / 1345
devolution thesis raises a different but no less important scenario, namely, that
government confidence is associated with individuals' preferences for (or against)
government involvement in policy domains such as the provision of health care.
In doing so, the devolution thesis raises a question that cannot be answered by
Lipset and Schneider's critique or by other existing research: What is the relationship
between individuals' level of confidence in government and their preferences with
respect to the level of involvement by the federal government in policy-making
activities?
WVe identify two ways in which an analysis of the relationship between policy
preferences and level of confidence in government can enhance our understanding
of declining government confidence. First, preferences for government
involvement in specific policy domains such as health care, education, or national
defense represent a theoretically meaningful variable against which to gauge the
significance of declining confidence. If individuals' willingness to support federal
involvement or specific programs is linked to their level of confidence in
government, then declining government confidence is clearly an important
phenomenon. Conversely, if lower levels of confidence have had little impact on
what Americans prefer and expect from the federal government, then its significance
would be called into question,
Second, an analysis of policy preferences is informative in that the latter
represent a causal process through which growing distrust' in government may
affect the behavior of politicians or the activities of government agencies. Indeed,
a growing body of research (Erikson, Wright & McIver 1989; Hill & Hinton-
Andersson 1995: Stimson, Mackuen & Erikson 1995; see Burstein 1998 for review)
has provided evidence that over time shifts in policy preferences contribute to
subsequent changes in the direction of government policy. 2 However, confidence
in government has not been induded as a variable in this research, thereby leaving
open questions about its possible role. If it has contributed to a decrease in the
public's willingness to endorse government responsibility for policy challenges such
as health care or welfare, the decline of confidence in government has direct
implications for understanding contemporary policy conflicts as vell as the balance
of federal- versus state-level or local authority. Such questions about the role of
public opinion are particularly relevant to emerging research on the causal sources
of welfare state retrenchment in the 1990s (Cook & Barret 1992; Pierson 1994,
1996; Shapiro & Young 1989; Skocpol 1996; Zylan & Soule 2000).
In this study, we develop a comprehensive analysis of the relationship between
confidence in government and policy preferences. Our analyses consider three
critical dimensions that have not been satisfactorily addressed in previous research:
over time; across heterogeneous policy domains; and with reference to the two major
branches of government that have experienced dedining confidence (Congress and
the presidency). We begin by summarizing the three main theoretical
interpretations of confidence in government. We identify competing hypotheses
4. 1346 / Social Forces 79:4, June 2001
implied by these interpretations, considering their relevance to understanding the
interrelationship of governmental confidence and policy preferences during the
past three decades. After describing our research design, data, and measures, we
present the results of the analyses. Finally, we discuss their relevance for
understanding competing interpretations of declining confidence and its possible
role in explaining contemporary patterns of welfare state retrenchment.
Competing Interpretations of Public Confidence in Government
SYMBOLIC CHANGE?
The first interpretation of government confidence we consider can be termed the
symbolic change thesis. In their seminal study The Confidence Gap (1983, 1987),
Lipset and Schneider found evidence of strong public beliefs in the underlying
legitimacy of U.S. political institutions. Countering claims of a legitimation crisis,
Lipset and Schneider hypotlhesized that low levels of government confidence w% ere
limited to political leaders (as well as to leaders of other major institutions) and
involved a growing belief that politicians are motivated primarily by self-interest.
When coupled with the assumption that this belief is a product of changing styles
of media coverage (Lipset & Schneider 1983; see also Lipset 1996), Lipset and
Schneider's results led them to view the decline in government confidence as an
increasingly prominent symbol of the post-1960s U.S., but one with few
implications for Anmericans' expectations or for the overall stability of political
institutions.
Although Lipset and Schneider do not explicitly discuss policy preferences, their
symbolic change thesis suggests little interrelationship with government confidence.
Indeed, without this implication, declining confidence would signal fundamental
changes in Americans' expectations regarding the role of the federal government
(and dissatisfaction with existing institutions). We thus derive the following two
hypotheses from the symbolic change thesis: (1) individuals' preferences for
governmient involvement within specific policy domains tend to vary independently
of their level of confidence in government; and (2) the relationship between these
two variables involves no time trends (e.g., as would be exemplified by a growing
association). Evidence of either a consistently large or a growfing association between
government confidence and policy preferences would thus call the symbolic change
thesis into question.
REGIME EFFECTS?
Whereas the symbolic change thesis implies that declining confidence has little
impact on what individuals expect from government, a different interpretation,
developed by Citrin (1974), anticipates the possibility of a relationship. More
5. Declining Government Confidence in the U.S. / 1347
specifically, Citrin assumed that declining confidence in the 1970s involved
dissatisfaction with both elected political officials and their policies. This
assumption implies the possibility of a relationship between government confidence
and policy preferences, but one that is conditional on the activities of specific
presidents or congressional leaders. Government confidence is thus assumed to
be a dimension of presidential or congressional popularity.
WAAe to this interpretation as the regime effects thesis to capture its claim
refer
that the relationship between public confidence and policy preferences depends
upon the specific time period covered by a presidential administration or Congress.
Given that specific presidential administrations or sessions of Congress may elicit
particularly low levels of public confidence, an oscillation between popular and
unpopular regimes may result in time-specific patterns of association between
government confidence and policy preferences. Popular political leaders may
facilitate, while unpopular leaders may lower, public support for government
involvement in specific policy domains. Changes in the magnitude (or sign) of
the government confidence/policy preferences relationship that correspond to
changes in party control of the presidency or Congress are thus consistent with the
regime effects thesis. It is possible, for instance, that a relationship between
presidential confidence and policy preferences grew during the later years of
Democratic president Jimmy Carter's administration, while subsequently declining
during the first term of Republican president Ronald Reagan. In summary, if we
observe a substantial relationship between government confidence and policy
preferences at some (but not other) points in time, this would provide evidence
favoring the regime effects over the symbolic change thesis.
A SOURCE OF DEVOLUTION?
The devolution scenario is readily distinguished from the expectations of the
symbolic change and regime effects theses. First, as developed in the work of
Jennings (1998), the devolution thesis implies that the relationship between
government confidence and policy preferences is large. Second, although the
literature on devolution is equivocal on whether this relationship is stable over
time or instead involves a trend toward increased association, evidence for either
scenario provides a sufficient basis for distinguishing the devolution thesis from
the other two interpretations. The devolution thesis is unique in advancing claims
about a consistently large association between confidence in government and policy
preferences. Observations of a large or monotonically increasing association during
the 1.990s would thus favor the devolution thesis over the other two theses.
To date, the evidence for the devolution thesis is inconclusive. Some analysts
have cited declining government confidence as contributing to welfare state
retrenchment or the failure of reforms that sought to expand federal responsibility
for social provision (Morris 1998; Skocpol 1996), but they offer no evidence for
such cLaims. Inglehart (1997) hypothesizes a relationship between low government
6. 1348 / Social Forces 79:4, June 2001
confidence and dissatisfaction with the scope of government, but he does not offer
any supporting analyses. A recent study by Jennings (1998) reports that declining
government trust is associated with a general preference for state or local
responsibility for policy-making, but the data he analyzes are drawn from surveys
of a very specific time period (1968-80), raising questions about the generalizability
of his findings. Moreover, to fully meet the critique developed by Lipset and
Schneider (1983), proponents of the devolution thesis must also provide evidence
that a general willingness to favor state or local over federal government authority
is not itself purely symbolic - with the latter being unrelated to policy preferences
within specific domains. Ihese considerations require an analysis of policy
preferences across a suitable range of domains and spanning a longer time period.
CAUSAL INTERPRETATION
Evaluating the causal interrelationship of subjective phenomena such as confidence
in government and policy preferences is oftentimes difficult in the absence of
experimental data, and past research has alternated between treating government
confidence as a cause and treating it as an effect of other attitudes (Hetherington
1998). Our working assumption, informed by the logic of the devolution thesis, is
that confidence in government is a cause of policy preferences. When interpreting
our regression results, we thus refer to the "effects" of government confidence on
policy preferences.
However, it is important to emphasize that such issues of causal interpretation
are generally of consequence for statistical inference only if the association of two
variables is large or involves a time trend. As will become clearer in the presentation
of our results, the association of government confidence and policy preferences is
generally stmall and shows no evidence of trends. As a restult, the inconclusive causal
status of confidence in government in relation to policy preferences does not affect
our evaluation of hypotheses.
Research Design, Data, and Measures
RESEARCH DESIGN
We analyze the relationship between confidence in government and policy
preferences along three dimensions: over time; across policy domains; and with
reference to the distinct political institutions of Congress and the presidency. Each
dimension has substantive relevance to theoretical debates over government
confidence, but none has been satisfactorily analyzed in past research. No previous
study has analyzed the interrelationship of congressional versus presidential
confidence and policy preferences, and studies that directly measure government
confidence and policy preferences have considered a small number of policy
domains while relying on data that is limited to the 1970s (Jennings 1998; Miller
1974a). We develop an explicitly multivariate analysis that controls for such
7. Declining Government Confidence in the U.S. f 1349
potentially compounding factors as ideological identification, enabling informative
estimates of the total versus direct effects of government confidence. The inclusion
of these controls also reduces the chance of detecting spurious relationships
involving government confidence.
With regard to the dimension of time, the symbolic change thesis implies little
change in what is expected to be a small relationship between government
confidence and policy preferences. By contrast, the regime effects thesis anticipates
the possibility of time-specific patterns of association stemming from the effects
of different Congresses or presidential administrations. For its part, the devolution
thesis implies the existence of a large association between level of government
confidence and policy preferences, while also anticipating the possibility of a trend
toward growing association.
Our second dimension of comparison is across heterogeneouspolicy domains.
This dimension is essential to testing hypotheses about the relationship between
confidence in government and preferences for government involvement with
respect to the large number of policy domains (e.g., public health, environmental
protection, labor relations, national defense, and civil rights) in which modern
governments are involved. Past studies of policy preferences have established that
preferences for government involvement vary widely across domains (e.g.,
Feldman & Zaller 1992; Page & Shapiro 1992), and our analyses take this
heterogeneity into account by considering the broadest possible range of policy
domains.
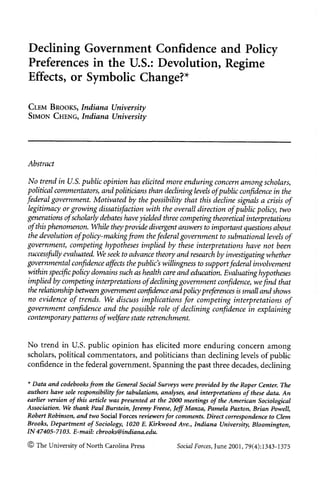
Our third dimension of comparison relates to the institutional targetof public
confidence. We illustrate the importance of distinguishing among political
institutions using the data summarized in Figure 1. These data are from the General
Social Surveys (GSSs) (Davis & Smith 1997), and they document changing levels
of public support for Supreme Court justices, congressional leaders, and presidents.
Notwithstanding small differences between the patterns of declining confidence
for congressional leaders versus presidents, the larger contrast is with members of
the Supreme Court. Supreme Court justices have enjoyed very high levels of public
confidence, and the GSS data provide no evidence of a declining trend. Given this
result and the focus of past debates, we restrict our analysis to confidence in leaders
of the other two branches of the federal government.
DAIA
In this study, we analyze data from the General Social Surveys from 1974 through
1996 (Davis & Smith 1997). These surveys provide the best data with which to
systematically test hypotheses about declining government confidence, 3 satisfying
four critical requirements.
A first requirement is coverage of the relatively long time period (the 1970s
through the 1990s) during which both waves of declining government confidence
8. 1350 / Social Forces 79:4, June 2001
FIGURE 1: Changes in Levels of Confidence in Supreme Court
Justices, Presidents, and Congressional Leaders
3.0 7----------------------------------------------- I -----
u
E
2.5-
4 2.0-
1.5
0
1.0
74 76 78 80 82 84 86 88 90 92 94 96
Source: Data are from the General Social Surveys, 1973-96.
9. Declining Government Confidence in the U.S. / 1351
occurred. The GSS data enable us to examine the relationship between declining
confidence and policy preferences over a period as long as 22 years, lending far
greater generalizability than past studies whose data cover only the first wave of
dedine (see Jennings 1998; Miller 1974a). This lengthy time period is useful in
distinguishing short-term fluctuations from trends, and while random
measurement error can attenuate estimates of association between survey items,
such errors nave no impact on trend estimates unless the former are also associated
with time. Our analysis of the years 1974 through 1996 spans seven separate
presidential administrations and eleven separate sessions of Congress; during this
time party control of the presidency changed three times and control of the House
of Representatives once, enabling a fruitful test of the regime effects thesis. 4
The remaining three requirements relate to the availability of suitable items
with which to measure government confidence, policy preferences, and relevant
statistical controls. We take advantage of the existence of items that employ identical
question wording and response categories across different surveys. Specific features
of these measures are discussed below.
MEASURES OF PUBLIC CONFIDENCE IN GOVERNMENT
We measure individuals' level of confidence in government using two GSS items
that ask respondents to assess their degree of confidence in congressional leaders
and the president. These items have been used in past studies to identify declining
trends in government confidence (see Lipset & Schneider 1983; Smith & Taylor
1979). As summarized in Table 1, the items ask respondents whether they have "a
great deal of confidence" (1), "only some confidence" (2), or "hardly any
confidence" (3) in the president and congressional leaders. In the analyses below,
we treat these two items as continuous variables.5
The GSS confidence items have two features that make them especially useful
for hypothesis testing. First, in contrast to the more commonly analyzed National
Election Survey item, the GSS items distinguish among the institutional targets of
public confidence in government. This is appropriate in light of the possibility that
the political salience of confidence in government - and thus the association
between confidence and policy preferences - may vary across branches of the
federal government. 6 The GSS items are also useful in that they refer to individuals'
level of confidence in the leaders of executive and legislative branches of
government (rather than to the institutions). This enables us to incorporate Citrin's
(1974) and Lipset and Schneider's (1983) claims that declining government
confidence relates primarily to national political leaders.
10. 1352 f Social Forces 79:4, June 2001
TABLE 1: Description of Variables Used in the Analysis
Variables (Coding) Question Wording
PrimaryItidependent Variables I am going to name some institutions in this
country. As far as the people runniing these
institutions are concerned, would you say
you have a great deal of confidence, only some
confidence, or hardly any confidence at all in
them?
Confidence in president (continuous: Executive branch of the federal government?
1 = "a great deal"; 2 = "only some";
3= "hardly any")
Confidence in congressional leaders Congress?
(continuous: 1 = "a great deal";
2 = "only some"; 3 = "hardly any")
PrimaryControl Variable
Ideological identification (continuous: We hear a lot of talk these days about liberals and
I = extremely liberal; 7 = extremely conservatives. I'm going to show you a 7-point
conservative) scale on which the political views that people
might hold are arranged from extremely liberal-
point 1-to extremely conservative-point 7.
Where would you place yourself on this scale?
Other Control Variables
Age (continuous: years)
Education (continuous: years)
Gender (dichotomous: male = 0;
female = I)
Race (dichotomous: other = 0;
African American = 1)
Region (categorical: 0 =West; three
dummyvariables for Northeast,
South, and Midwest)
Dependent Variables 1-3: Government
Assistance Items
Assistance to the poor (continuous: Some people think that the government in
1 = strongly agree that government Washington should do everything possible to
should improve living standards; improve the standard ofliving ofall poor
5 = strongly agree that people should Americans; they are at Point 1 on this card.
take care ofthemselves) Other people think it is not the government's
responsibility, and that each person should take
care of himself; they are at Point 5. Where would
you place yourself on this scale, or haven't you
made up your mind on this?
11. Declining Government Confidence in the U.S. / 1353
TABLE 1: Description of Variables Used in the Analysis (Continued)
Variables (Coding) Question Wording
Dependent Vfariables 1-3: Government
Ascsistance Items (Continued)
Assistance to blacks (continuous: Some people think that (Blacks/Negroes/African-
I = strongly agree that government is Americans) have been discriminated against for
obligated to help blacks; 5 = strongly so long that the government has a special
agree that government shouldn't give obligation to help improve their living standards.
special treatment) Others believe that the govermnent should not be
giving special treatment to (Blacks/Negroes/
African-Americans). Where would you place
yourself on this scale, or have you made up your
mind on this?
Medical assistance (continuous: In genera], some people think that it is the
1 = strongly agree that it is the responsibility of the government in Washington
responsibility of government to to see to it that people have help in paying for
help; 5 = strongly agree that people doctors and hospital bills. Others think that these
should take care of themselves) things are not the responsibility of the federal
government and that people should take care of
these things themselves. Where would you place
yourself on this scale, or haven't you made up
your mind on this?
Dependent Variables 4-18: Government [Filterforall spending itemsl: We are faced with
SpendingItems (all spending items are many problems in this country, none of which
continuous: 1 = too little; 2 = about can be sold easily or inexpensively. I'm going to
right; 3 = too much) name some of these problems, and for each one
I'd like you to tell me whether you think we're
spending too much money on it, too little money,
or about the right amount.
Health care Improving and protecting that nation's health.
Welfare Welfare.
Social security Social security.
Education Improving the nation's education system.
Blacks Improving the conditions of Blacks.
Cities Solving the problems of the big cities.
Environment Improving and protecting the environment.
Crime Halting the rising crime rate.
Drugs Dealing with drug addiction.
Mass transportation Mass transportation.
Highways and bridges Highways and bridges.
Parks Parks and recreation.
Foreign aid Foreign aid.
(Continued on next page)
12. 1354 / Social Forces 79:4, June 2001
TABLE 1: Description of Variables Used in the Analysis (Continued)
Variables (Coding) Question Wording
Dependent Variables 4-.18: Government
SpendingItems (Continued)
National defense The military, armaments and defense.
Federal taxes (continuous: I = too low; Do you consider the amount of federal income
tax
2 = about right; 3 = too high) which you have to pay ask too high, about right,
or too low?
Dependent Variables 19-27: Governiment [Filterfor all responisibilityitems]: On the whole,
ResponsibilityItems (all responsibility do you think it should or should not be the
items are continuous: 1 = definitely government's responsibility to . . .
should be; 2 = probably should be;
3 = can't choose; 4 = probably should
not be; 5 = definitely should not be)
Provide jobs Provide a job for everyone who wants one?
Social security Provide a decent standard of living for the old?
Health care Provide health care for the sick?
Unemployment assistance Provide a decent standard of living for the
unemployed?
Provide housing Provide decent housing for those who can't
afford it?
Educational opportunity Give financial assistance to college students from
low-income families?
Reduce income inequality Reduce income differences between the rich and
poor?
Industrial assistance Provide industry with the help it needs to grow?
Control inflation Keep prices under control?
MEASURES OF POLICY PREFERENCES
Our dependent variables measure policy preferences across a large number of
domains, ranging from health and federal income taxes to preferred levels of public
spending on national defense and the environment. In all, we analyze a total of 27
7
separate policy preference items from the GSS. Nine of these items have been
used as components of the measure of policy preferences (Stimson 1989) found
to predict changes in public policy (Stimson, Mackuen & Erikson 1995). This
overlap is useful in establishing the validity and reliability of the GSS policy
preference items.
The first three dependent variables concern the public's level of support for
government assistance programs (see Table 1 for question wording). The three
Likert-type items in this category refer to assistance to the poor, to African
Americans, and to individuals with health care costs. The response categories for
these items range from I ("strongly agree") to 5 ("strongly disagree"). These items
13. Declining Government Confidence in the U.S. I 1355
are available for twelve years of the GSS, covering the long time period from 1975
through 1996.8
The second block of dependent variables concems respondents' preferred level
of government spending. For these 15 items, respondents were asked whether the
current level of spending for a given policy domain is "too little" (l), "about
right" (2), or "too much" (3).9 A positive association between these responses and
confidence in government indicates that low confidence is related to an
unwillingness to endorse federal government activity or involvement. The
government spending items have been fielded in most years of the General Social
Survey since 1974, again enabling tests of hypotheses regarding time trends.' 0
Our final block of dependent variables are nine GSS items that ask respondents
their preferences regarding government's level of responsibility for specific policy
domains. For these five-category Likert-type items, "1" indicates the strongest level
of support for federal governmental responsibility and "5" indicates the strongest
level of opposition. The government responsibility items are available in fewer
General Social Surveys, but they span the most recent period during which control
of both the presidency and the House of Representatives changed." Their
overlapping reference to three policy domains covered by other GSS items (social
security, health care, and education) is also useful in gauging whether differences
in question wordings or the framing of government involvement yield different
estimates of association with respondents' level of confidence in government.
CONTROLS FOR SOCIODEMOGRAPHIc FACTORS AND IDEOLOGICAL IDENTIFICATION
We incorporate two types of control variables, one related to sociodemographic
factors and the other to ideological identification. The inclusion of the
sociodemographic variables ensures that any association between government
confidence and policy preferences is not spurious (i.e., solely a product of social
group-based differences in government confidence and policy preferences).
Potentially the most important of these factors is race. In keeping with research
documenting African Americans' comparatively high levels of support for many
federal programs (Howell & Fagan 1988; Tate 1993), we analyze race as a
dichotomous variable coded " 1" for African American and "O"otherwise. 12
The remaining sociodemographic controls measure other well-known sources
of policy attitudes (see Brint & Kelley 1993; Erikson & Tedin 1995; Page & Shapiro
1992). Age and education are both analyzed as continuous variables (measured in
years). Gender is a dichotomy coded "1" for women and "O"for men. We analyze
region as three dummy variables for Northeast, South, and Midwest, with West as
the reference category.
The ideological control variable in the analysis measures individuals'
identification using a seven-point scale whose categories range from "extremely
liberal" (1) to "extremely conservative" (7). In similar fashion to the
14. 1356 / Social Forces 79:4, June 2001
sociodemographic variables, ideological identification may also produce spurious
associations between government confidence and policy preferences,13 possibly
because ideological identification can be a cognitive heuristic that individuals
utilize to evaluate politicians or public policies (Fuchs & Kiingemann 1990;
Sniderman, Brody & Tetlock 199 1). As discussed in the results section, including
ideological identification in the models also provides a useful baseline against
which to gauge the magnitude of the corresponding effects of presidential and
congressional confidence.
STATISTICAL MODEIS AND STANDARDIZED COEFFICIENTS
We use OLS models for our analyses. As a check on the OLS assumption of interval-
level measurement in the dependent variable, we also conducted the analyses using
an ordered logit specification. Because these analyses yielded congruent results,
we present the simpler OLS estimates.
Our analyses are conducted in three stages. In the first stage we estimate models
with covariates for the two government confidence items and the sociodemographic
control variables. In the second stage, we estimate models with covariates for the
ideological identification item and the sociodemographic control variables. Because
the government confidence and ideological identification items are not estimated
in the same model, the first two stages of the analysis yield estimates of the total
respective effects of government confidence and ideological identification.
The third stage of the analysis yields estimates of the directeffects of government
confidence and ideological identification by including both sets of covariates in
the same model. This design enables us to compare the total versus direct effects
of government confidence and ideological identification, thereby providing
information about their interrelationships. For instance, if the total effects of
government confidence shrink when ideological identification is estimated in the
same model, this indicates that the direct effects of government confidence are
smaller than their total effects (possibly because ideological identification mediates
the effects of government confidence). However, if the total and direct effects are
similar, this shows that government confidence and ideological identification are
independent sources of policy preferences.
The dimension of time is central to our hypothesis testing, and we analyze each
policy preference item for every year that it was fielded in the GSS, yielding over
750 separate statistical models. To facilitate the interpretation of results, we present
standardized coefficients using a series of graphical displays. The standardized
coefficients are useful in controlling for the varying marginal distributions of
independent and dependent variables (across policy domains and also over time).
Whereas unstandardized coefficients can frustrate comparisons across items with
different distributions and ranges, the fully standardized coefficients take such
variation directly into account using a common metric. This standardization thus
enables direct comparisons along our three cross-cutting dimensions of variation:
15. Declining Government Confidence in the U.S. / 1357
across independent variables, between policy domains, and over time. Additional
details are discussed below.
Results
The results of our analyses are very consistent with respect to the dimensions of
time, policy domain, and institutional target of public confidence. Using the results
summarized in Figure 2, we examine the first three dependent variables measuring
government assistance to the poor, to blacks, and to individcuals with medical costs.
In the first column of Figure 2, we present estimates for the total effects of
presidential confidence, congressional confidence, and ideological identification;
estimates for their direct effects (derived fiom models including all independent
variables) are presented in the second column. Solid circles represent estimated
coefficients.
By gauging its distance fronm the light, dashed line designating an estimate of 0,
we can observe the magnitude of a specific coefficient at a particular point in time.
Taking as an example the total effect of congressional confidence on government
assistance to the poor, the .05 standardized coefficient for 1975 indicates that a
standard deviation decrease in confidence is predicted to lower support for
government assistance by .05 standard deviations. Comparing this estimate with
the direct effects estimate in the second column reveals a nearly identical value of
.04, indicating that the very small relationship between congressional confidence
and government assistance to the poor in 1975 was largely unrelated to the
corresponding effects of presidential confidence and ideological identification.
The results in Figure 2 show few differences across the dimensions of policy
domain and institutional target. Of the three covariates, the effects of ideological
identification are by far the largest, with the average direct effects coefficient being
approximately .15 for assistance to the poor (and .16 for the total effect estimates).
By comparison, the corresponding effects of presidential and congressional
confidence are much smaller (approximately -.05 and .04 in the direct effects
models), and this pattern is very similar across the three separate policy domains
analyzed in Figure 2. The magnitude of these coefficients is largely unchanged in
the total versus direct effects models, indicating that the respective effects of the
three main independent variables are independent of one another and thus that
government confidence and ideological identification represent separate sources
of policy preferences.
Regarding the dimension of time, the effects of presidential and congressional
confidence each underwent a change after 1991. Whereas lower confidence in
congressional leaders was associated with lower support for government assistance
through 1991, lower support in subsequent years has had a declining impact."4
The reverse pattern is observed for presidents, with lower presidential confidence
16. 1358 1 Social Forces 79:4, June 2001
FIGURE 2: Standardized Effects of Confidence in President, Confidence in
Congress, and Ideological Identification for Items 1-3
0.50 - 0.50
GOVT. ASSISTANCE TO THE POOR: GOVT. ASSISTANCE TO THE POOR:
Total Effects Direct Effects
0.25 0 . - . 0.25
- .
._-*t§_@A/~4 ' " 0 9 0
*-#
A
,* 0.6@ u*
0.00 _ , __ 0.00 ' 0..
' ~~ I.
0ik
' * . .. s *. * s * ¾1 w *a'
-0.25 -0.25
74 76 78 80 82 84 86 88 90 92 94 96 74 76 78 80 82 84 86 88 90 92 94 96
0.50 .50 -
GOV"T. ASSISTANCE TO BLACKS: GOVT. ASSISTANCE TO BLACKS:
Total Effects Direct Effects
0.25 - 0.25 -
*- -- - -- - - -- - - - - - --
- - - - - --
* * ;~
_ j ,; _ ~.5 0. _0-0 ___.__ *
_ *_ __ _ _
* ;
_ _ __ _ S ##_, __ _ _
0.00 - --- --* -*- 0.00 - _,* - . ..
-0.25 -0.25 -
7 76 . . . . . .
74 76 78 80 82 84 86 88 90 92 94 96 74 76 78 80 82 84 86 88 90 92 94 96
0.50
0 .5 0 - - - -- -- - -- - - -- -- - - -- - -- -
GOVT. MEDICAL ASSISTANCE: GOVT'. MEDICAL ASSISTANCE:
Total Effects Direct Effects
0 .25 r - - - - - - - - - - - - - - - - - - - - - ---- - - 0.25
* ' */ */ *
O...
... .- ~* 0 - . 00
O. ------ - - -- - --- -- O' 0.00 4 S.,. ., S
.5 - .%
-0.25 r . - r . _ -0.25
74 76 78 80 82 84 86 88 90 92 94 96 74 76 78 80 82 84 86 88 90 92 94 96
Source: D)ata are from the General Social Surveys, 1974-96.
17. Declining Government Confidence in the U.S. / 1359
generally associated with higher support for government assistance prior to 1991
(but with lower support after 1991).
Notwithstanding the latter points, the more important finding is that the results
in Figure 2 reveal no net increase in the effects of presidential and congressional
confidence during the 21-year period covered by the analyses. We emphasize that
these effects are small in magnitude while also being independent of the (larger)
effects of ideological identification. The comparatively larger effects of ideological
identification are useful in establishing a baseline against which to gauge the relative
magnitude of goverrnent confidence. More specifically, the results in Figure 2
demonstrate that the small coefficients for presidential and congressional
confidence cannot be attributed solely to random measurement error in the
dependent variables, given that the latter do not prevent the corresponding
coefficients for ideological identification from being considerably larger in
magnitude.1 5
Corroborating our results for the first three dependent variables, our analyses
of the 24 remaining dependent variables do not reveal any consistently larger effects
of presidential and congressional confidence or any trends in their association with
policy preferences. These results are readily summarized using the simplified
graphical displays in Figures 3 and 4. In these figures, we present the median, 10tlh
percentile, and 90th percentile values for each set of standardized coefficients
measuring the total effects (the charts in the first column) and direct effects (the
charts in the second column) of presidential and congressional confidence. As
before, coefficients greater than (or less than) a value of 0 indicate an association
with policy preferences. By observing the circles designating the medians and the
small rectangles designating the lower (10%) and upper (90%) percentiles, we can
compare the variability of effects of presidential and congressional confidence across
policy domains.16
Like the average coefficients for the first three dependent variables, the median
coefficients for the total and direct effects of presidential confidence on the
remaining dependent variables are generally small in magnitude, with the largest
two coefficients being .09 for health care and .08 for social security. The 80% range
for these coefficients shows generally modest variation, with the majority varying
within a range of less than .08. As displayed in the bottom panels of Figure 3, the
corresponding effects for congressional confidence are smaller and their ranges
show even less variation.
Given the small magnitude of these effects, differences between policy domains
are not particularly noteworthy; the more important finding is instead the close
proximity of many coefficients to a value of 0 (e.g., the policy domains for crime,
drugs, transportation, and highways). Extending the earlier results from Figure 2,
comparisons of total versus direct effects suggest the independence of the effects of
presidential and congressional confidence from the corresponding effects of
ideological identification. Finally, our additional examination of year-specific
coefficients (using the more detailed type of chart employed in Figure 2) reveals
18. 1360/ Social Forces 79:4, June 2001
no evidence for trends in the effects of presidential and congressional confidence
on policy preferences.
Figure 4 summarizes the total and direct effects of presidential and
congressional confidence for our 12 final policy preference items. The results are
similar to those summarized in Figure 3: although modest in magnitude, the effects
of presidential confidence on policy preferences are generally larger than those of
congressional confidence, and total and direct effects coefficients are similar for
both presidential and congressional confidence. With two partial exceptions, the
over time results for these items provide no evidence of a consistently large or
increasing association between presidential and congressional confidence and
policy preferences.
The two instances of nontrivial associations relate to the effects of presidential
confidence on national defense spending and on federal income taxes. With regard
to defense spending preferences, its interrelationship with presidential confidence
was small through 1980 but subsequently increased in size, reaching a peak of .26
in 1984 (.23 in the direct effects model). However, because this relationship declined
in magnitude by the late 1980s,l7 it does little to change our overall portrait of
wveak and trendless associations between government confidence and policy
preferences.
Coefficients for the interrelationship of presidential confidence and preferences
relating to government taxes are modest in size, but they suggest a growth in
magnitude during the 1990s, increasing from .03 in 1991 to .15 in 1993 and
peaking at .25 in 1996. However, additional analysis of the 1998 GSS reveals a
return to smaller coefficients, providing evidence that the unusually large
association in 1996 does not represent an enduring trend."'
CHANGES CORRESPONDING TO SHIFTS IN PARTY CONTROL
Taken as a whole, the above results present a highly consistent portrait of the effects
of presidential and congressional confidence on policy preferences as small and
as having little relationship to the corresponding effects of ideological identification.
However, to fully evaluate the regime effects thesis, we analyze in greater detail
whether over time changes in coefficients' sign or magnitude correspond to changes
in party control of the House of Representatives or the presidency. With regard to
the presidency, we find that approximately 75% of shifts in party control were
accompanied by a change in coefficients' sign or magnitude. However, we also find
a largernumber of changes occurring within the same presidential administration
(or within two administrations controlled by the same party's president). Indeed,
the latter represent 64% of all changes in coefficients' sign or magnitude (thus
representing a more commoni type of change than changes corresponding to
switches in party control).
We obtain similar findings with respect to changes involving congressional
confidence, with more changes in coefficients (72%) occurring before the election
19. Declining Government Confidence in the U.S. 1 1361
FIGURE 3: Median and lOth/9Oth Percentiles for Standardized Effects of
Presidential and Congressional Confidence for Items 4-15
0.50 - 0.50 r-I---------I------------.-- .-.
PRESIDENTIAL CONFIDENCE: PRESIDENTIAL CONFIDENCE.
Total Effects Direct Effects
0.25 0.25 4
0.00 - ) iT T I I
Tj 0.00 * i- i- .
-0.25 - -025
.EZ~~~SJA Z I 6!Z
-.
3 6!2'I -- 9~~~~.11k
0.50 - 0.50
T - -- - ---------- ----- -
-
CONGRESSIONAL CONFIDENCE: CONGRESSIONAL CONFIDENCE:
Total Effects Direct Effects
0.25 ±- ---- . 0.25 4 - ------------ 1-I------ I I--------
! - 0. * * ;
i i T _ I
0.00
.Lj .LI
0.00 I -i i * 1T
1
-0.25
i 1 9 I .1
A m I=
11 .S.,u I m.V ix: ', I I fi
f
S5 2 br ce s > =
Source: Data are from the General Social Surneys, 1974 -96.
20. 1362 / Social Forces 79:4, June 2001
FIGURE 4: Median and lOth/9Oth Percentiles for Standardized Effects of
Presidential and Congressional Confidence for Items 16-27
0.50 r---- ----------11---------- - --- . ..-
-
0.50 T- ---- ---------- ---- --- --
PRESIDENTIAL CONFIDENCE: PRESIDENTIAL CONFIDENCE:
Total Effects Direct Effects
o0.25
5- -- -- -- --
-- - - - 0.25 r ---------- - -
-T
I
0.00
* ,- A- -I- -
i - 7 I i I
-0.25 1 r ---- - - -0.25 .-
--- - -.
s. = e
W.
? ?
P. 4 0' X 2 A
I Ai
'Z '
*2 ; t '.0 t _ *i 93 * A , Ig
v.
e 9 ,
0.50 - 0.50 r------------------
CONGRESSIONAL CONFIDENCE: CONGRESSIONAL CONFIDENCE:
Total Effects Direct Effects
0.25 + - - - - - - - - - - - - - - -- - - - - - - - - - 0.25 - - - -
- - - --- -- --- ---
T
T1 I. . 0T 1 Is ; |L i I
0.00 0.00 -.--- -_-- -- --P T
-- -- -- -- ---
- --
I sT _ -~~~~~~~~~~--
-0.25 -0.25
M 9 u A -6 c- 9 I 9 t g, %, .M1 I*! .1 1- -BI 4 At I I
< .; a .%2 ,I is
a9 2j. f
< A 9
'M
-1 -,
t.'I M S. -
A I
E I "I. 2
, - t t t t
.9 t t , 'i. i t ii.
I " 2 3 .4 &
2 W .
t ,,
Source: Data are from the General Social Surveys, 1974 -96.
21. Declining Government Confidence in the U.S. / 1363
of the 104th Congress (i.e., during the pre-1995 period of Democratic control).
While some changes in congressional (or presidential) confidence may be related
to political scandals (Paxton 1999) or economic change (Lawrence 1997), their
primary relevance to the current study stems from our larger finding that most
changes occur within periods of party control, thereby deviating from the
expectations of the regime effects thesis. We discuss below implications for
competing interpretations of government confidence.
Discussion
Although competing interpretations of declining government confidence provide
divergent answers to important questions about pressures for the devolution of
federal policy-making authority, contemporary debates are inconclusive because
of the underdeveloped state of empirical research. Indeed, the most prominent
statements (Greenberg 1995; Morris 1998; Skocpol 1996; see also Brinkley 1997)
suggest provocative hypotheses without attempting to directly measure the impact
of changing levels of government confidence. Our analysis addresses the limitations
of these commentaries and of past studies (e.g., Jennings 1998; Miller 1974a) by
distinguishing between theoretically relevant aspects of government confidence and
policy domains, analyzing data over a longer and more recent time period than
covered in past research, and considering a wide range of policy domains. As a
result, we are able to test hypotheses implied by competing interpretations of
government confidence.
Because it implies a strong relationship between government confidence and
policy preferences, the devolution thesis is not supported by our analyses.
Underlying the devolution thesis is the assumption that low levels of confidence
in government are related to citizens' preferred level of involvement by the federal
government in policy-making activities. If the devolution thesis were true, there
should be a large association by the 1990s between government confidence and
policy preferences, but we find no such evidence across numerous policy domains.
Not only is the relationship between government confidence and policy preferences
small in magnitude, but only one of the twenty-seven policy domains we analyze
is even remotely close to approximating a trend toward increasing association.
Given the large number of policy domains and relatively long time period covered
by our analyses, these results put the burden of proof on proponents of the
devolution thesis.
Our analyses provide qualified support for the regime effects thesis that shifts
in party control contribute to changes in the impact of presidential and
congressional confidence. However, because there are even more numerous
instances of such changes occurring without shifts in party control, the regime
effects thesis is a limited guide to understanding these changes. Moreover, because
22. 1364 / Social Forces 79:4, June 2001
the effects of presidential and congressional confidence are typically small in
magnitude, changes between presidential administrations or sessions of Congress
have few consequences for the interrelationship of government confidence and
policy preferences.
Taken as a whole, our results favor the symbolic change thesis. The evidence is
especialy noteworthy in that it takes into account the widest possible range of policy
domains over a long time period in which t-he salience of government distrust might
itself have increased, thereby disposing individuals to weigh more heavily their
confidence level when evaluating current or prospective federal policies. We also
emphasize that our study analyzes measures of government confidence and policy
preferences whose reliability and validity are well established. Indeed, we build from
past research by analyzing the same two items used in Lipset and Schneider's (1983,
1987) seminal study of trends in government confidence, as well as nine of the
core items used by Stimson and his colleagues to measure policy preferences
(Stimson 1989) and their relationship to changes in public policv (Stimson,
Mackuen & Erikson 1995).
Our results extend and refine Lipset and Schneider's (1983) interpretation of
public confidence in government. Lipset and Schneider viewed declining
government confidence as a largely symbolic phenomenon, produced by changing
patterns of media coverage but not indicative of dissatisfaction with political
institutions or with the direction of public policy-making. However, they
nevertheless offered some qualifications based on their analysis proceeding no
further than the early 1980s, concluding that any further decline could be indicative
of "signs of deep and serious discontent" (1983:412). In doing so, Lipset and
Schneider (1987; see also Schneider 1992) allowed for a scenario in which symbolic
distrust could later evolve into substantial dissatisfaction with the federal
government and possibly even pressure for the devolution of policy-making
authority.
We go beyond Lipset and Schneider's study by directly analyzing the
interrelationship of government confidence and policy preferences. Because our
analyses also cover the post-1980 period, they provide evidence that government
distrust has not evolved into substantial policy dissatisfaction since that time. In
particular, our results suggest that contemporary policy conflicts over such issues
as health care reform and the House Republicans' Contract with America did not
provide individuals with cues to develop closer connections between their level of
government confidence and their preference for governnment activism.1 9 Moreover,
despite long-standing, negative attitudes toward Congress (Hibbing & Theiss-Morse
1995), congressional confidence tends to have an even smaller association with
policy preferences than presidential confidence. Taken as a whole, these results
provide little grounds for expecting a larger association between confidence in
government and policy preferences in the immediate future. Given that the focus
of both this study and of contemporary debates are on policy preferences, further
23. Declining Government Confidence in the U.S. J 1365
research may be able to shed light on the possibility that government confidence is
related to other processes or outcomes.
DECLINING GOVERNMENT CONFIDENCE AND CONTEMPORARY WELFARE STATE
RETRENCHMENT
In assessing whether declining confidence might hav,e created public support for
devolution, we can think of no more convincing evidence than a strong association
between individuals' level of confidence in the federal govermment and their level
of support for govermment involvement across numerous policy domains. Indeed,
in light of evidence for the interrelationship of public opinion and public policy
discussed in our introduction to this article (see Burstein 1998 for review), such
an association would indicate that declining confidence could contribute to the
devolution scenario by affecting the public's preferred levels of federal involvement
in policy-making. However, given our findings of a consistently small relationship
between government confidence and policy preferences, we find no evidence that
declining confidence can be a major contributor to this scenario.
Over the past decade, conflicts over such reforms as Ronald Reagan's New
Federalism proposal and the transformation of federal welfare programs through
the 1996 Personal Responsibility and Work Opportunities Reconciliation Act have
given rise to a burgeoning literature on welfare state retrenchment (Palmer &
Sawhill 1982; Skocpol 1996; Zylan & Soule 2000; Weaver 1986; see also Grant
1995). Within this literature, an important proposition developed by Pierson (1994,
1996; see also Conlan 1988) is that public support for specific policies constrains
the capacity of government officials to trim entitlements or limit federal spending,
potentially explaining the absence of more extensive patterns of retrenchment in
the current era. Indeed, a large body of opinion research has found consistently
high levels of support for many types of public social provision (including education,
health, and social security), with liberal trends outnumbering conservative trends2 0
during the past two decades (Davis 1992; DiMaggio, Evans & Bryson 1996; Page &
Shapiro 1992; Smith 1990).
In this context, our results have two noteworthy points of relevance to research
Oni welfare state retrenchment. First, while some political commentators have
assumed that devolution of federal policy-making authority to the states or local
government would help restore public confidence (Nye 1997), our findings of a
consistently small association between government confidence and policy
preferences cast doubt on this assumption. The causal status of these two factors
is, of course, inconclusive in our cross-sectional analyses, but the absence of a large
relationship by itself suggests that federal program cuts or more extensive
retrenchment would do little to enhance public confidence in presidents or
congressional leaders. 21
Second, we emphasize that neither research on welfare state retrenchment nor
the literature on public opinion and policy change has analyzed the role of
24. 1366 / Social Forces 79:4, June 2001
confidence in government. However; our finding that support for federal
involvement is consistent with high levels of public distrust of government suggests
that the explanation for contemporary patterns of retrenchment is to be found
elsewhere (see also Zylan & Soule 2000). Accordingly, while low levels of confidence
in presidents and congressional leaders show little sign of receding, there is little
evidence that they contribute to, or provide a mandate for, comprehensive
retrenchment at the federal level. Low levels of government confidence instead
appear to be compatible with public unwillingness to limit many government
programs.
Notes
1. The literature on government confidence equates confidence and trust - an
assumption buttressed by findings that survey respondents' most common definition
of "confidence" involves reference to "trust" (Smith & Taylor 1979).
2. Note, however, that two recent studies within this literature have also reported a small
but significant decline in this relationship (Jacobs & Shapiro 1997; Monroe 1998),
suggesting that the divergence of federal policy-making from public opinion has increased
during the past fifteen years.
3. Although a majority of research has relied on National Election Survey (NES) data
(e.g., Citrin 1974; Hetheringtoni 1998, 1999; Jennings 1998; Miller 1974a), the GSS items
have a number of desirable features (discussed below) that distinguish them from the
single NES item used in previous studies. Our analysis of the NES data yielded consistent
results, and we present the results fromi the GSS analysis in light of the considerably
broader set of findings that the GSS data vield.
4. Our analysis of the GSS data begins with the 1974 survey, the first in which a number
of items central to our analyses were fielded. We note that the GSS was not fielded in
1979, 1981, 1992, and 1995 and that since 1988 the GSS has employed a rotating, split-
ballot design. Because of the periodic availability of several items, some of our models
span the years 1974 to 1996 while others span the years 1984 to 1996. As discussed in the
results section, the differences have little effect on our inferences by virtue of the
consistency of the results over time and across policy domains.
5. We investigated whether treating these items as categorical covariates would yield
different estimates of their association with policy preferences. Given clear evidence to
the contrary, we present the results using the less cumbersome, interval-level
measurement.
6. We assume that individuals' levels of confidence in presidents and in congressional
leaders represent separate phenomena. Bivariate analyses of the two GSS confidence items
provide evidence supporting this assumption, with the average correlation coefficient
being .41 (with a high of .51 in 1978 and a low of .33 in 1975). Such values are also well
below the -. 75 threshold past which collinearity would be a problem in multivariate
analyses.
25. Declining Government Confidence in the U.S. / 1367
7. In Table 1, the nine items are 1, 3-5, 7-10, and 18.
8. The twelve years are 1975, 1983, 1984, 1986, 1987, 1988, 1989, 1990,1991,1993,1994,
and 1996.
9. These domains relate to health care, welfare, social security, education, African
Americans, cities, environmental protection, fighting crime, drug addiction,
transportation, infrastructure, parks, foreign aid, national defense, and federal income
tax. As summarized in Table 1, the federal income tax item is also trichotomous but has
slightly different response category labels and question wording. We note that the
inclusion of this item is instructive in light of Scholz and Lubell's (1998) evidence that
distrust of government may dispose individuals to resist paying income tax.
10. For health care, welfare, education, African Americans, cities, environmental
protection, drug addiction, foreign aid, and national defense, the available years are 1974,
1975, 1976, 1977, 1978, 1980, 1982, 1983, 1984, 1986, 1987, 1988, 1989, 1990, 1991, 1993,
1994, and 1996. As discussed in the results section, the remaining six items are available
in a smaller number of the GSS surveys.
11. These items (and their survey years) are job provision (1989, 1989, 1991, and 1996),
social security and health care (1990 and 1996), unemployment assistance (1989, 1989,
and 1996), housing provision and educational opportunities (1990 and 1996), income
inequality (1990, 1991, and 1996), and industrial assistance and inflation control (1990
and 1996).
12. Given the magnitude of black/nonblack differences in policy attitudes, we conducted
a search for interaction effects between race and government confidence. As illustrated
in the Appendix (which presents models with these interaction effects for an illustrative
dependent variable), these analyses provide little evidence for significant interactions.
13. We conducted additional analyses for interaction effects between ideological
identification and government confidence but found no significant interactions.
14. Given the Republican Party's congressional majorit,y after the 1994 midterm elections,
a change of sign (but not magnitude) for the coefficient would indicate individuals'
awareness of this change in party control. However, the results in Figure 2 suggest that
the declining association of congressional confidence and policy preferences was under
way before the 1994 election.
15. The small magnitude of the effects of presidential and congressional confidence can
be further appreciated through a comparison with the corresponding effects of the well-
known black/nonblack cleavage in policy preferences (Erikson & Tedin 1995; Tate 1993).
For our first three dependent variables, the average total effects coefficient for the
dichotomous race variable is -.25, a figure well in excess of the large majority of the
corresponding coefficients for government confidence. Indeed, in only 2 cases (discussed
below) out of more than 500 is the coefficient for presidential or congressional confidence
equal to or greater than an absolute value of .25 (the large majority have a value of less
than .10). To call attention to these findings we use .25 intervals on all figures' y-axes.
16. Because our analyses of items 4-27 show no trends in coefficients, Figures 3-4 do
not present the year-specific estimates, relying instead on summary box-plots. Eight
26. 1368 / Social Forces 79:4, June 2001
graphical displays with the detailed year-specific coefficients of the sort used in Figure 2
are available from the authors.
17. In 1989, the total effects coefficient for presidential conifidence was . 3, declining further
to-.01 in 1993.
18. The standardized coefficient for the total effects of presidential confidence on
government taxes in 1998 (.17) is c)mparable to the corresponding coefficient from 1994
(.15) and considerably smaller than the 1996 coefficient (.25). The effects of congressional
confidence on tax preferences in 1998 are small and nonsignificant (-.04 and -.03 for
total and direct effects estimates).
19. These conclusions fit well with Pauxton's (1999) study of social capital, which finds
that the interrelationships of confidence in educational leaders, confidence in religious
leaders, and confidence in leaders of government institutions have been stable since the
early 1970s.
20. Conservative opinion trends include increased support since the ]i960s for punitive
measures regarding crime (Erikson & Tedin 1995) and decreasing support in the 1990s
for public spending on welfare (Smith 1995).
21. The risks of interpreting low levels of government confidence as implying public
support for devolution can also be appreciated by considering a contemporary historical
example. Buttressed by their congressional majority following the 1994 elections, Speaker
Newt Gingrich and a large segment of House Republicans promulgated their 10-point
Contract with America, citing low confidence in government as providing a mandate
for transferring policy-making authority from the federal government to the states. The
public's subsequent response appears to have been- largely negative (National Journal
1996), reflecting support for many existing government programs and later disposing
the majority of the public to blame House Republicans for the 1995 shutdown of the
federal government (Abramson, Aldrich & Rohde 1998).
27. Declining Government Confidence in the U.S. /1369
~~~~~~~In
OA X' O GO r'l Lon c r,
v <OON_. ' ff0rE°L
Ln z cm~ -tn
oWtO oS Soo
00
CI C-,..q O'O ; N t <, N ep NxDn
'aD
r)~~~UN0
_: ON c. Or 00
CVr) On Oc Ol 'O O , O
- -~~~
* C00Un
0C0---cn , 0n
CN -00p-1
q UUN0 i
I QO -r O. O 0c
0
c; CCO0-0 o 0 N O
*n£ OC n
.05) CD O W O to O
t n 00 1
C n
0 n Ln cc et O m r, en On
*Li
*, O )oo
- o C UN o C No C =
C~~~~~~
o O C'C C, I- N UO
ON N
C * ** *
rA r4* rs4 al O1 Cr 10Q
r
*,W,, I an
I I I I I < 'N X~~~~~~N
Ps % O. O, O 1^ 0 0 O. ,
O~O ~O 0. 1 L
r UIV t 0 'C OL 00 ON 00 , . - LNr) C~
S D0 c0
to CS O O O O W 0 <~~~~~~~~~~~~~~c 0
r OC O
; tON 0 O
C O _ l I~~~~~~~~~~~~~~~~~~~r
_I ON O
c) ~ ~~~~~~IO
V) In L)' <c tS0
t CY 1 ul cq Oa tO
ON ~~ ~ ~ ~
Ej °Ya tre o ~~~~~~~~~~~~~~~x
x gt
0 | .1 1e_> ez g2
0 g
p i ,$
,,l W1
= ,