Download as PDF, PPTX

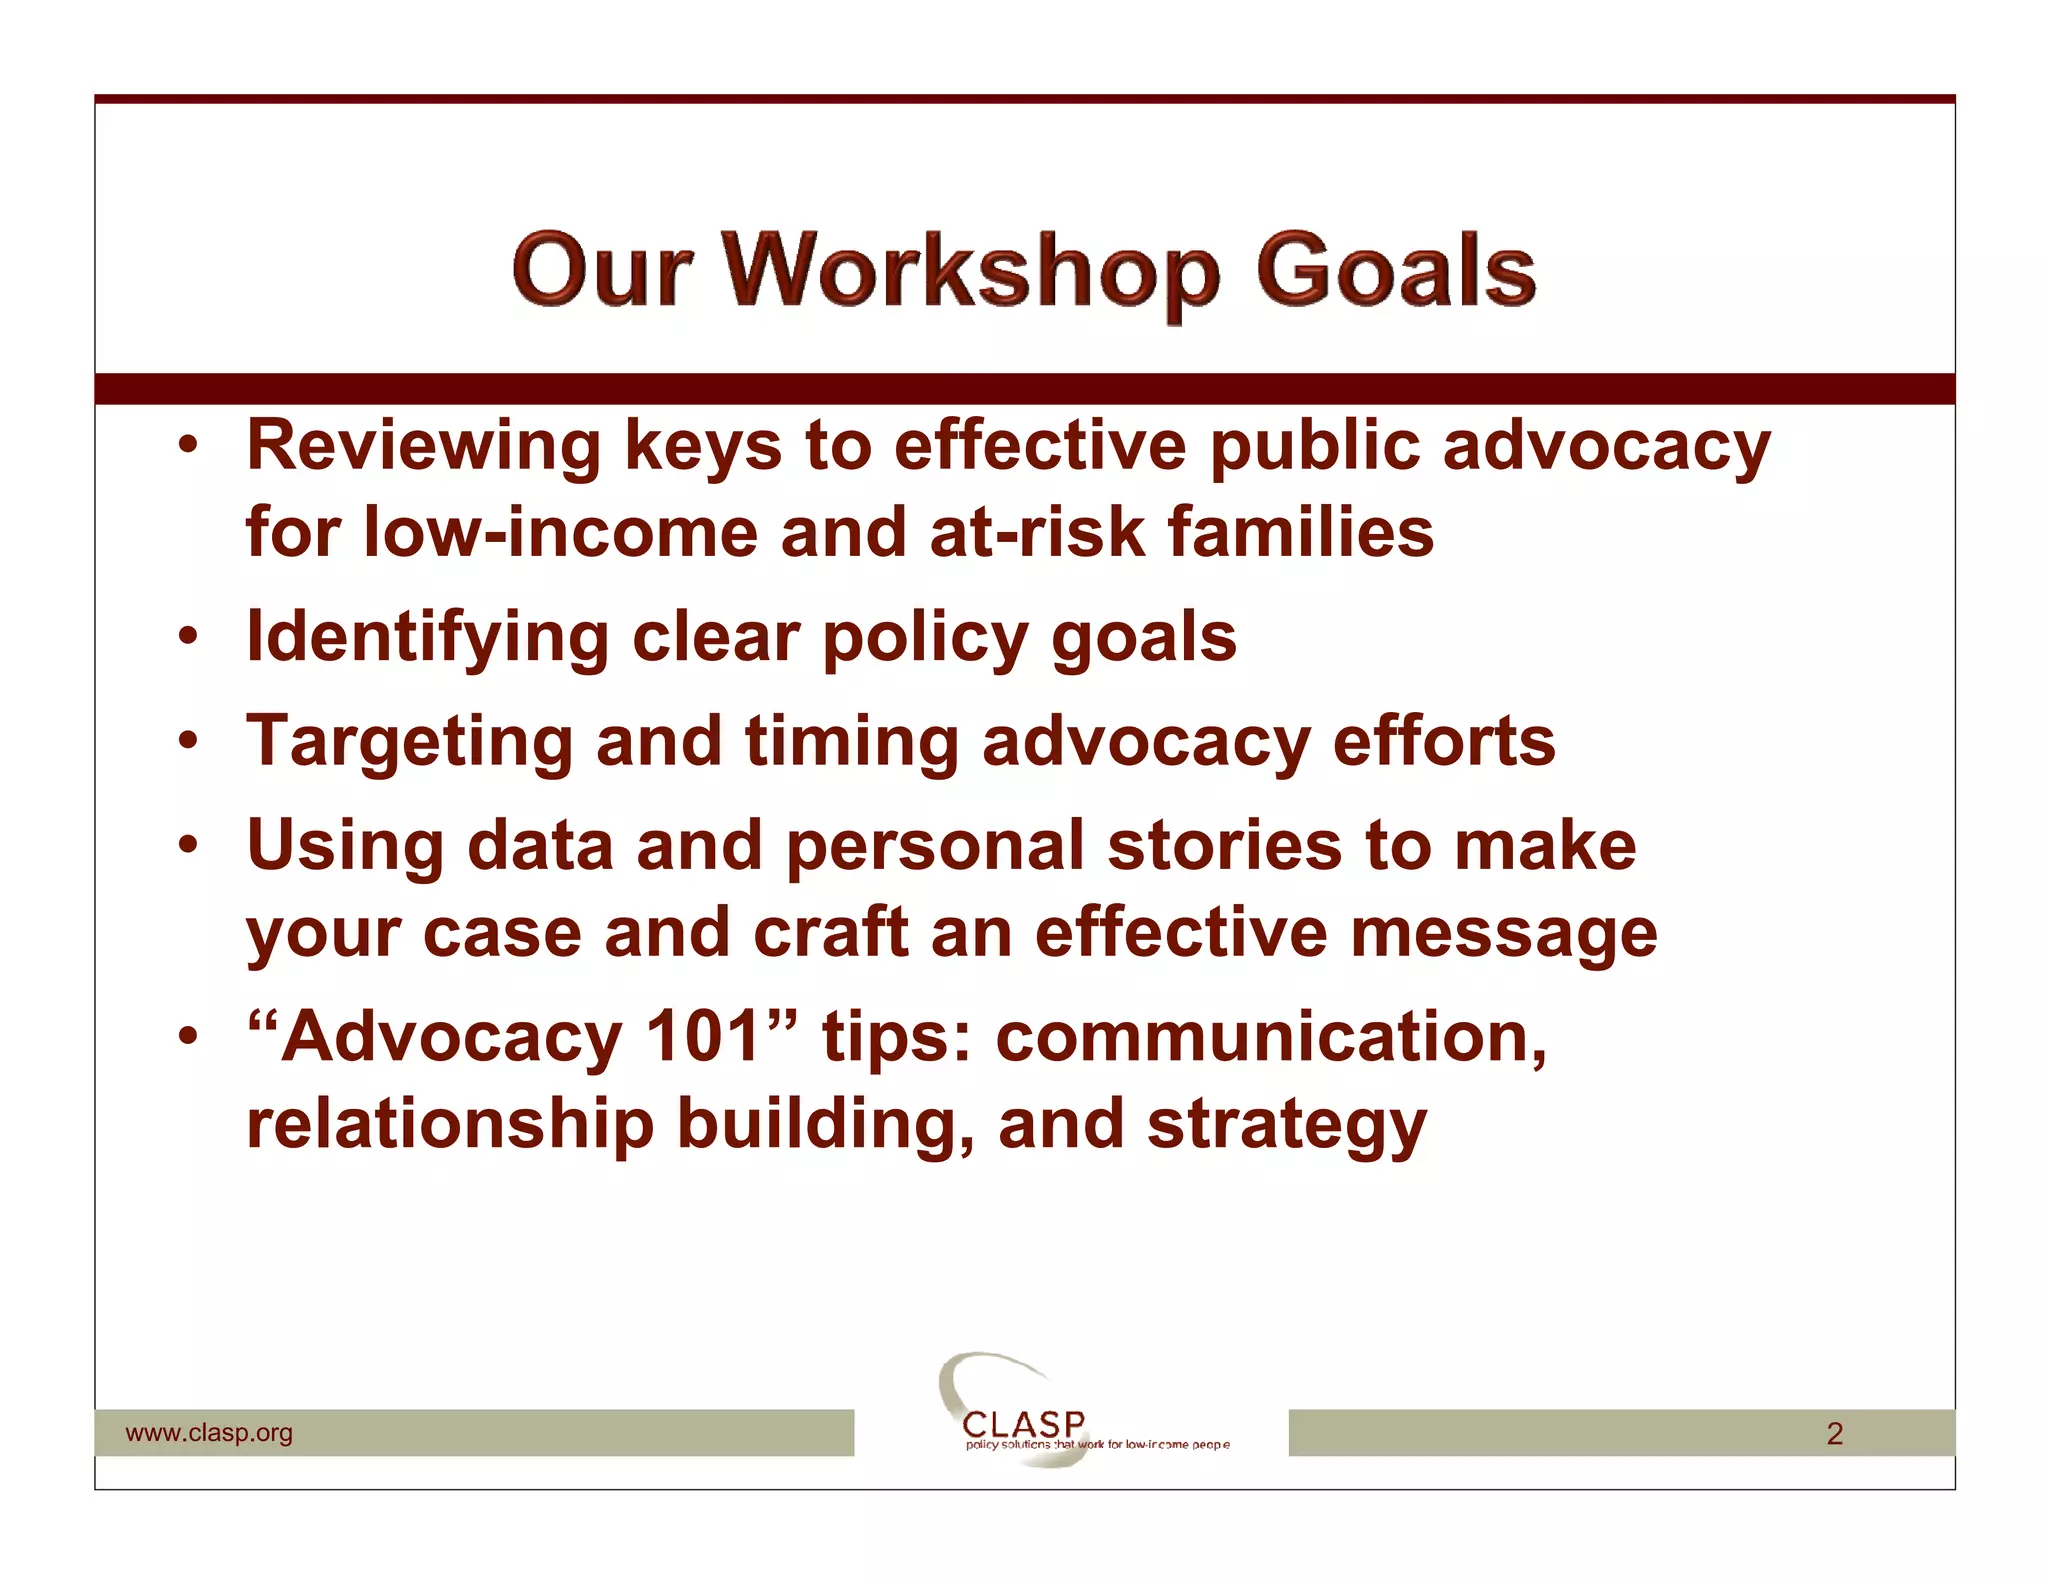
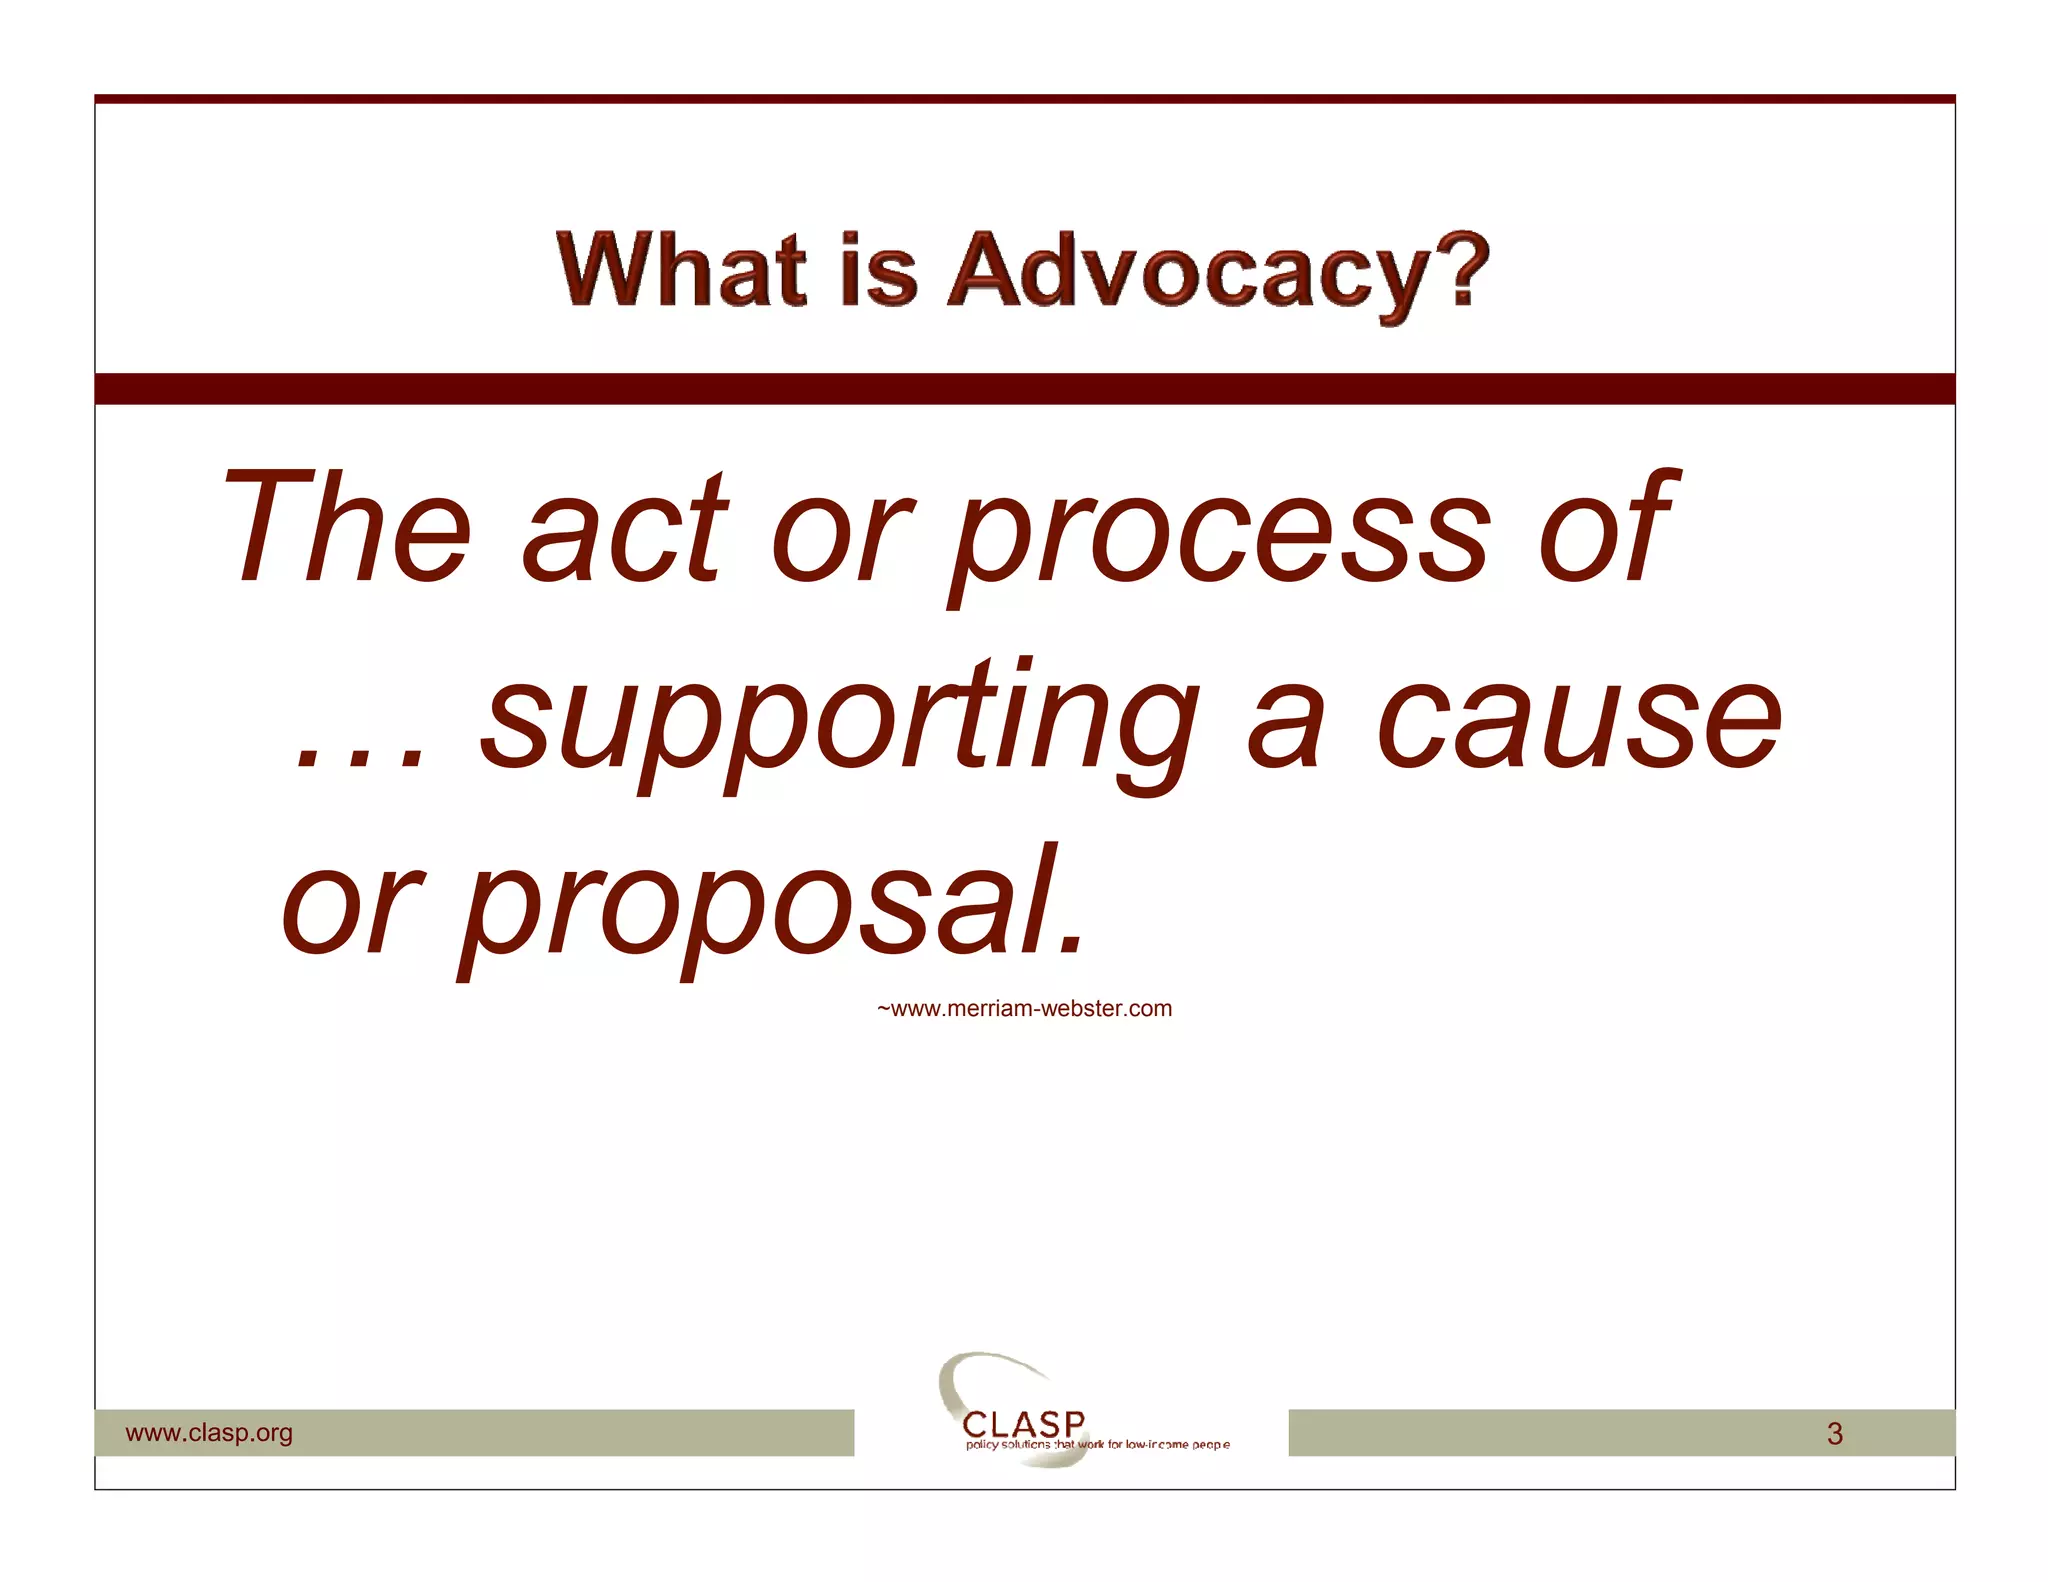


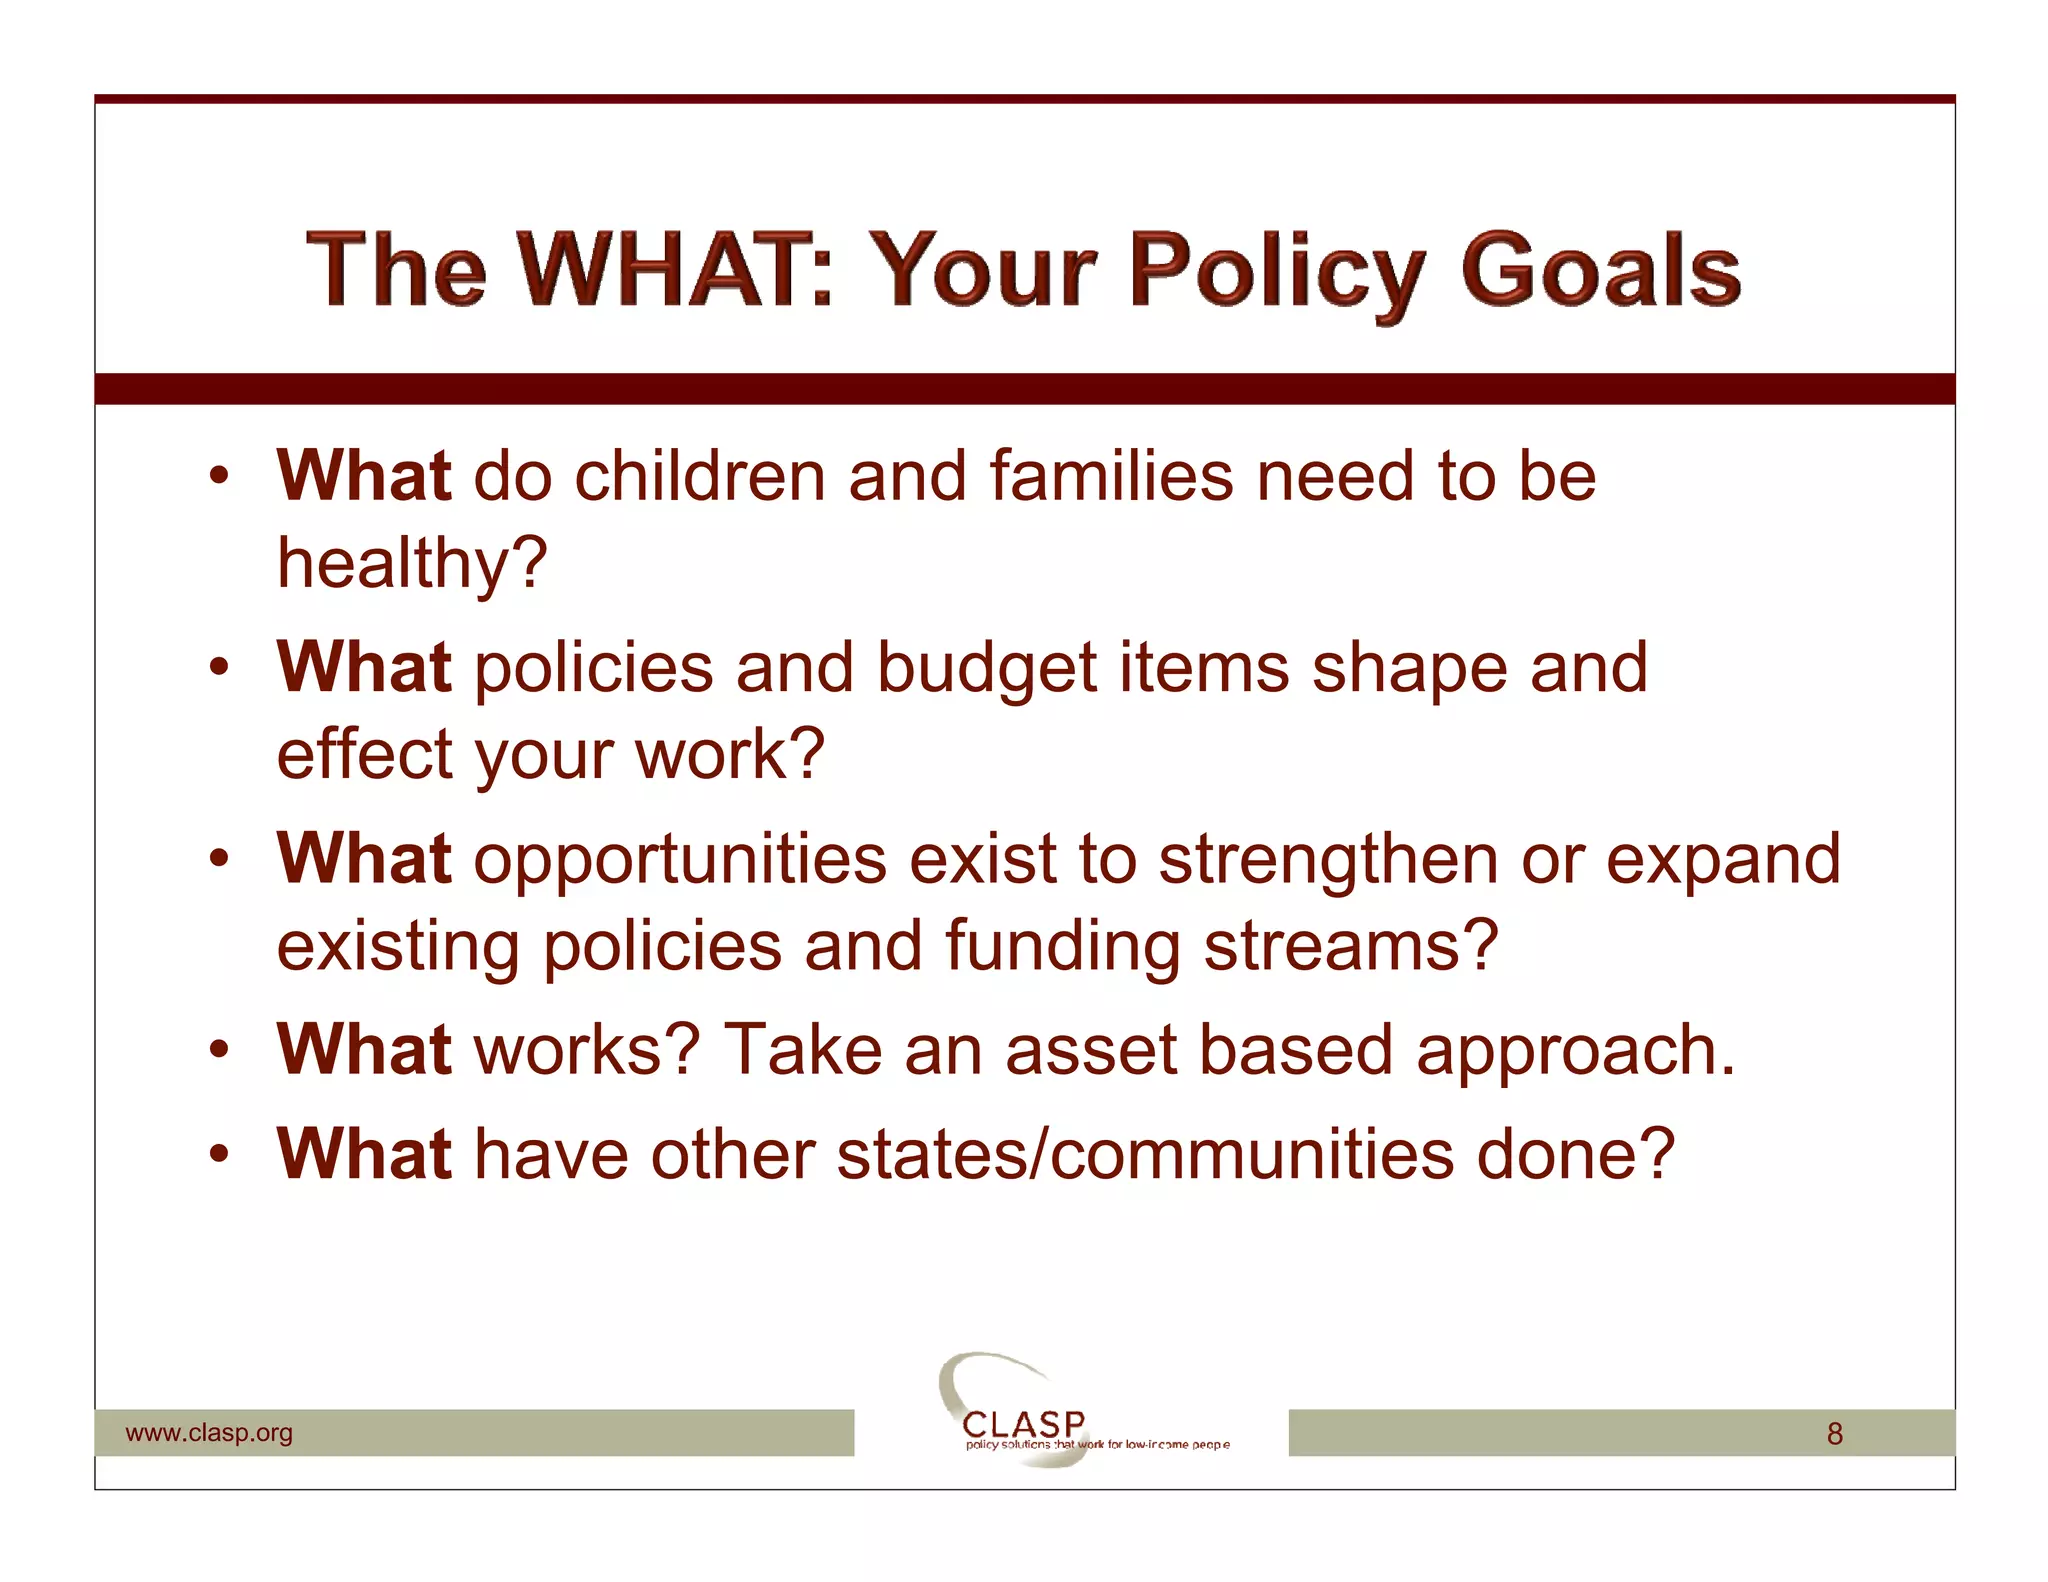

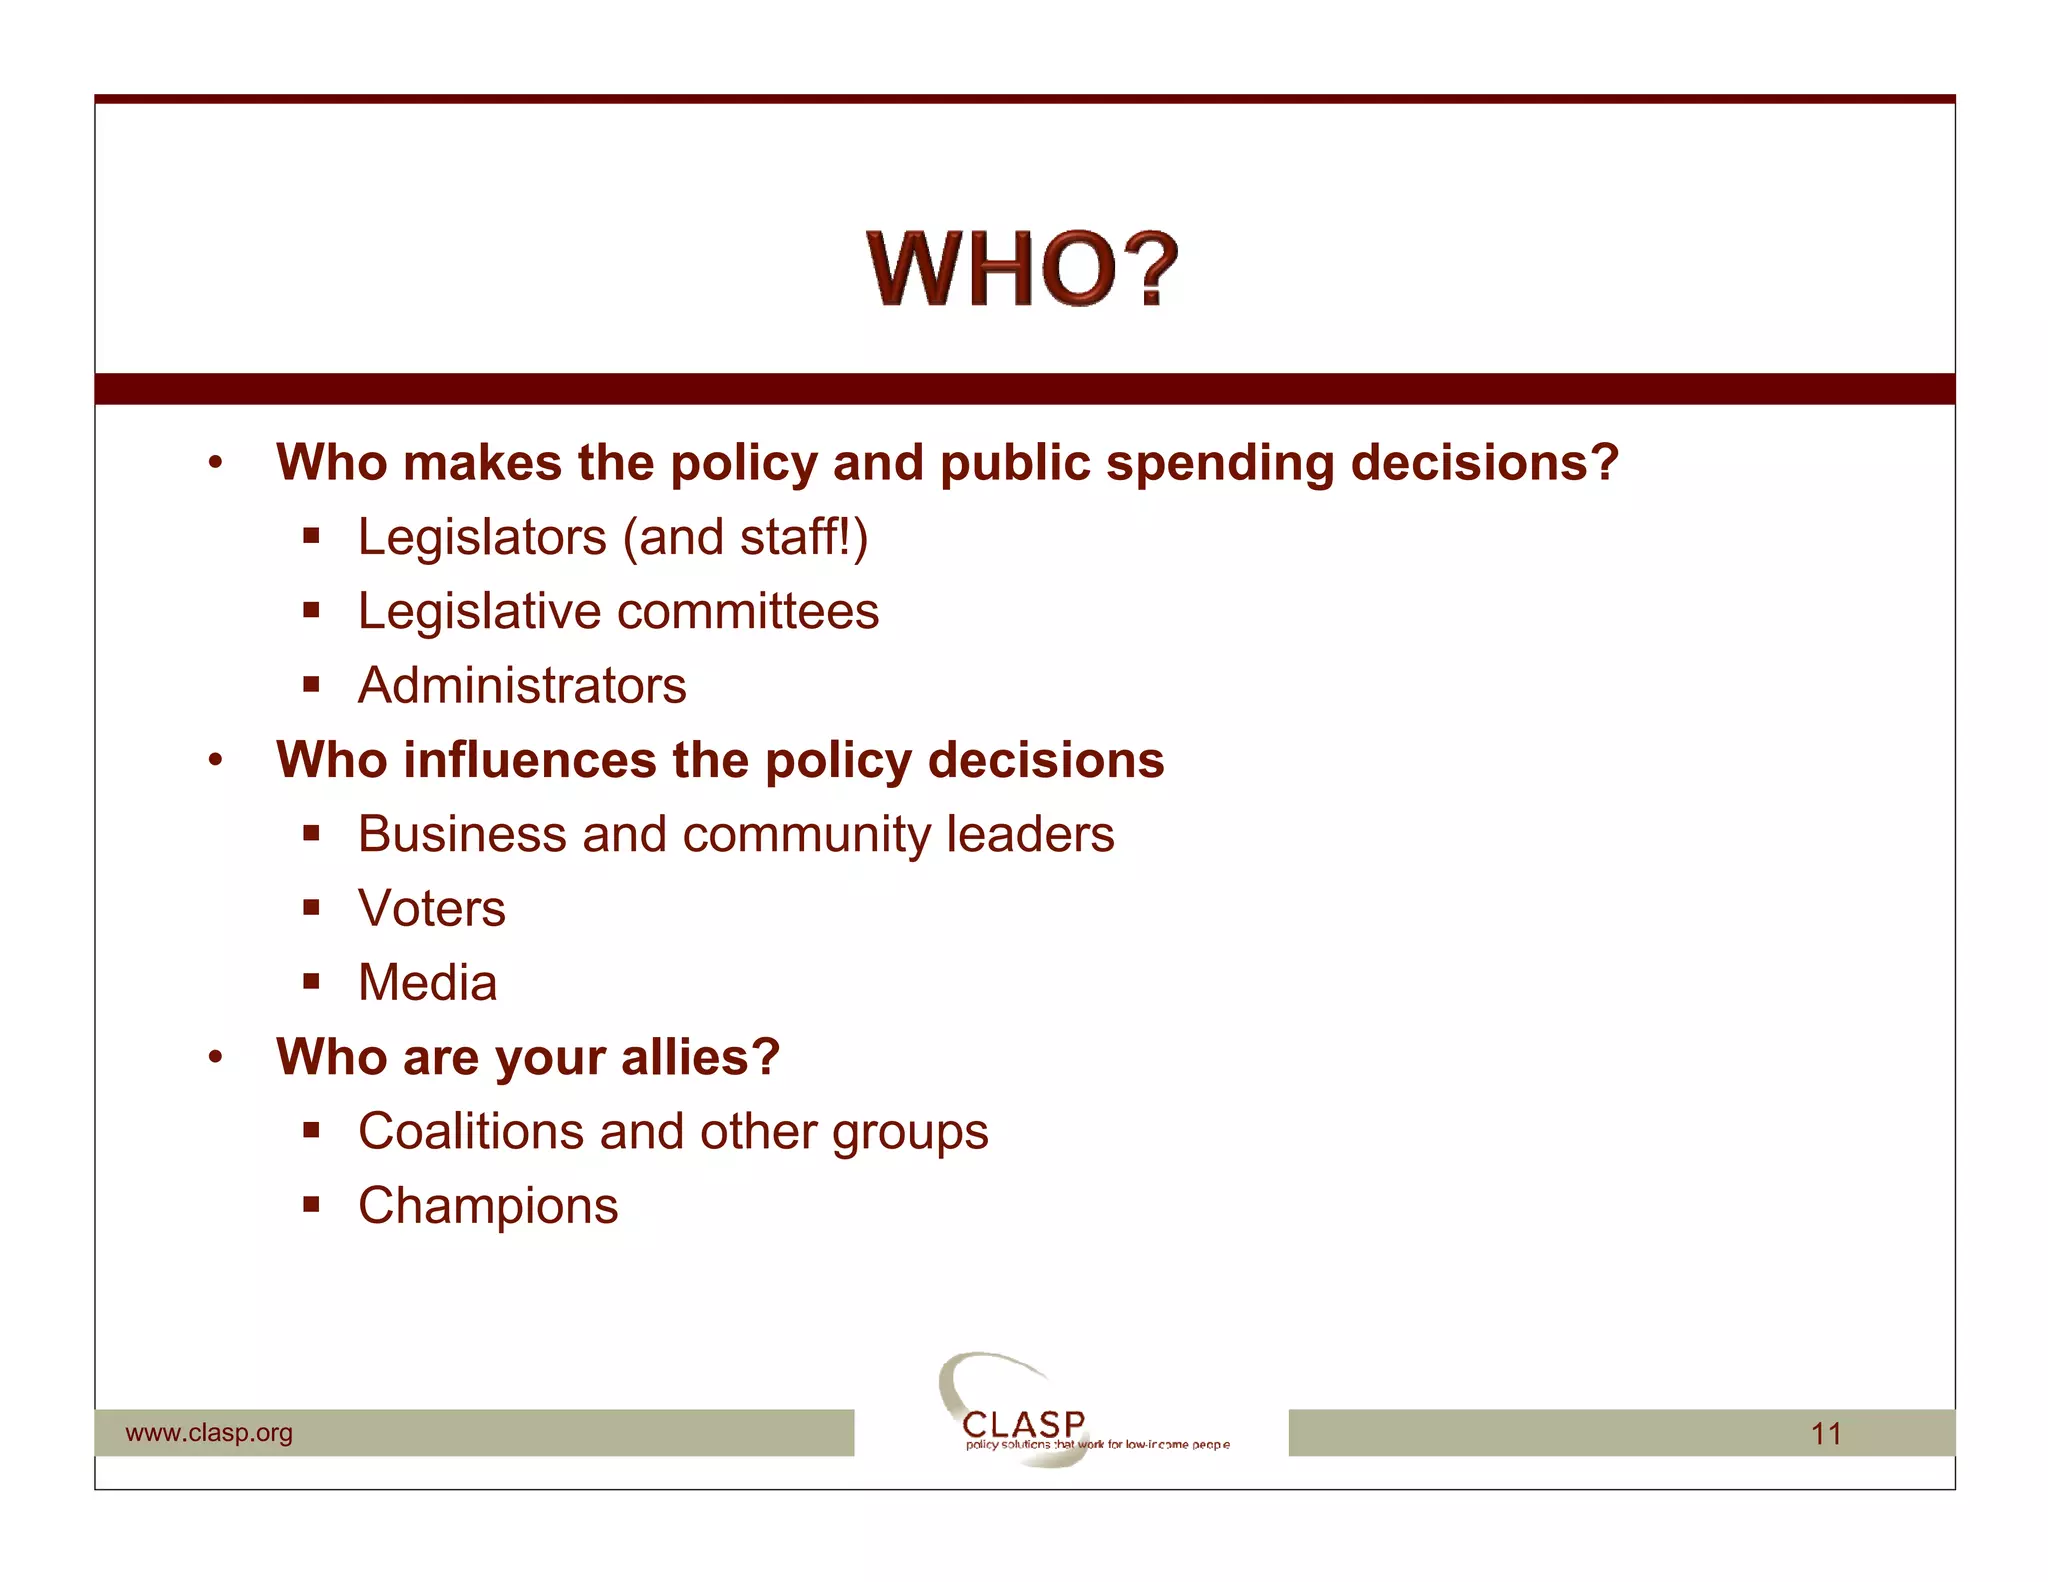

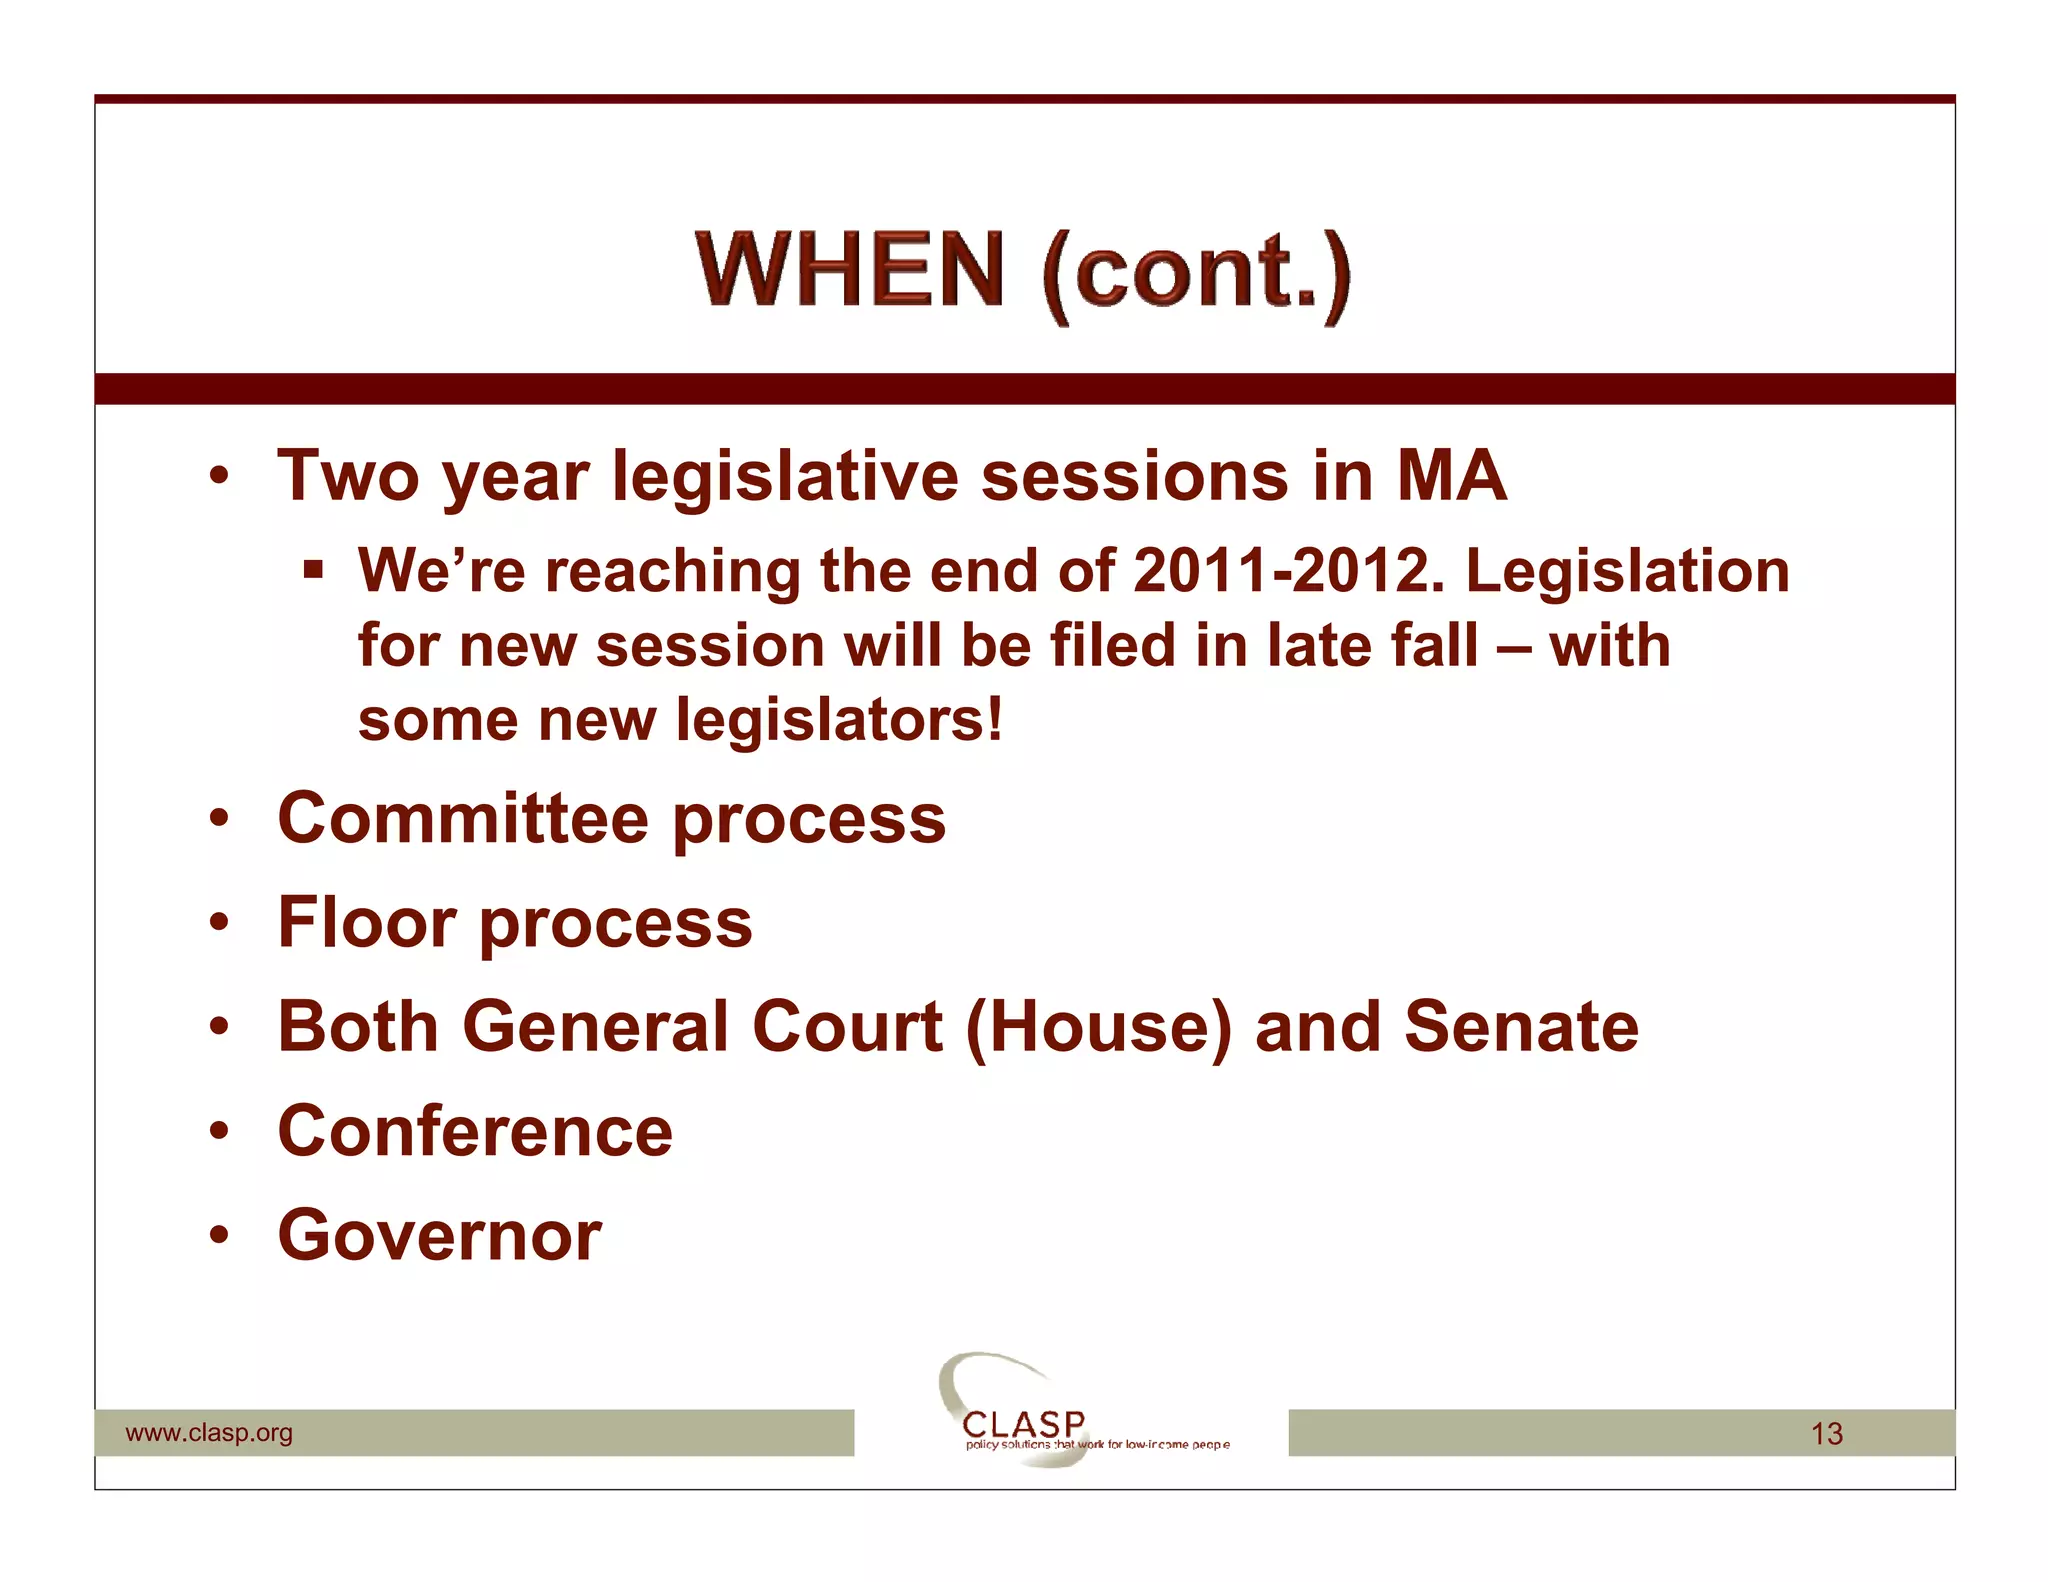


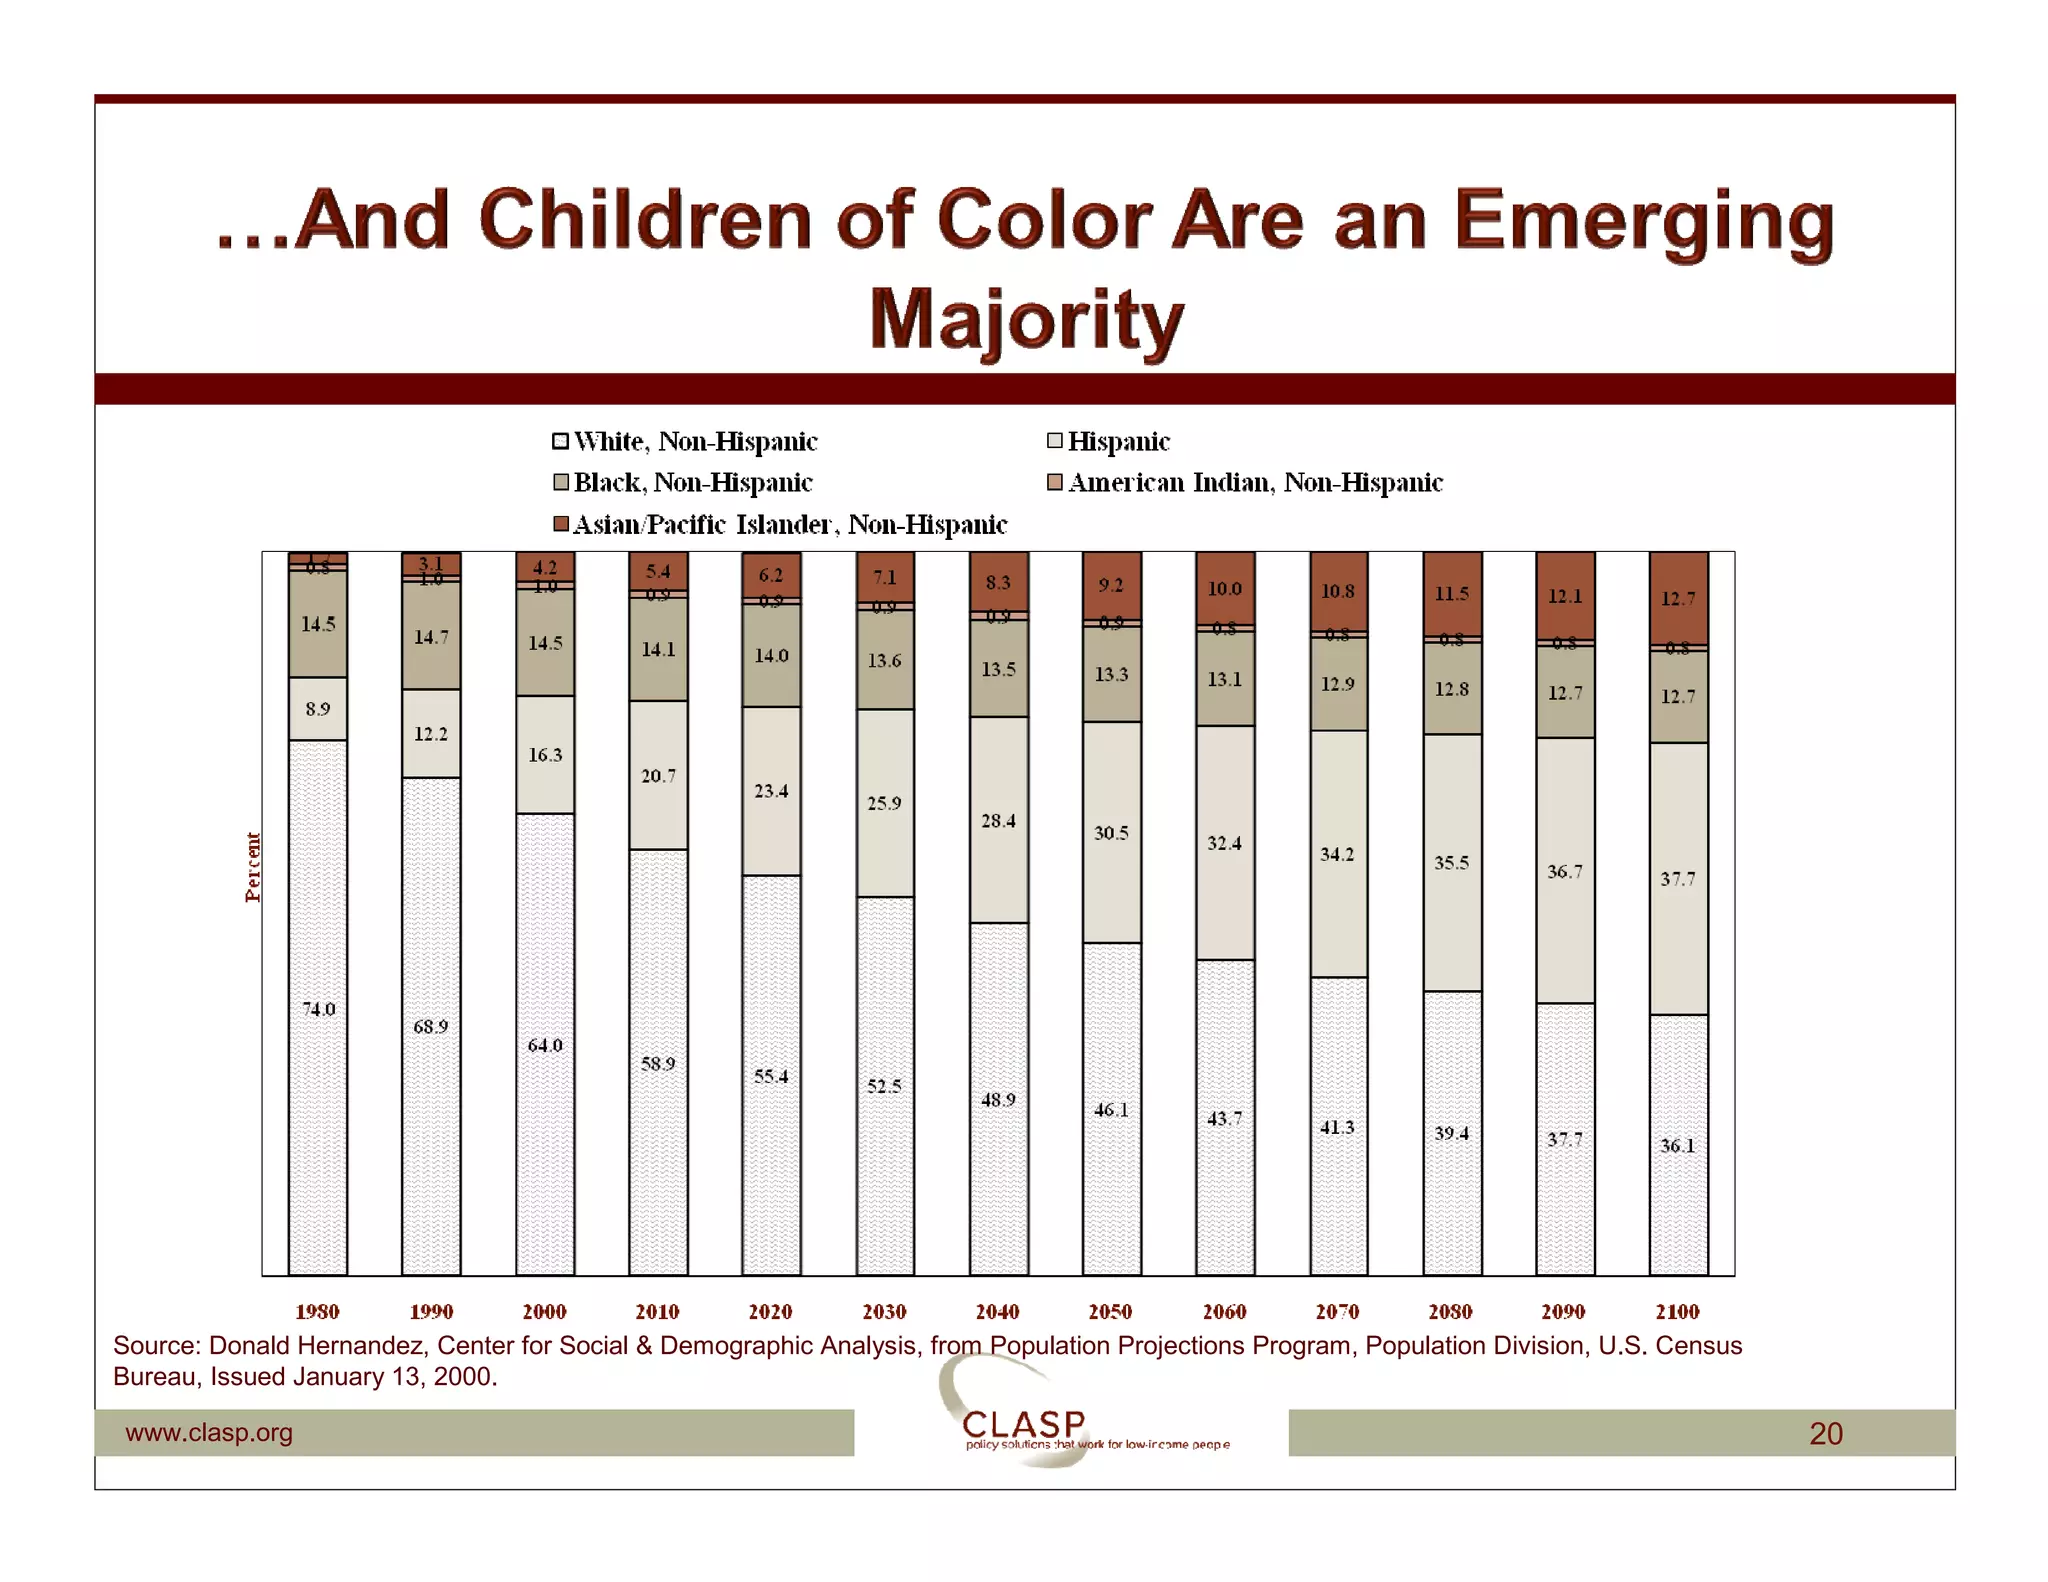


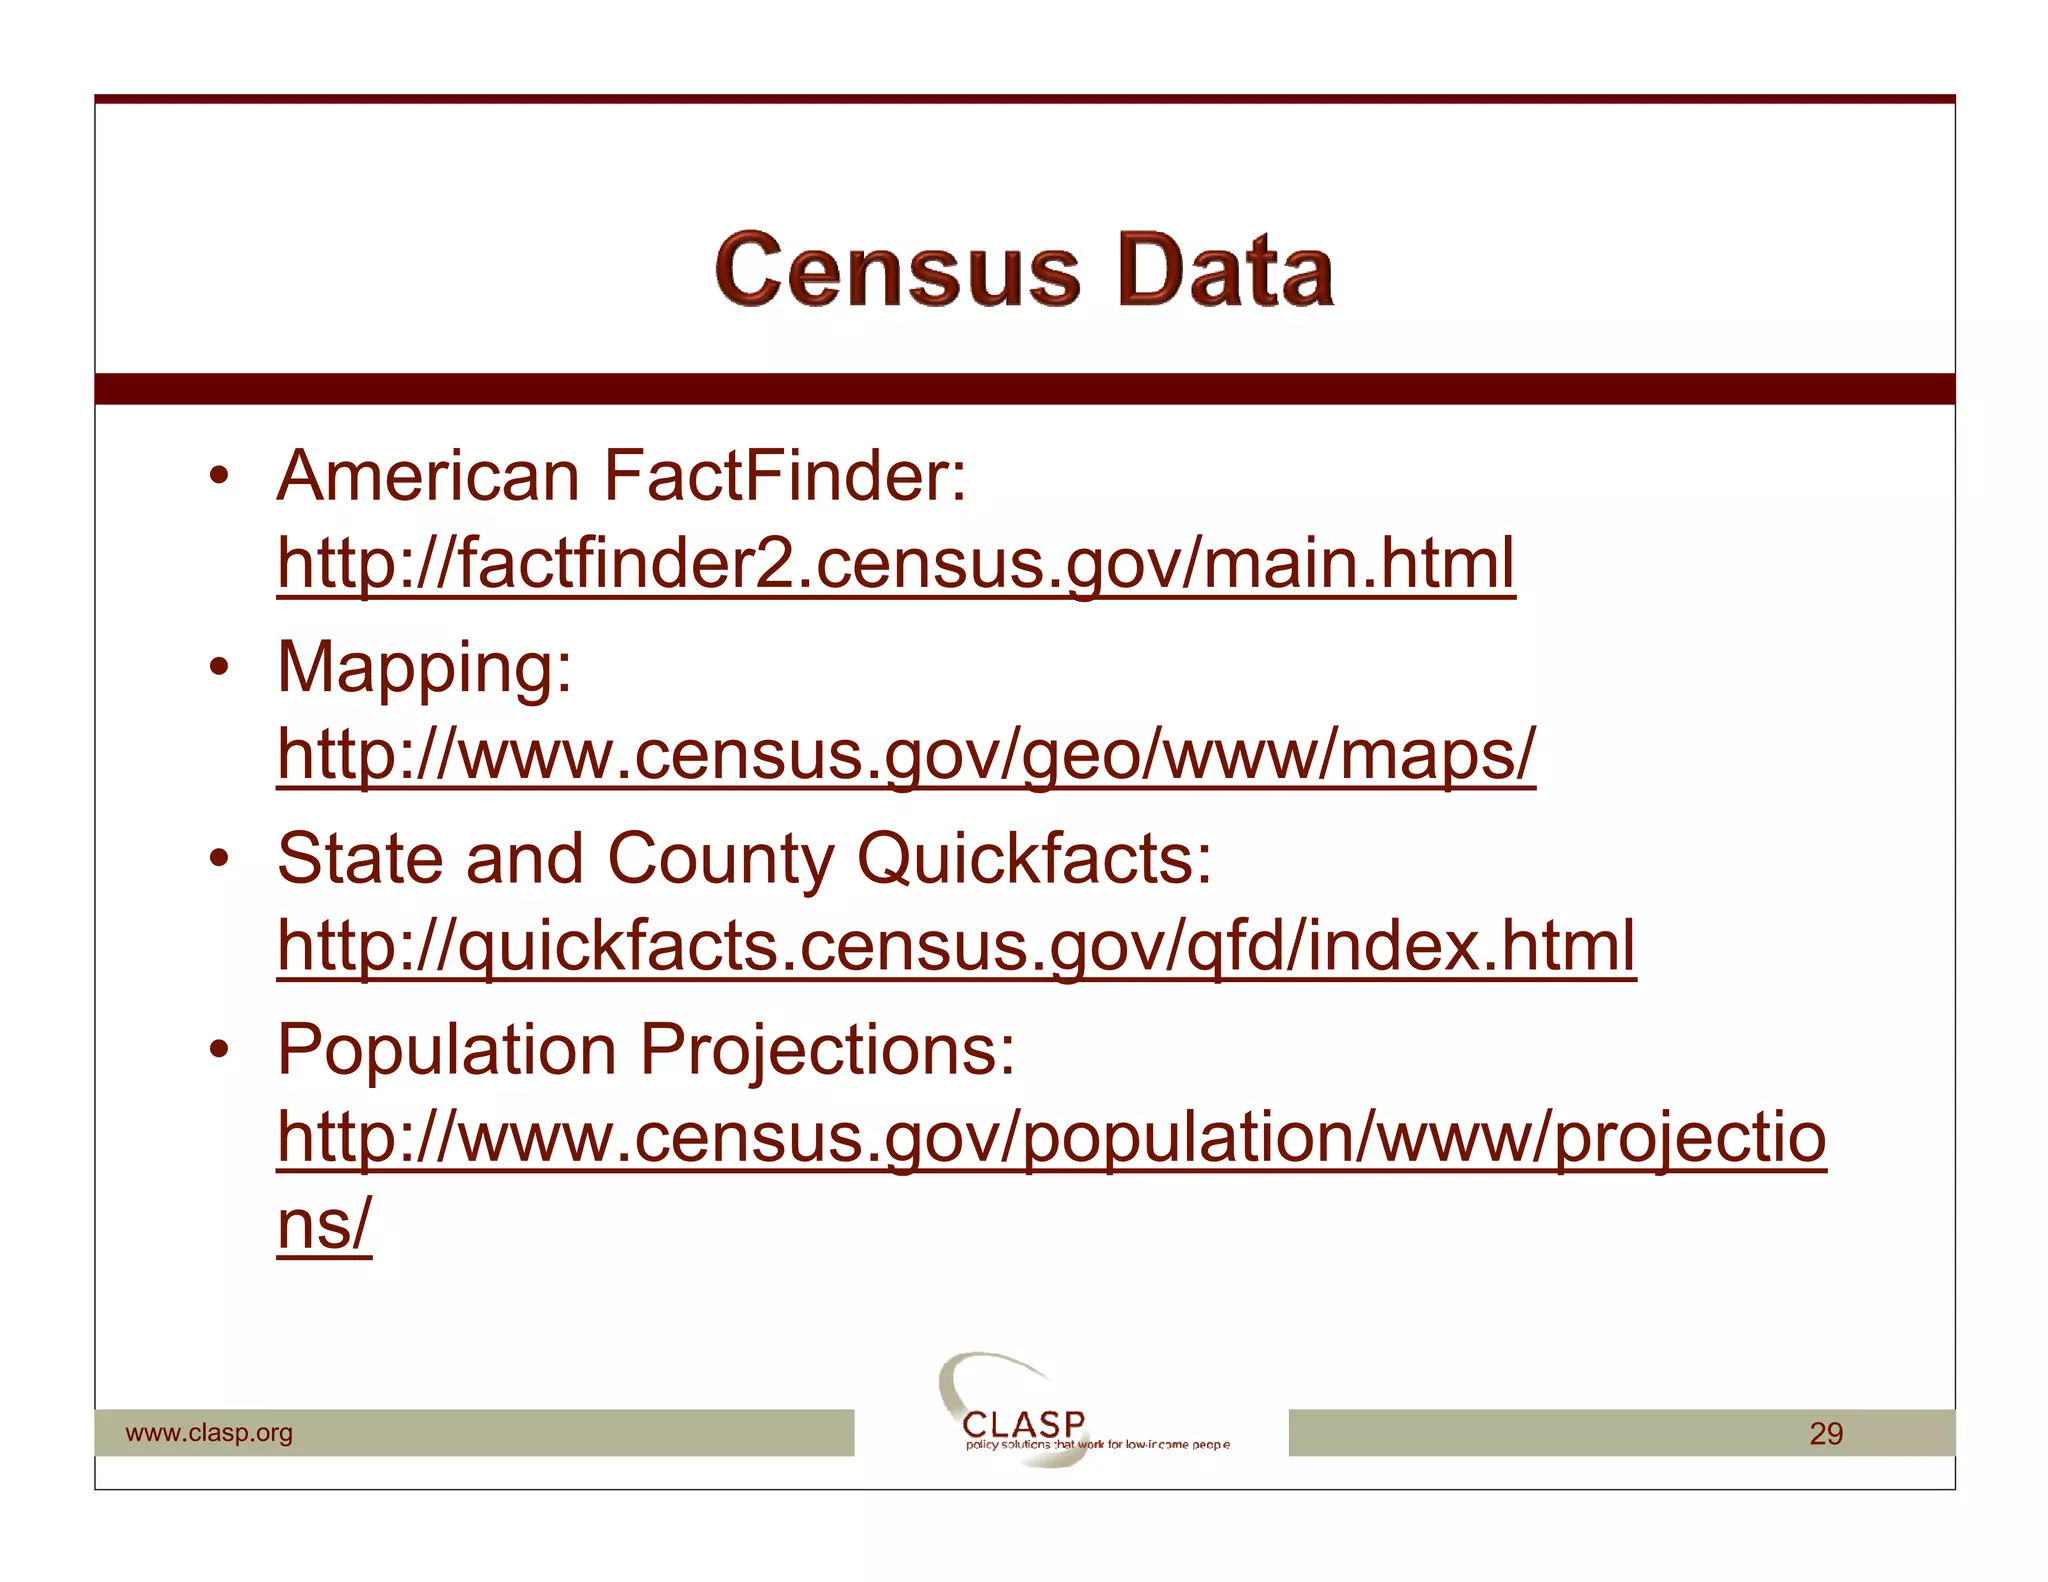


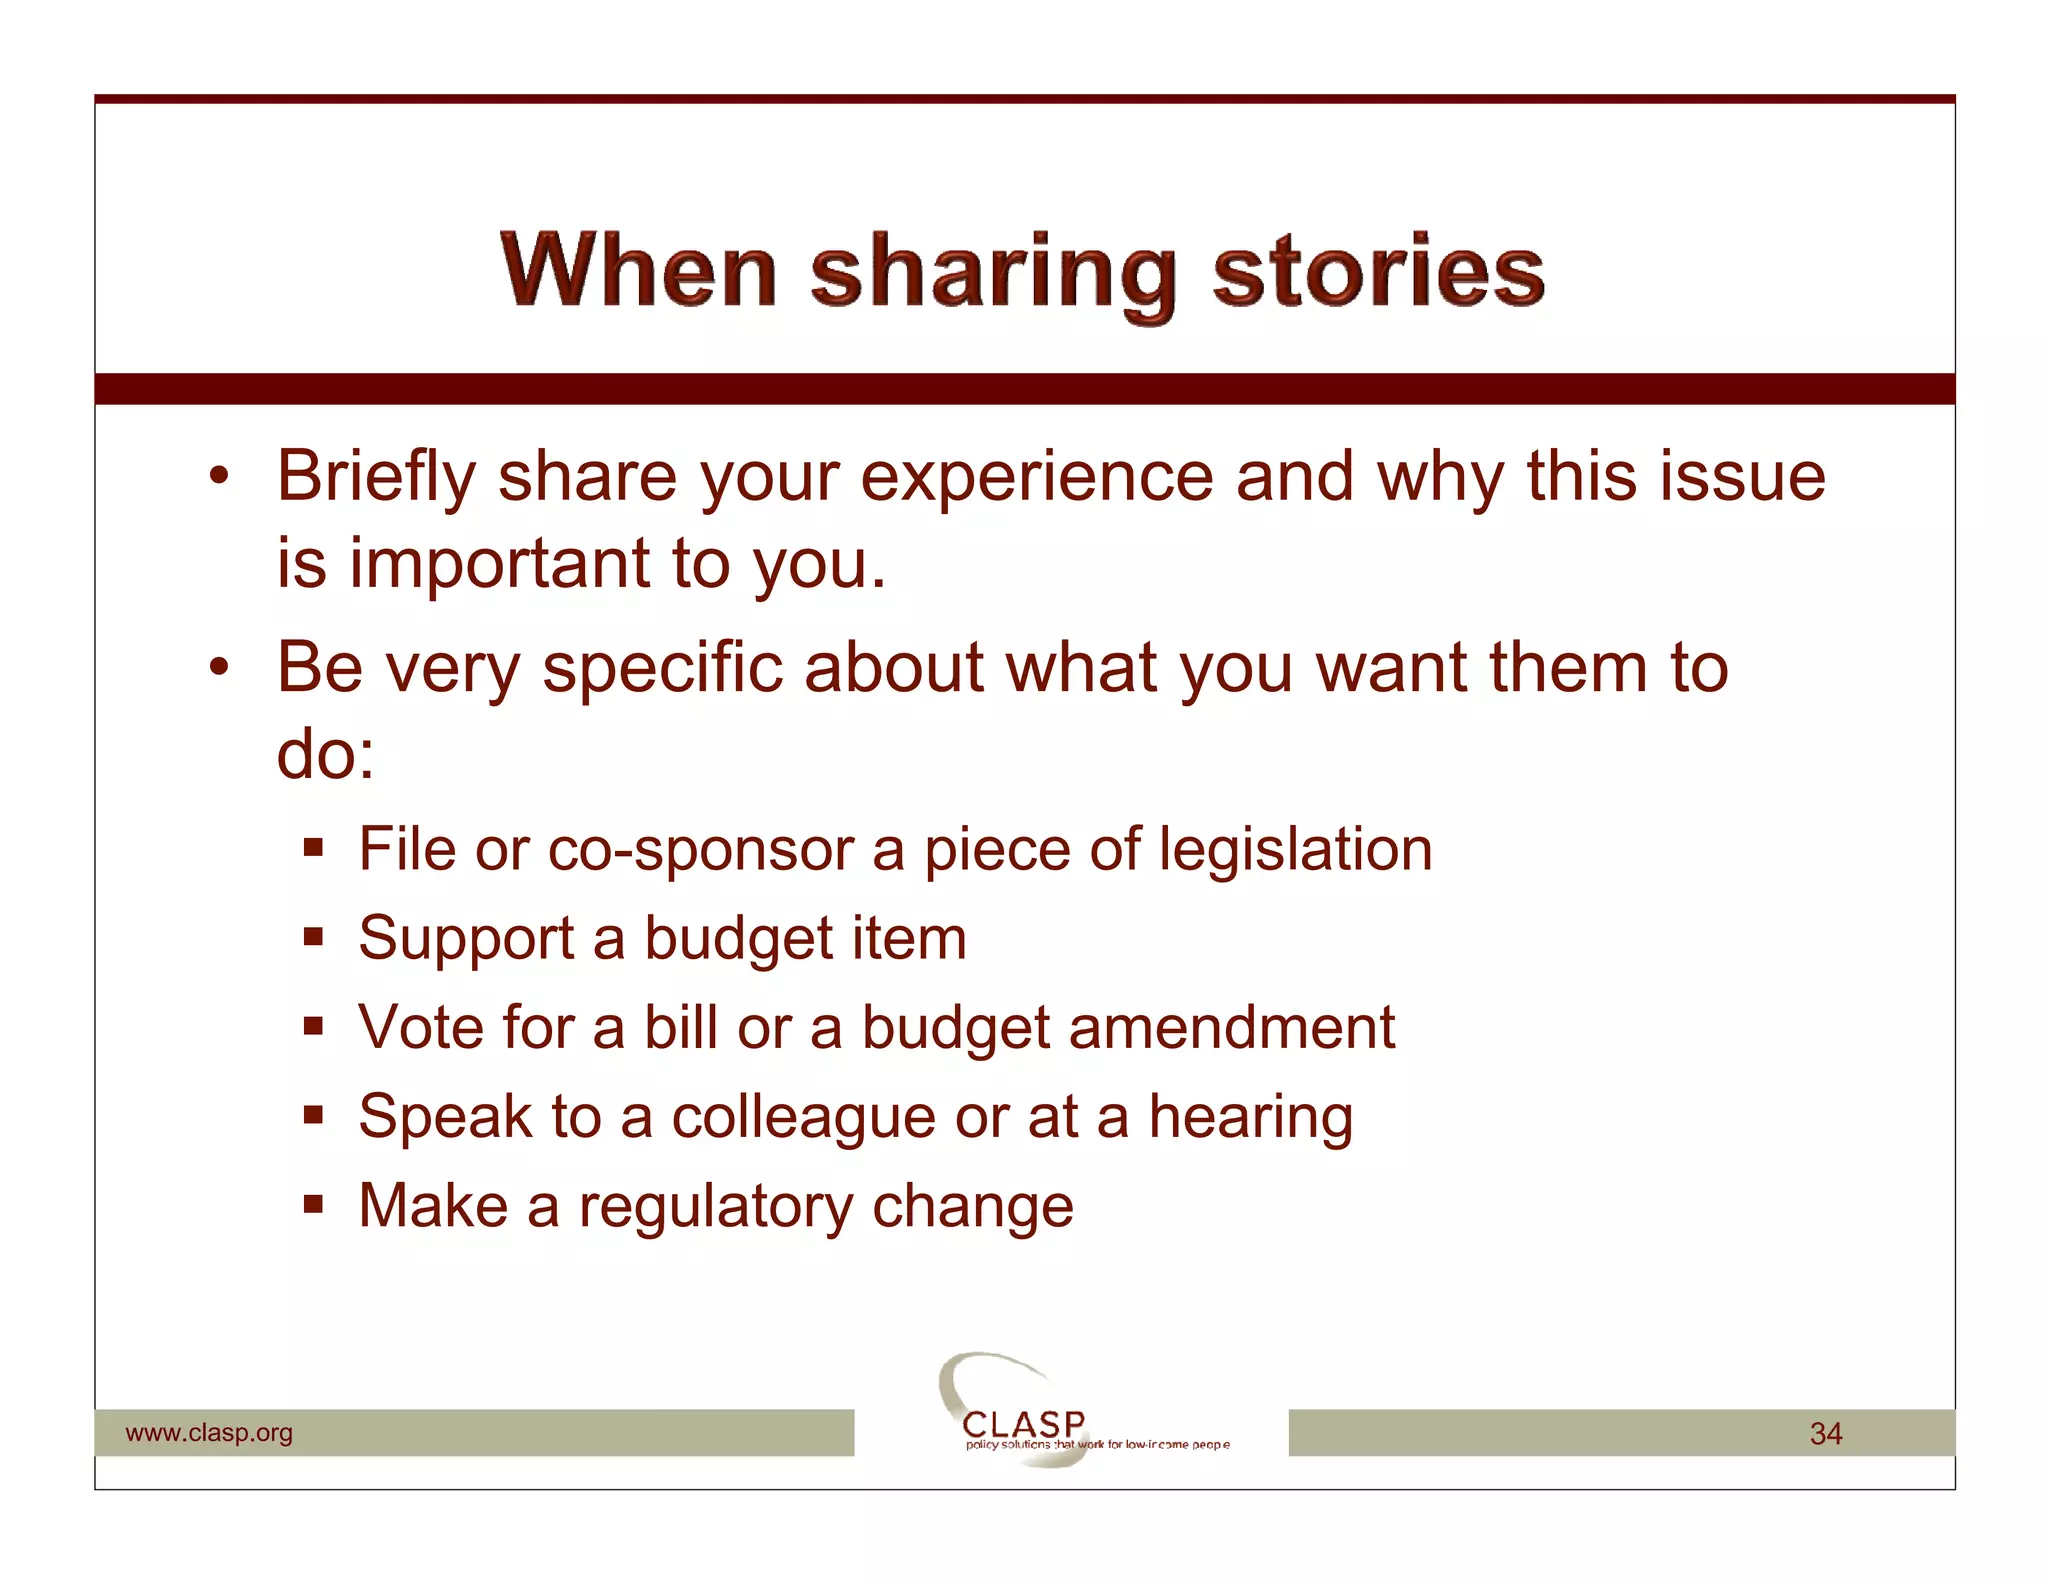
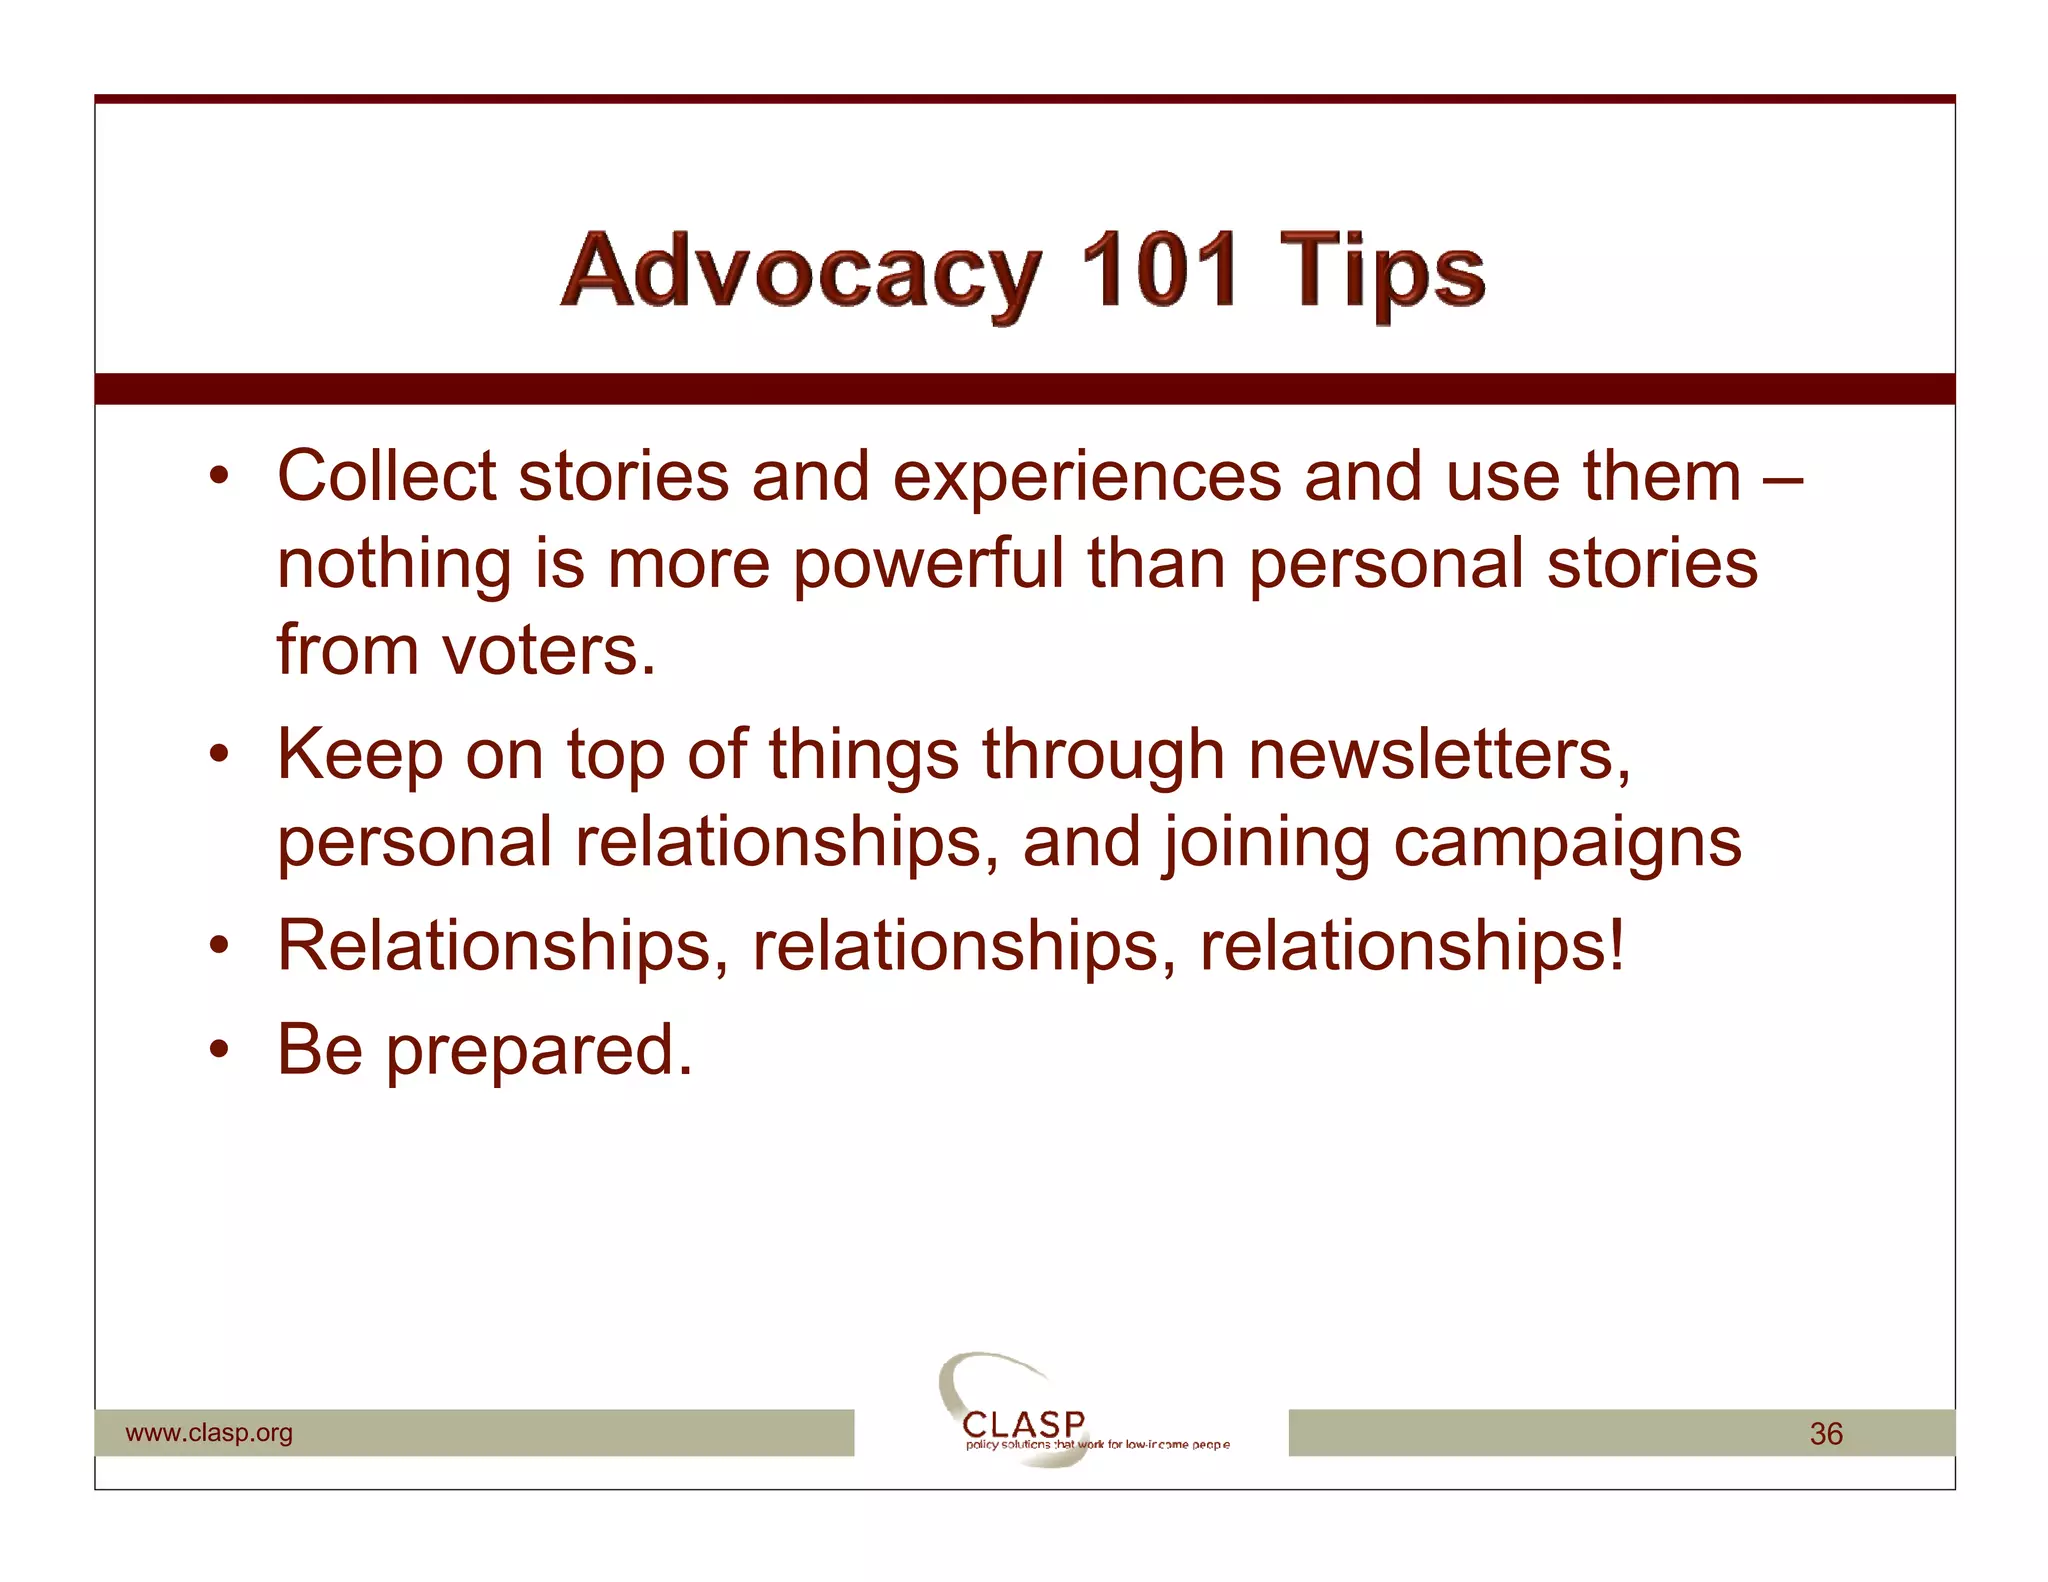
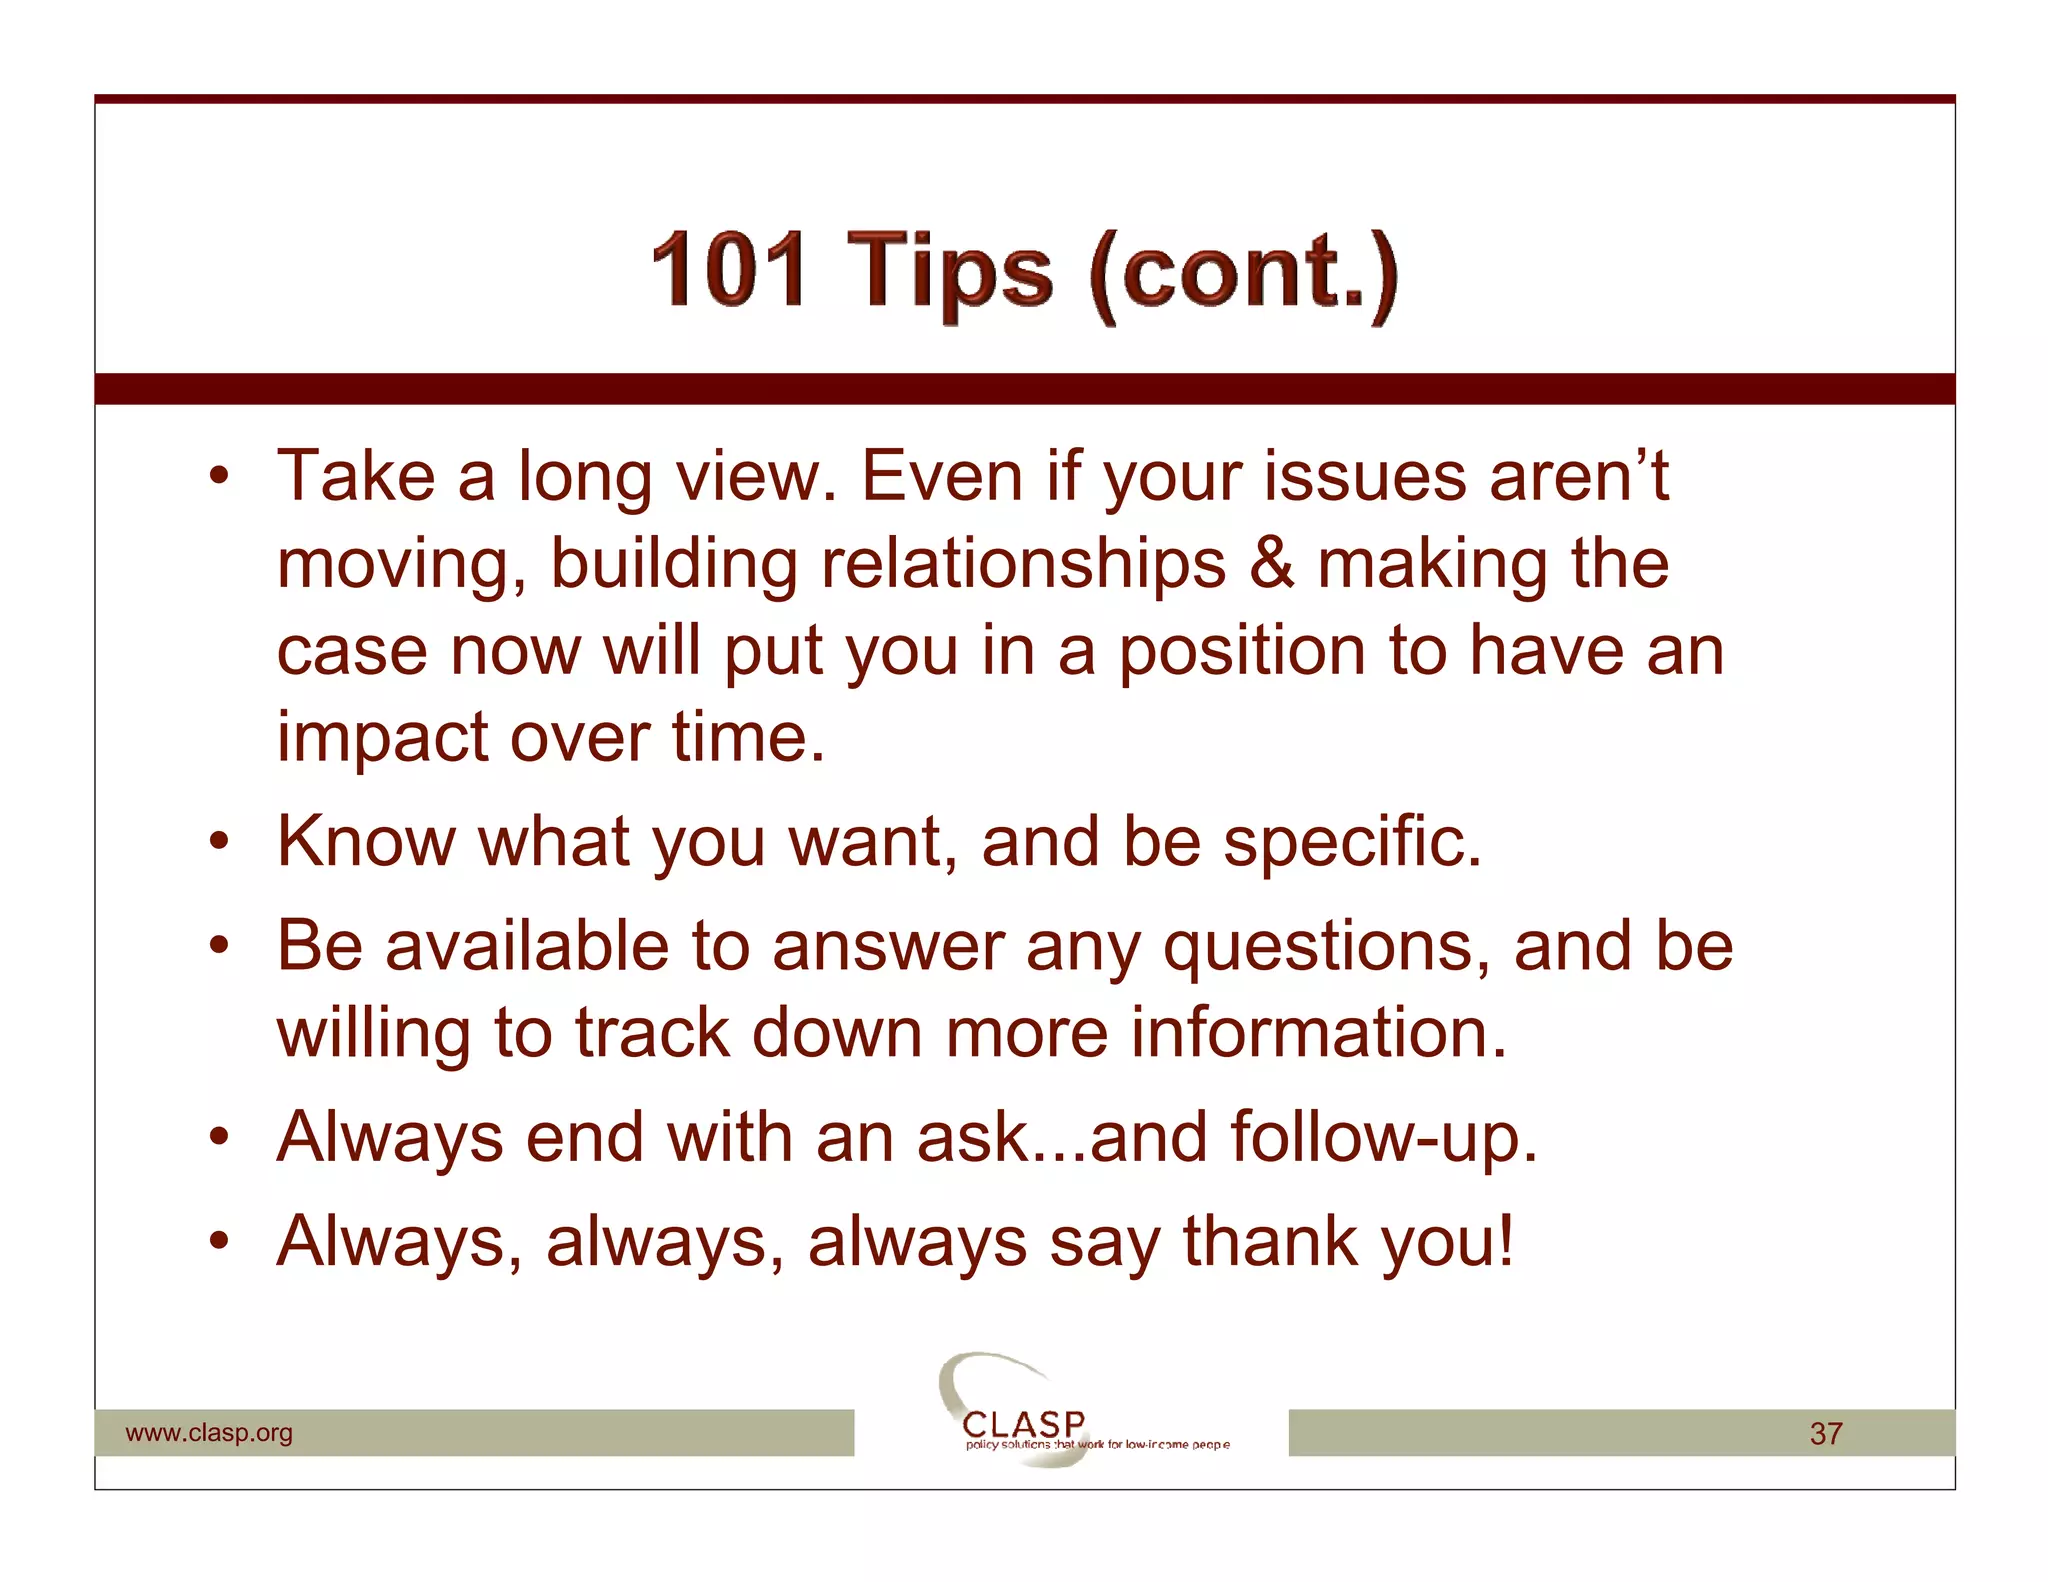


The document provides guidance on effective policy advocacy for children and families. It reviews establishing clear policy goals, targeting advocacy efforts, using data and personal stories to make a case, and tips for communication, relationship building, and strategy. Data is presented on the demographics of low-income children, programs serving young children, and websites to find additional state-specific data for advocacy efforts.


