More Related Content
Similar to Pointroll 2011: Online Video benchmarks chart
Similar to Pointroll 2011: Online Video benchmarks chart (20)
More from Brian Crotty (20)
Pointroll 2011: Online Video benchmarks chart
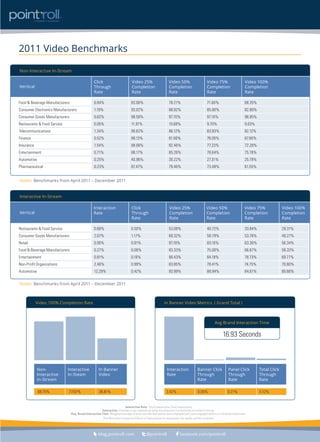
- 1. 2011 Video Benchmarks
Non-Interactive In-Stream
Click Video 25% Video 50% Video 75% Video 100%
Vertical Through Completion Completion Completion Completion
Rate Rate Rate Rate Rate
Food & Beverage Manufacturers 0.84% 83.08% 78.21% 71.60% 68.35%
Consumer Electronics Manufacturers 1.19% 93.02% 88.82% 85.80% 82.89%
Consumer Goods Manufacturers 0.62% 98.58% 97.70% 97.10% 96.85%
Restaurants & Food Service 0.05% 11.91% 10.68% 9.70% 9.03%
Telecommunications 1.34% 90.62% 86.12% 83.83% 82.12%
Finance 0.52% 88.13% 81.60% 76.05% 67.80%
Insurance 1.54% 88.08% 82.46% 77.23% 72.28%
Entertainment 0.71% 88.17% 85.26% 78.64% 75.78%
Automotive 0.25% 40.96% 30.22% 27.31% 25.79%
Pharmaceutical 0.23% 87.47% 79.46% 73.48% 61.55%
Notes: Benchmarks from April 2011 – December 2011
Interactive In-Stream
Interaction Click Video 25% Video 50% Video 75% Video 100%
Vertical Rate Through Completion Completion Completion Completion
Rate Rate Rate Rate Rate
Restaurants & Food Service 0.66% 0.50% 53.08% 40.72% 33.84% 29.31%
Consumer Goods Manufacturers 2.07% 1.17% 69.32% 58.79% 53.78% 48.27%
Retail 0.95% 0.81% 97.18% 83.10% 63.38% 56.34%
Food & Beverage Manufacturers 0.27% 0.08% 83.33% 75.00% 66.67% 58.33%
Entertainment 0.81% 0.16% 90.43% 84.18% 78.73% 69.77%
Non-Profit Organizations 2.46% 0.99% 83.85% 78.41% 74.75% 70.80%
Automotive 12.29% 0.42% 93.99% 88.94% 84.61% 80.66%
Notes: Benchmarks from April 2011 – December 2011
Video 100% Completion Rate In Banner Video Metrics ( Grand Total )
Avg Brand Interaction Time
16.93 Seconds
Non- Interactive In Banner Interaction Banner Click Panel Click Total Click
Interactive In-Steam Video Rate Through Through Through
In-Stream Rate Rate Rate
68.75% 77.67% 38.81% 3.42% 0.05% 0.21% 0.12%
Interaction Rate: Total Interactions/Total Impressions
Interaction: Anytime a user expands an ad by mousing over it or performs an action in the ad.
Avg. Brand Interaction Time: Weighted average of total seconds that panels were displayed and users engaged within an individual impression.
PointRoll data is based on billions of impressions for mouseover rich media, polites excluded.
blog.pointroll.com @pointroll facebook.com/pointroll