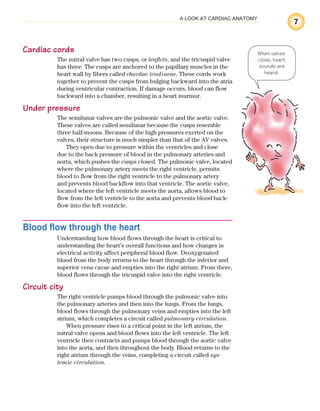
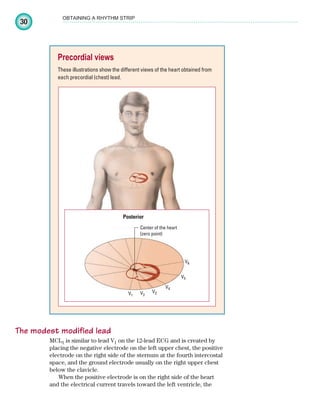
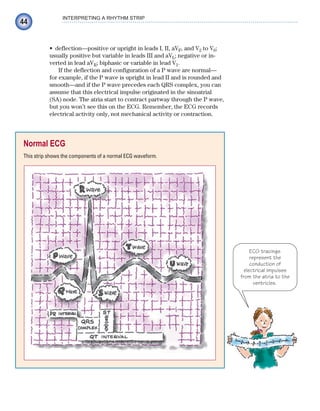
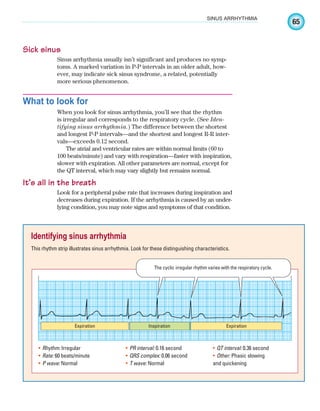
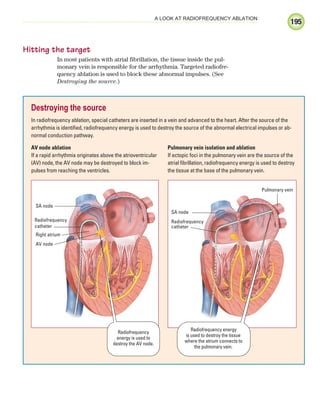
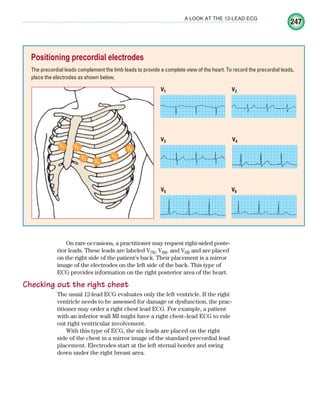
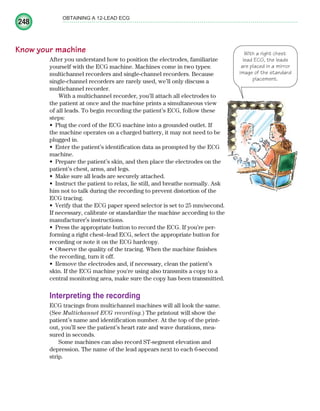
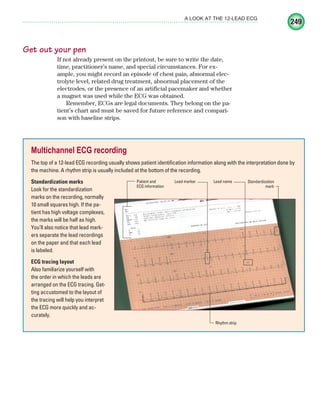
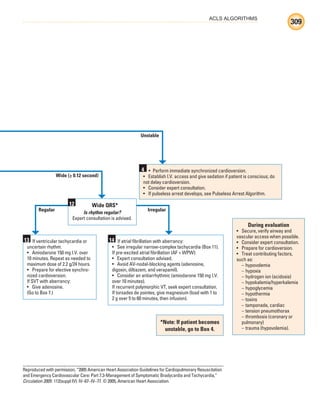
The document discusses cardiac anatomy, describing the location of the heart in the chest, its layers including the epicardium, myocardium, and endocardium, and the structures that surround and protect it like the pericardium. It also explains the flow of blood through the heart, noting the heart's chambers and valves, and gives an overview of the cardiac cycle and conduction system that generates heartbeats.


![Staff
Publisher
Chris Burghardt
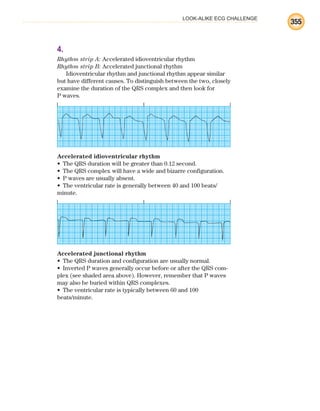
Clinical Director
Joan M. Robinson, RN, MSN
Clinical Project Manager
Jennifer Meyering, RN, BSN, MS
Product Director
David Moreau
Product Manager
Jennifer K. Forestieri
Editor
Tracy S. Diehl
Art Director
Elaine Kasmer
Illustrator
Bot Roda
Design Assistant
Kate Zulak
Vendor Manager
Beth Martz
Associate Manufacturing Manager
Beth J. Welsh
Editorial Assistants
Karen J. Kirk, Jeri O’Shea, Linda K. Ruhf
The clinical treatments described and recommended
in this publication are based on research and consulta-
tion with nursing, medical, and legal authorities. To the
best of our knowledge, these procedures reflect cur-
rently accepted practice. Nevertheless, they can’t be
considered absolute and universal recommendations.
For individual applications, all recommendations must
be considered in light of the patient’s clinical condition
and, before administration of new or infrequently used
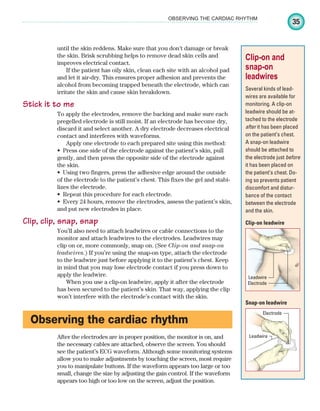
drugs, in light of the latest package-insert information.
The authors and publisher disclaim any responsibility
for any adverse effects resulting from the suggested
procedures, from any undetected errors, or from the
reader’s misunderstanding of the text.
© 2011 by Lippincott Williams & Wilkins. All rights
reserved. This book is protected by copyright. No part
of it may be reproduced, stored in a retrieval system, or
transmitted, in any form or by any means—electronic,
mechanical, photocopy, recording, or otherwise—
without prior written permission of the publisher, except
for brief quotations embodied in critical articles and
reviews and testing and evaluation materials provided by
publisher to instructors whose schools have adopted its
accompanying textbook. Printed in China. For informa-
tion, write Lippincott Williams & Wilkins, 323 Norristown
Road, Suite 200, Ambler, PA 19002-2756.
ECGIE5E11010
Library of Congress Cataloging-in-Publication Data
ECG interpretation made incredibly easy!. —
5th ed.
p. ; cm.
Includes bibliographical references and index.
ISBN 978-1-60831-289-4 (pbk. : alk. paper)
1. Electrocardiography. 2. Heart—Diseases—
Nursing. I. Lippincott Williams & Wilkins.
[DNLM: 1. Electrocardiography—Nurses’
Instruction. 2. Arrhythmias, Cardiac—Nurses’
Instruction. WG 140 E172 2011]
RC683.5.E5E256 2011
616.1’207547—dc22
ISBN-13: 978-1-60831-289-4 (alk. paper)
ISBN-10: 1-60831-289-5 (alk. paper) 2010022956
iv
ECG_FM.indd iv
ECG_FM.indd iv 7/8/2010 12:48:24 PM
7/8/2010 12:48:24 PM](https://image.slidesharecdn.com/ekginterpretationmadeincrediblyeasycoll-221214201734-32685674/85/ahas-6-320.jpg)


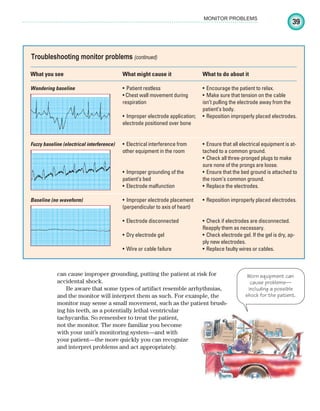
![34
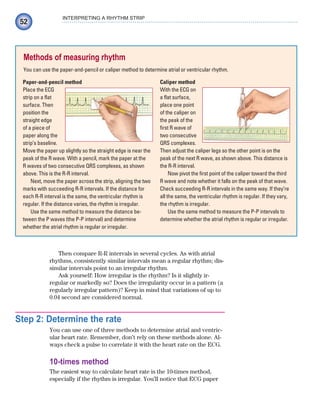
OBTAINING A RHYTHM STRIP
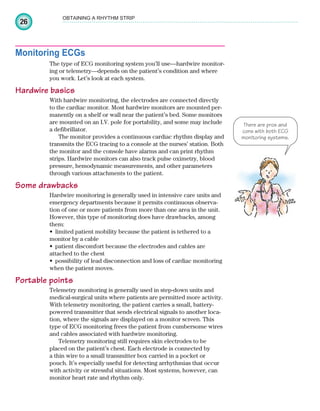
soft tissues or close to bone, not over bony prominences, thick
muscles, or skin folds. Those areas can produce ECG artifacts—
waveforms not produced by the heart’s electrical activity.
Prepare the skin
Next, prepare the patient’s skin. To begin, wash the patient’s chest
with soap and water and then dry it thoroughly. Because hair
may interfere with electrical contact, clip dense hair with clippers
or scissors. Then use the special rough patch on the back of the
electrode, a dry washcloth, or a gauze pad to briskly rub each site
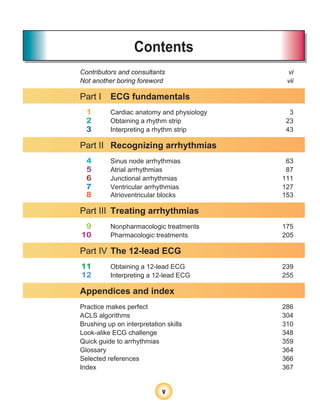
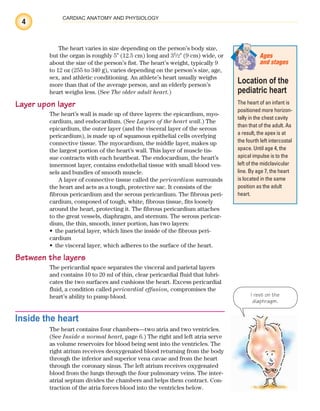
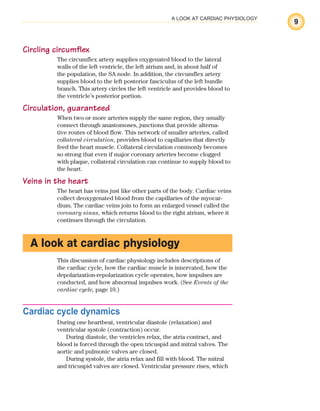
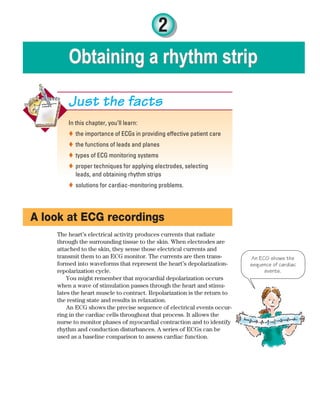
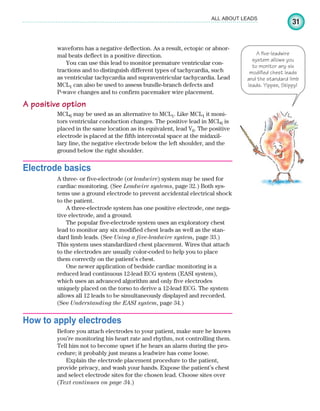
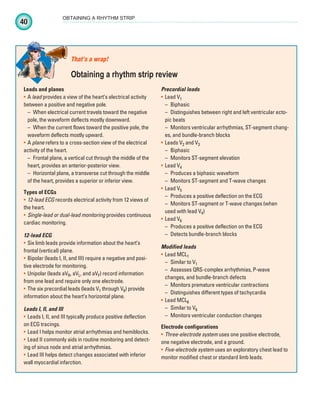
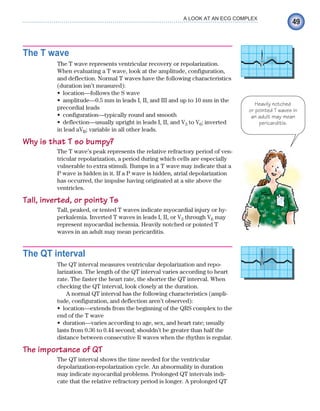
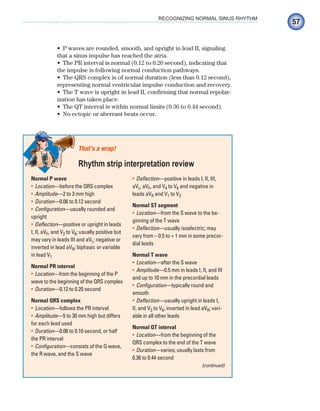
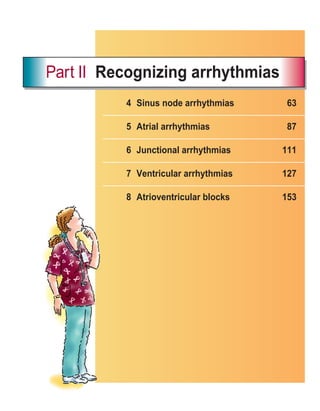
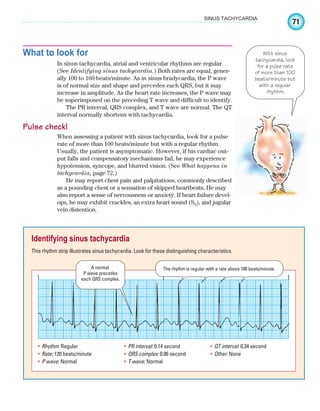
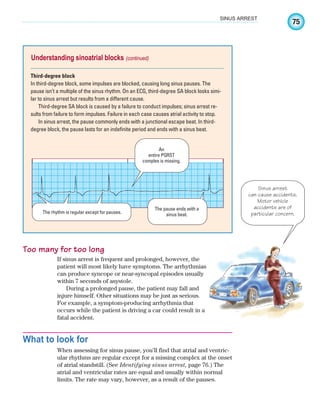
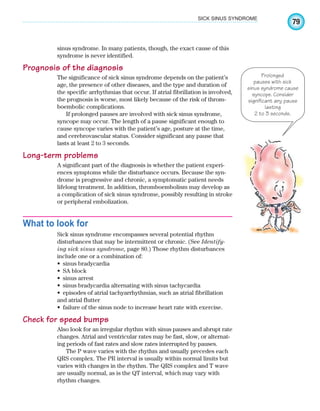
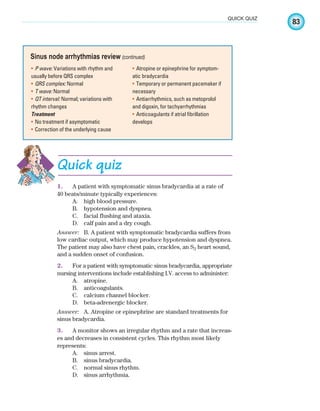
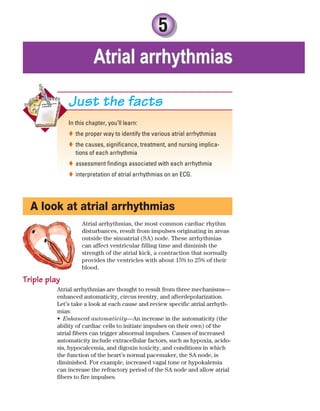
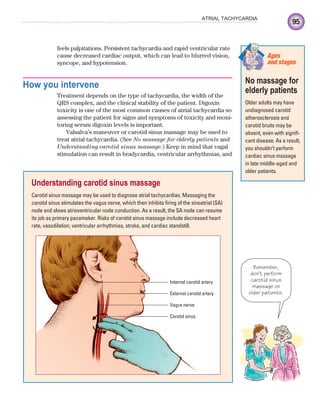
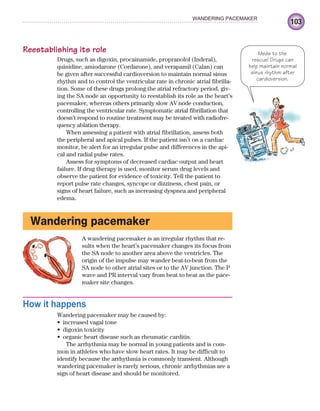
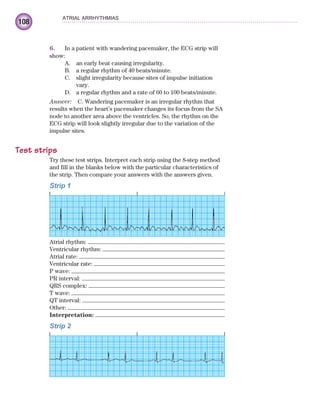
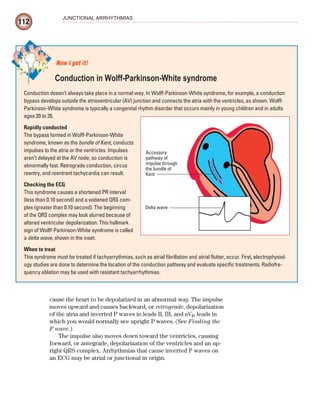
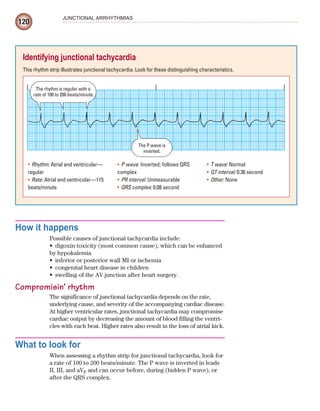
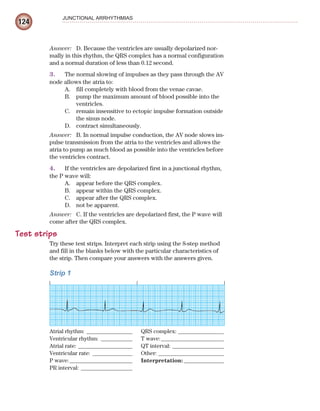
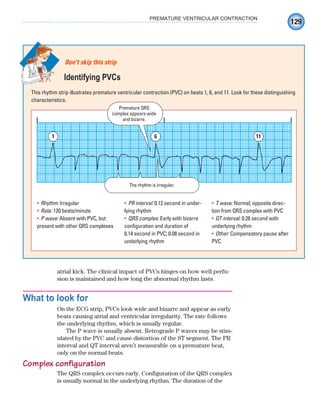
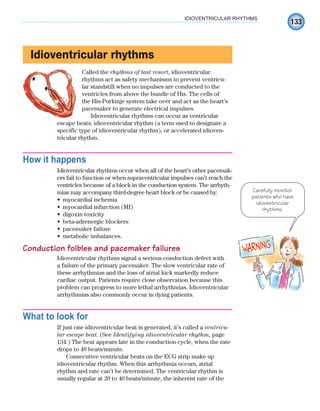
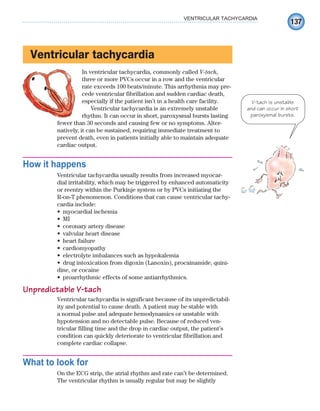
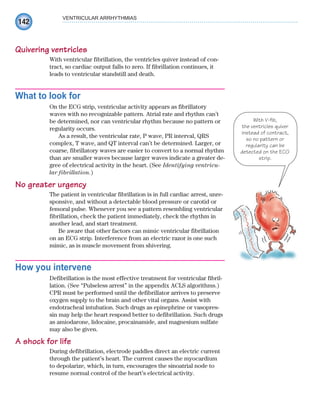
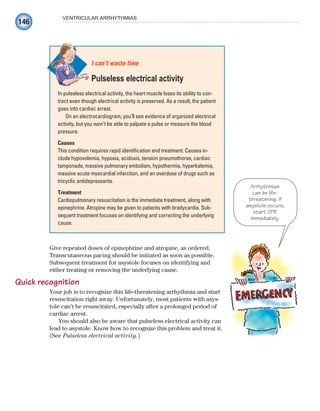
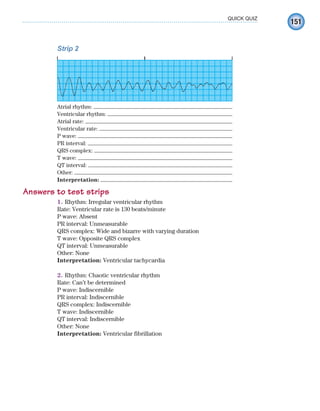
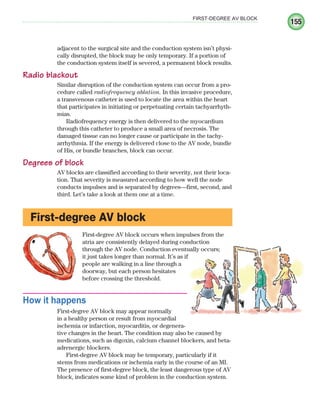
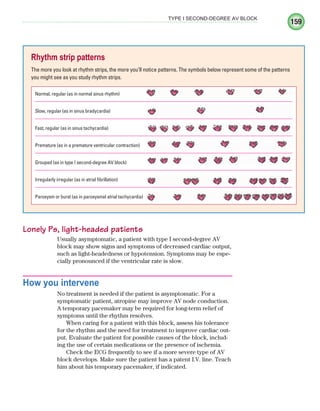
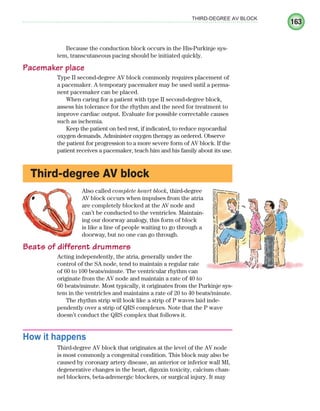
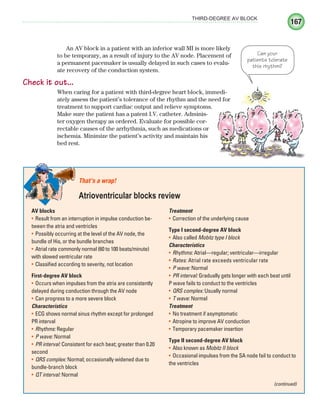
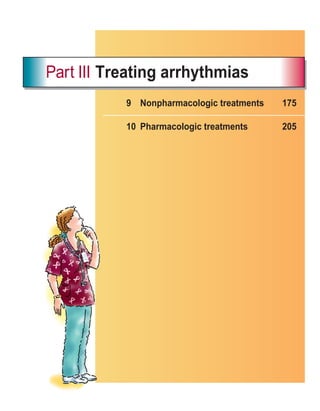
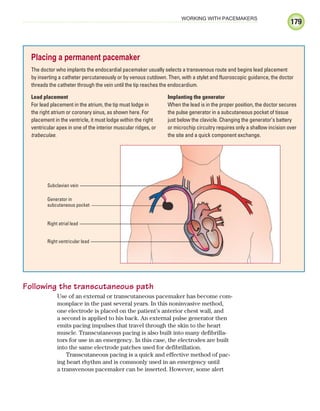
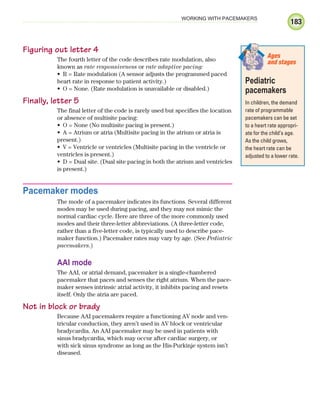
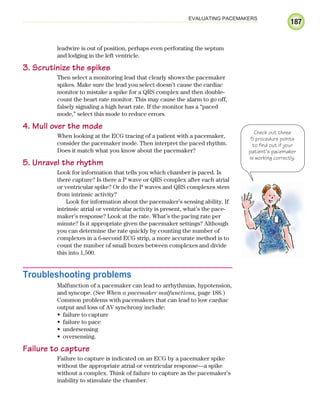
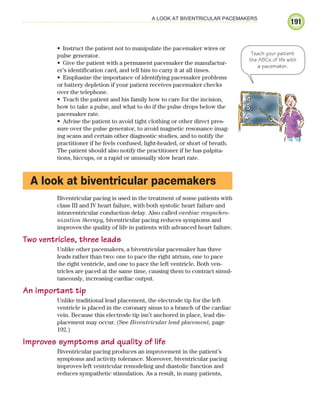
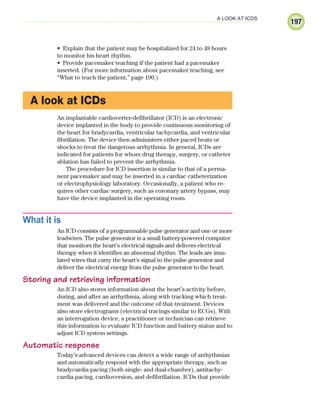
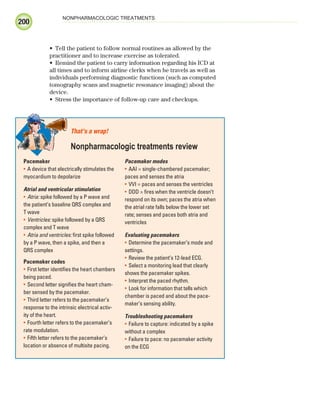
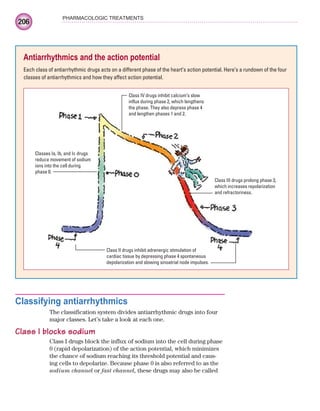
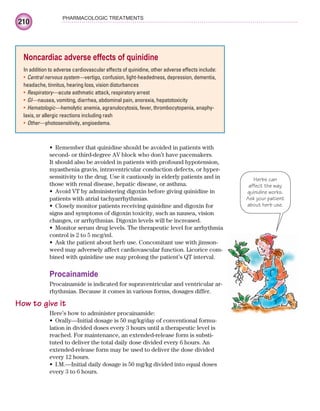
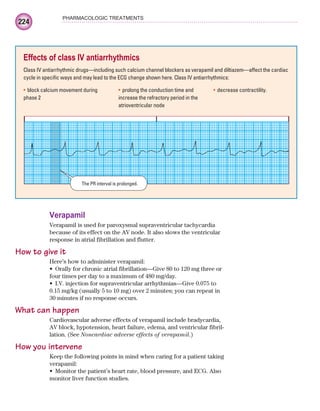
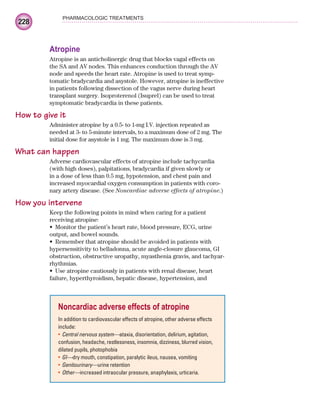
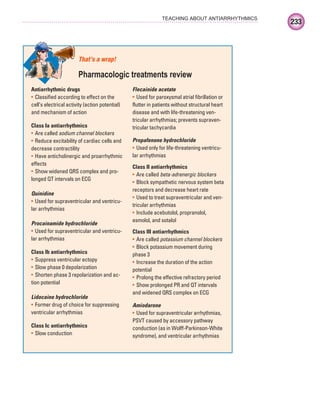
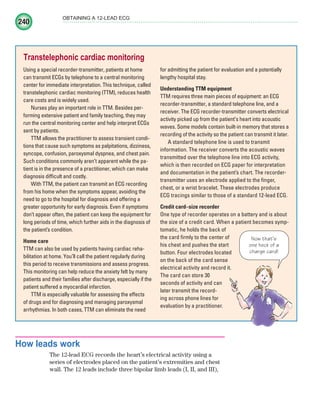
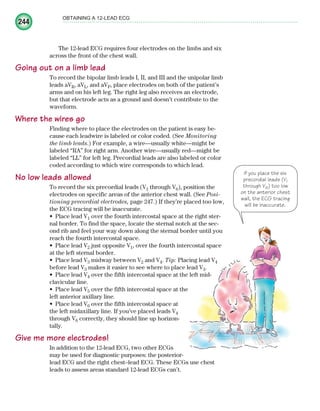
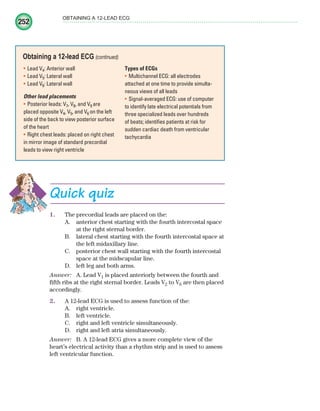
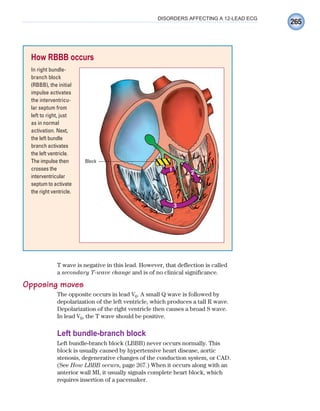
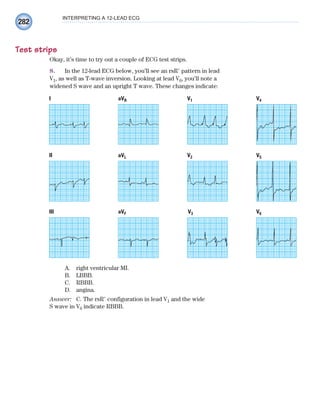
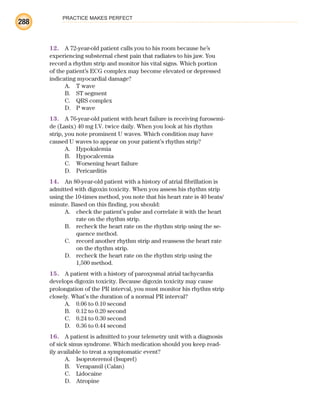
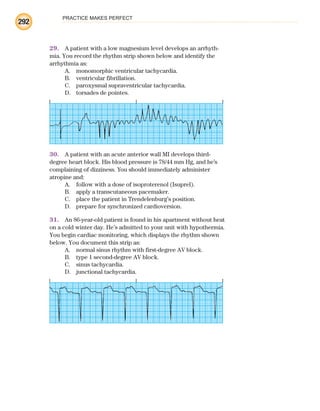
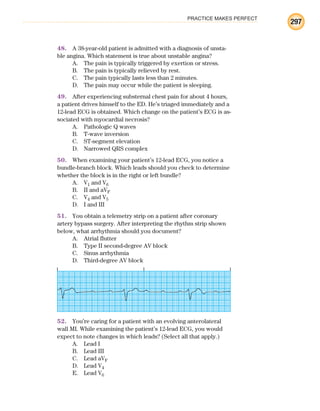
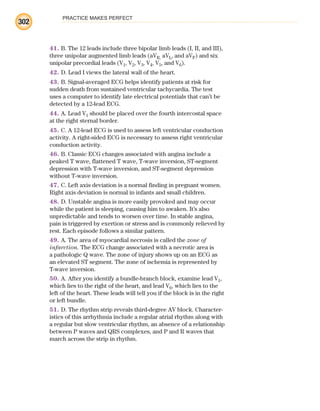
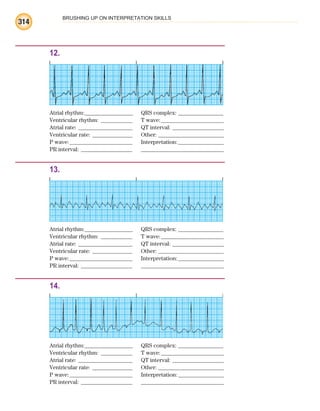
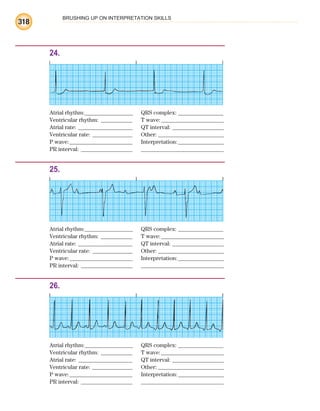
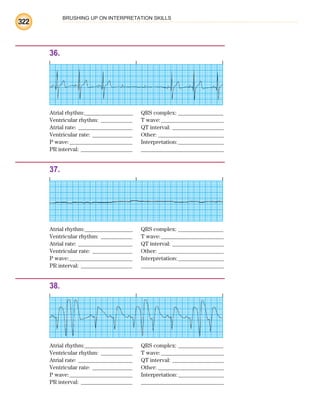
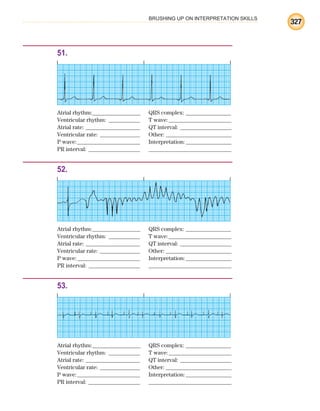
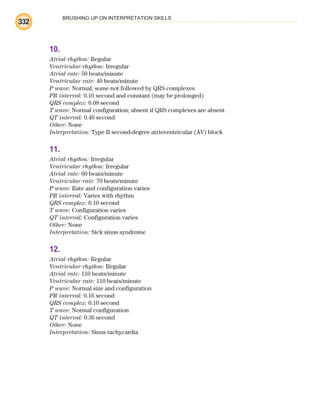
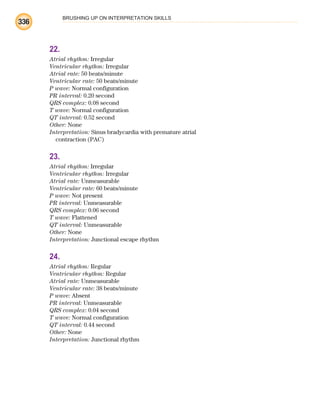
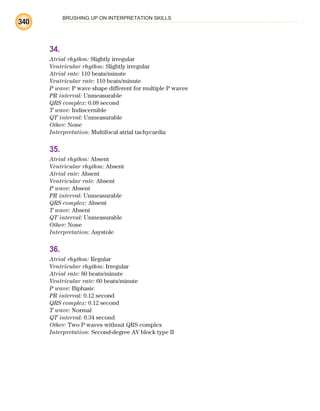
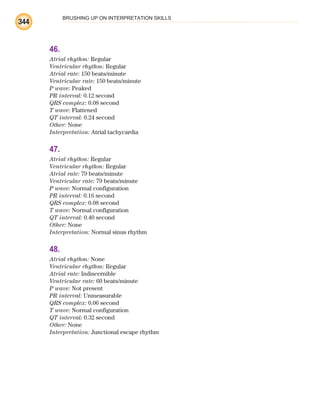
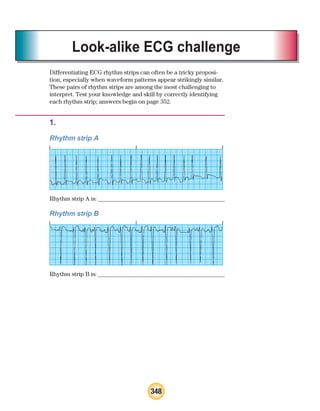
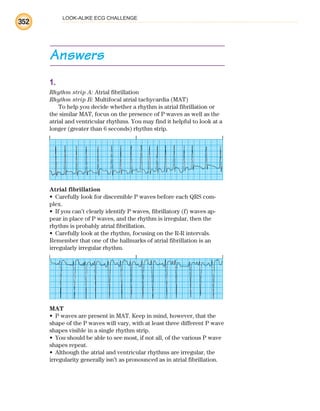
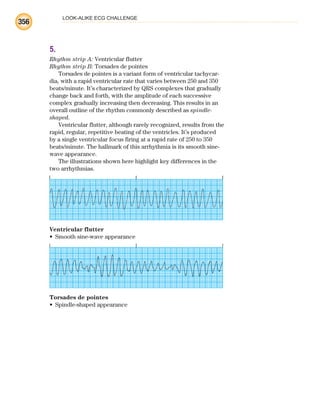
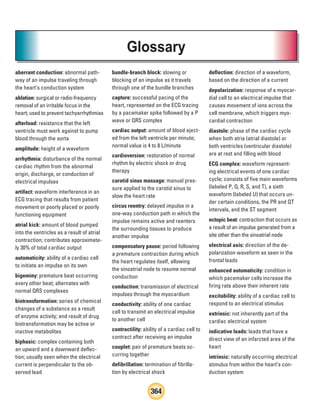
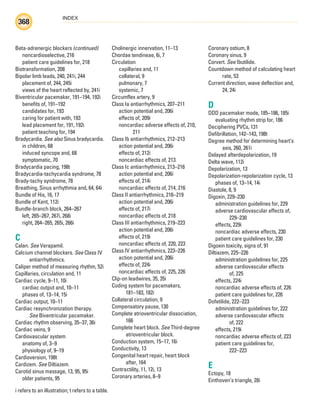
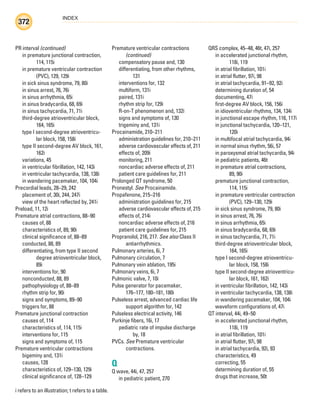
Understanding the EASI system
The five-lead EASI (reduced lead continuous 12-lead electrocardiogram [ECG]) configu-
ration gives a three-dimensional view of the electrical activity of the heart from the fron-
tal, horizontal, and sagittal planes. This provides 12 leads of information. A mathematical
calculation in the electronics of the monitoring system is applied to the information,
creating a derived 12-lead ECG.
Placement of the electrodes for the EASI system includes:
E lead:
• lower part of the sternum atthe level of the fifth intercostal space
A lead:
• left midaxillary line at the level of the fifth intercostal space
S lead:
• upperpart of the sternum
I lead:
• right midaxillary line at the level of the fifth intercostal space
Ground:
• anywhere on the torso.
E
A
S
Ground
I
Memory
jogger
To help
you re-
member where to
place electrodes
in a five-electrode
configuration, think
of the phrase “White
to the upper right.”
Then think of snow
over trees (white
electrode above
green electrode) and
smoke over fire (black
electrode above red
electrode). And of
course, chocolate
(brown electrode) lies
close to the heart.
White Black
Green Red
Brown
ECG_Chap02.indd 34
ECG_Chap02.indd 34 7/8/2010 4:16:57 PM
7/8/2010 4:16:57 PM](https://image.slidesharecdn.com/ekginterpretationmadeincrediblyeasycoll-221214201734-32685674/85/ahas-44-320.jpg)

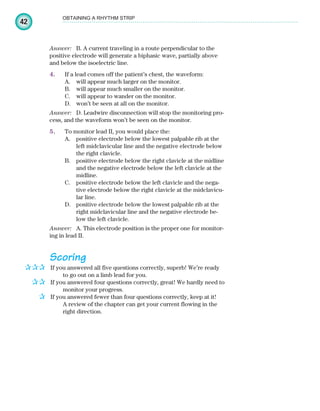


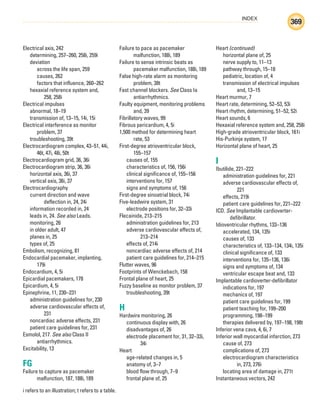
![140
VENTRICULAR ARRHYTHMIAS
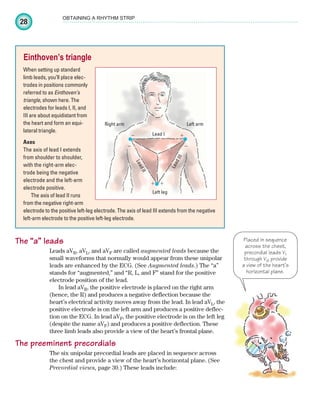
collapse. Most patients with ventricular tachycardia have weak or
absent pulses. Low cardiac output will cause hypotension and a
decreased level of consciousness (LOC) leading to unresponsive-
ness. Ventricular tachycardia may precipitate angina, heart failure,
or a substantial decrease in organ perfusion.
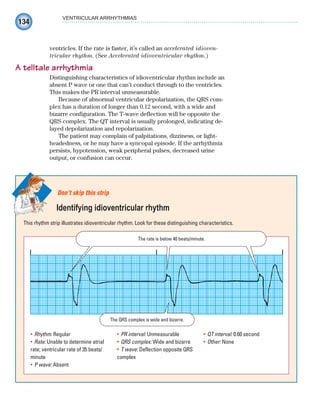
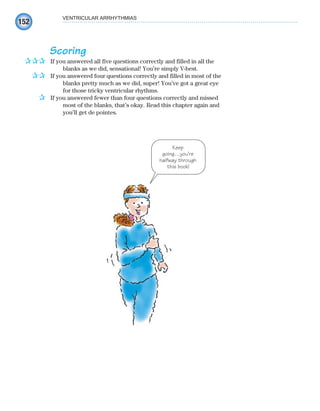
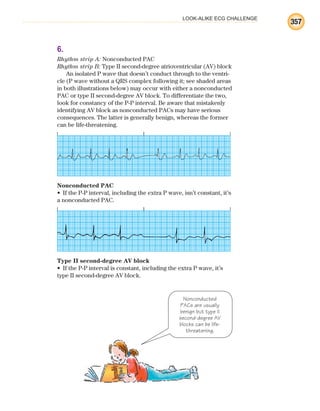
How you intervene
Treatment depends on whether the patient’s pulse is detectable
or undetectable. A patient with pulseless ventricular tachycardia
receives the same treatment as one with ventricular fibrillation
and requires immediate defibrillation and CPR. Treatment for the
patient with a detectable pulse depends on whether his condition
is stable or unstable and has monomorphic or polymorphic QRS
complexes.
Unstable patients generally have heart rates greater than 150
beats/minute. They may also have hypotension, shortness of
breath, an altered LOC, heart failure, angina, or MI—conditions
that indicate cardiac decompensation. These patients are treated
immediately with direct-current synchronized cardioversion.
Typical tachycardia complex
A hemodynamically stable patient with monomorphic ven-
tricular tachycardia is treated differently. First, administer
amiodarone following advanced cardiac life support (ACLS)
protocols to correct the rhythm disturbance. If the drug doesn’t
correct the disturbance, prepare the patient for synchronized
cardioversion.
If the patient has polymorphic ventricular tachycardia with
a normal QT interval, correct ischemia and electrolyte imbal-
ances. Then adminster beta-adrenergic blockers, lidocaine,
amiodarone, or procainamide following ACLS protocol. Again,
if drug therapy is unsuccessful, synchronized cardioversion is
performed.
Correct electrolyte abnormalities in the patient with polymor-
phic ventricular tachycardia with a prolonged QT interval and ad-
minister magnesium I.V. If the rhythm persists, prepare the patient
for overdrive pacing.
Patients with chronic, recurrent episodes of ventricular tachy-
cardia who are unresponsive to drug therapy may have a cardio-
verter-defibrillator implanted. This device is a more permanent
solution to recurrent episodes of ventricular tachycardia. (For
more information about the implantable cardioverter-defibrillator
[ICD], see chapter 9.)
Treatment for the
patient in
V-tach depends on
whether his pulse
is detectable or
undetectable.
ECG_Chap07.indd 140
ECG_Chap07.indd 140 7/7/2010 5:59:15 PM
7/7/2010 5:59:15 PM](https://image.slidesharecdn.com/ekginterpretationmadeincrediblyeasycoll-221214201734-32685674/85/ahas-150-320.jpg)


![Chapter_36 dysrhythmias [Autosaved].pptx](https://cdn.slidesharecdn.com/ss_thumbnails/chapter36dysrhythmiasautosaved-230320142932-f5b95288-thumbnail.jpg?width=640&height=640&fit=bounds)