Download to read offline


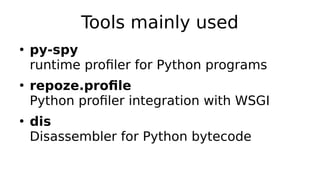
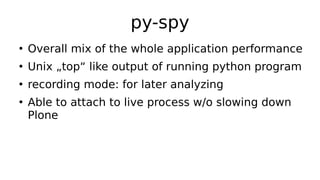
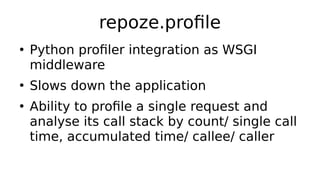
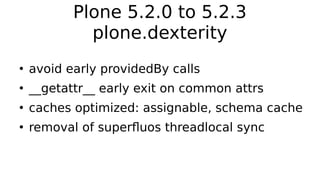
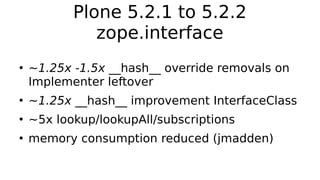

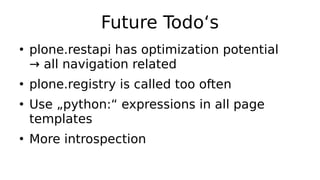

The document discusses performance profiling tools for Python applications, highlighting tools such as py-spy and repoze.profile for analyzing performance issues. It details improvements made in Plone versions 5.2.1 to 5.2.3, including optimizations in caching and memory consumption. Future considerations include optimizing plone.restapi and reducing unnecessary calls to plone.registry.


![谷歌留痕技术教程[ 𝙩𝙤𝙥 𝟮𝟯𝟯. 𝙘 𝙤𝙢 ]](https://cdn.slidesharecdn.com/ss_thumbnails/top233-260130173900-2eb784f9-thumbnail.jpg?width=640&height=640&fit=bounds)


![20260201 [FOSDEM] gomodjail - library sandboxing for Go modules.pdf](https://cdn.slidesharecdn.com/ss_thumbnails/20260201fosdemgomodjail-librarysandboxingforgomodules-260201225659-76609ec4-thumbnail.jpg?width=640&height=640&fit=bounds)


