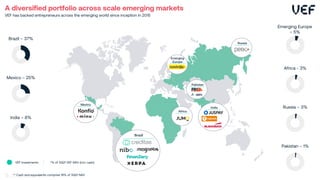
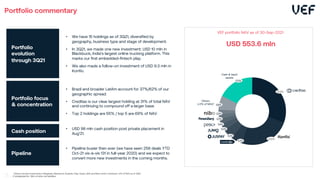
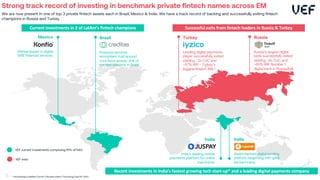
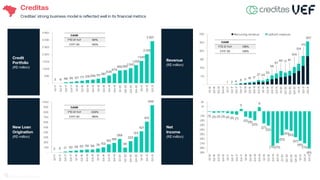
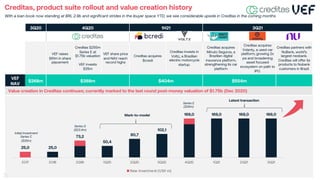
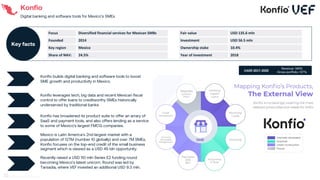
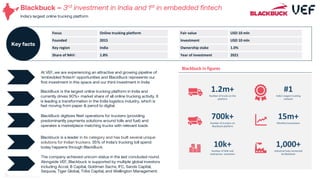
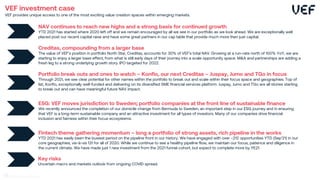
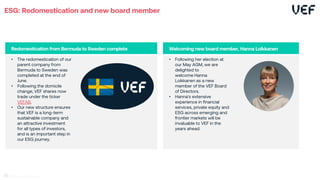
SlideShare a Scribd company logo
Investor Presentation
3Q 2021
The emerging market fintech investor
ESG: Key governance milestones - redomestication to Sweden complete, Board strenghtened
Our recent AGM delivered some key decisions and changes to the VEF story, which continue our positive ESG drive. First, the decision to move our holding
company to Sweden, where we are listed, from Bermuda, was ratified and the process was successfully completed in early July. Coupled with this, we are
very excited to welcome new board member Hanna Loikkanen to the VEF board and family.
Recent highlights
Portfolio holdings in focus - Juspay, Jumo and TGo
Beyond the current big 2 (Creditas and Konfio), we continue to gain confidence in these 3 holdings, which sit in the top half (size-wise) of our portfolio, are
delivering strong underlying trends and are well placed to secure additional capital to drive future growth , as proven by TGo’s recent $50mn Series C.
Konfio raised USD 235 mln Series E in 2 instalments in 2021
Through June and September, Konfio raised a total of $235mln, as it looks to achieve its goal of becoming Mexico’s number 1 digital bank for SMEs though
organic and inorganic means. VEF invested an additional ~$29mln as part of the raise.
Creditas – M&A and partnerships providing a fresh leg of growth
2021 has been an exceptionally strong YTD for Creditas post 4Q20 fundraise as evidenced by reported quarterly headline metrics. In addition to the core
growth, 2021 was defined by a number of acquisitions and partnerships that should add fuel to an already strong organic growth story.
A third investment in India, a first in the embedded fintech space – welcome Blackbuck
In July’21, VEF made it’s third investment in India and invested USD 10 mln into Blackbuck, India’s largest trucking platform. This is our first foray into the
embedded fintech space, about which we are becoming increasingly excited.
2
Successful recent capital raise - $102 mln in Aug-21
We successfully raised $102 mln of additional capital to continue investing in our mandate of EM Fintech. It was our biggest raise to date and supported by
both our current shareholder base and a host of quality new investor names
VEF Shares have been trading at a premium to NAV for the longest period since inception
A combination of growing track record, portfolio composition and its direction of travelled overlayed with increased investor relations and liquidity in our
shares, have all supported the share price in this window for VEF
Introduction to VEF – The Emerging Market Fintech Investor
1
VEF’s Portfolio
2
Investment Opportunities
3
ESG
4
Appendix
5
3
The emerging market fintech investor
Riding one of the strongest multi-year secular growth trends in some of the world’s fastest-growing markets
Emerging market specialists
• Extensive Emerging Markets investing experience
• David Nangle, CEO: 20+ years EM financial
services
• Alexis Koumoudos, CIO: 10+ years EM investing
• Execution of 20+ private transactions across
Emerging Markets
Fintech expertise Listed investment company
• VEF is listed on Nasdaq First North Growth
Market in the Nordics
• A unique access vehicle: Opportunity to access
fast-growing private fintech assets in the public
market
1Including board seat in Iyzico (now exited);
NAV post private placement of c. SEK 885M (c. $102M) in Aug-21 and share price as of 15-Oct-21
• Deep sector knowledge built through evaluation of
over 600 deals and sitting on 121 board seats across
all lines of fintech
• Unique global fintech lens
• Strong track record of value creation with 2
successful exits in Russia’s and Turkey’s leading
fintech companies, Tinkoff and iyzico
25,8%
35,5%
IRR (NAV per share) IRR (Price per share)
$554M
NAV (3Q21)
18
Investments since
inception
$98M
Cash & Liquid
Investments
3
Number of exits
37%
25%
8%
5%
3%
3%
1%
18%
Brazil
Mexico
Emerging Europe
Russia
India
Africa
Pakistan
3Q21 NAV split
4
* As on 15-Oct-21 since inception
Cash & equivalents
Clear investment approach coupled with deep fintech expertise
SECTOR
We target all lines of financial services inclusive of payments, credit
and savings/investments. The “right” target sector is very market-
dependent.
GEOGRAPHY
Within emerging markets, we focus on the more populous and
scalable markets, referenced against competition for opportunities
and point in the cycle.
MINORITY STAKES AND A BOARD SEAT
VEF targets sizeable minority stakes of 10–20% with board
representation in its portfolio companies. We are active and
supportive shareholders.
UNIQUE FINTECH INVESTMENT
There are very few ways to play the growing fintech investment
theme in public markets and even less in the emerging world. VEF
is a unique access asset in this regard.
• Offline
• Online
• Mobile
• Remittances
• Consumer
• SME
• Secured
• Unsecured
• Digital Banks
• Personal Finance Managers
• Mobile Wallets
• Wealth Management
• Roboadvisors
• Digital Brokers
• Accounting SaaS
• HR & Payroll Management
• BNPL
• Online comparison and
brokerage
• Full-stack digital
CREDIT
PAYMENTS
PERSONAL
FINANCE
INVESTMENTS
EMBEDDED
FINTECH
INSURTECH
Targeted investment approach with a clear mandate … … and deep expertise across the fintech spectrum
= VEF investments
5
A diversified portfolio across scale emerging markets
VEF has backed entrepreneurs across the emerging world since inception in 2015
Russia – 3%
Emerging Europe
– 5%
Africa - 3%
Pakistan – 1%
Brazil – 37%
Mexico – 25%
India – 8%
VEF investments *% of 3Q21 VEF NAV (incl. cash)
Mexico
Brazil
Africa
Emerging
Europe
Russia
6
Pakistan
India
** Cash and equivalents comprise 18% of 3Q21 NAV
Portfolio
evolution
through 3Q21
• We have 15 holdings as of 3Q21, diversified by
geography, business type and stage of development.
• In 3Q21, we made one new investment: USD 10 mln in
Blackbuck, India’s largest online trucking platform. This
marks our first embedded-fintech play.
• We also made a follow-on investment of USD 9.3 mln in
Konfio.
Portfolio focus
& concentration
• Brazil and broader LatAm account for 37%/62% of our
geographic spread.
• Creditas is our clear largest holding at 31% of total NAV
and continuing to compound off a larger base.
• Top 2 holdings are 55% / top 5 are 69% of NAV.
Cash position
• USD 98 mln cash position post private placement in
Aug‘21.
Pipeline
• Pipeline busier then ever (we have seen 258 deals YTD
Oct-21 vis-à-vis 131 in full-year 2020) and we expect to
convert more new investments in the coming months.
Portfolio commentary
30,5%
24,5%
5,3%
5,2%
3,3%
2,5%
2,2%
2,2%
6,8%
17,5%
Cash & liquid
assets
VEF portfolio NAV as of 30-Sep-2021
USD 553.6 mln
Others
(<2% of NAV)1
1 Others include investments in Magnetis, Blackbuck, Rupeek, Finja, Xerpa, Abhi and Minu which contribute <2% of NAV as of 3Q21
2 Unadjusted for ~$1m of other net liabilities
7
Strong track record of investing in benchmark private fintech names across EM
We are now present in one of top 3 private fintech assets each in Brazil, Mexico & India. We have a track record of backing and successfully exiting fintech
champions in Russia and Turkey.
VEF exits
Mexico
Market leader in digital
SME financial services.
Brazil
Financial services
ecosystem built around
core fixed assets; one of
the few unicorns in Brazil.
Turkey
Leading digital payments
player successfully exited
yielding ~3x CoC and
~57% IRR – Turkey’s
biggest fintech exit.
Russia
Russia’a largest digital
bank successfully exited
yielding ~6x CoC and
~65% IRR. Number 1
digital bank in Russia/EM.
Current investments in 2 of LatAm’s fintech champions Successful exits from fintech leaders in Russia & Turkey
India
Asset-backed digital lending
platform beginning with gold-
backed loans.
Recent investments in India’s fastest growing tech start-up* and a leading digital payments company
* Accordoing to Deloitte Touche Tohmatsu India’s ‘Technology Fast 50’ 2020
8
India
India’s leading mobile
payments platform for online
merchants.
VEF current investments comprising 61% of NAV
-60%
-50%
-40%
-30%
-20%
-10%
0%
10%
20%
30%
40%
50%
Dec-15 Jul-16 Feb-17 Sep-17 Apr-18 Nov-18 Jun-19 Jan-20 Aug-20 Mar-21 Oct-21
Premium / (discount) to NAV
Premium/(Discount) to NAV1
Key figures
Share price, NAV/share and the premium/discount
NAV/share & share price development
$554M
NAV
(3Q21)
0,0
1,0
2,0
3,0
4,0
5,0
6,0
7,0
Dec-15 Jul-16 Feb-17 Sep-17 Apr-18 Nov-18 Jun-19 Jan-20 Aug-20 Mar-21 Oct-21
NAV/Share (SEK) Share Price (SEK)
SEK 4.64
NAV/share
(3Q21)
SEK 6.29
Share price
(15-Oct-21)
$759M
Market cap
(15-Oct-21)
9
Strong history of value creation since inception
2 successful exits in 2019 with IRRs >55%, and NAV per share IRR of 25%
Focus Digital Bank
Founded 2007
Key region Russia
Year of investment 2015
Amount invested $19M
Proceeds $117M
Investment overview
• A leading fintech innovator in Russia, Tinkoff Bank is one of the world’s largest
online banks with 15m customers today and offers a full range of financial services
for individuals and businesses via its mobile app and web interface.
• The company was founded in 2006 by Oleg Tinkoff.
• VEF invested (via spin-off from VNV) in Tinkoff in 2015.
Exit Overview
Key
facts
19
117
Total
proceeds
($M)
Amount
invested
($M)
+65% IRR
Date entered Jun-15
Date exited Feb-19
Holding period 3.6 years
IRR 65%
CoC 6.1x
Investment overview
• Iyzico is one of the fastest growing fintech players in Turkey, offering digital
payment solutions to online sellers and shoppers.
• The company was founded in 2013 by German-born Turks Barbaros Özbuğutu and
Tahsin Isın, who had moved from Germany to Turkey to set up the business.
• VEF invested in Iyzico in 2017 and sold its stake to Naspers in December 2019.
Exit Overview
11
35
Total
proceeds
($M)
Amount
invested
($M)
+57% IRR
Date entered Jan-17
Date exited Dec-19
Holding period 2.6 years
IRR 57%
CoC 3.2x
Focus Payments
Founded 2013
Key region Turkey
Year of investment 2017
Amount invested $11M
Proceeds $35M
Key
facts
10
VEF shareholder structure
¹ Holding as per the latest notification to the Company.
Based on Euroclear Sweden AB data and holdings known to the company. Including foreign nominees.
* The Company has 1,000,000 outstanding warrants and three LTIP program outstanding that could give rise to a maximum of 49,375,925 new shares.
11
Owner Holdings, SDRs Holding %
Ruane, Cunniff & Goldfarb
1
217,832,109 20.9%
Libra Fund
1
124,198,165 11.9%
Fidelity Investments (FMR) 95,139,868 9.1%
Swedbank Robur Funds 92,874,245 8.9%
Wellington Management
1
49,585,580 4.8%
Fidelity International (FIL) 26,265,135 2.5%
Highclere 20,310,000 1.9%
Robeco 20,000,000 1.9%
Avanza Pension 13,840,047 1.3%
GADD & Cie S.A. 13,280,957 1.3%
Svenska Handelsbanken AB for PB 10,100,000 1.0%
Atlant Funds 9,241,952 0.9%
Top 12 Institutional Holders 692,668,058 66.5%
Others 349,121,920 33.5%
Total Shares 1,042,289,978 100.0%
Shares held by management 24,566,890 2.4%
Strong team with significant EM/fintech experience
David Nangle
CEO
• Experience: 20+ years EM FS
• Renaissance Capital Head of Research
and Financials Sector Research
• ING Barings Head of EMEA Financials
Research
• Education: Degree in B. Comm Intl.
(French) from University College Dublin
Alexis Koumoudos
CIO
• Experience: 10 years EM investing and
5 years entreprenuer
• Partner at Skyline Capital Management,
an emerging market focused hedge
fund
• Education: MSc in Quant Finance & BA
in Business Fin. from Durham University
Shashi Shekhar Mahajan
Investment Associate
• Experience: 5+ years of EM private
equity investing and investment banking
• PE professional at True North Managers
India, a growth buyout PE managing $3B
• IB Analyst at JP Morgan India
• Education: MBA from London Business
School and BEngineering from BITS Pilani
Henrik Stenlund
CFO
Experience: 15+ years
• COO of Pomegranate Investment, VNV
• CEO, Strix Television
• Education: MSc in Business and
Economics
Cathal Carroll
Investment Manager
• Experience: 15 years+ experience in the
financial services industry across DM
and EM
• Co-founder of Carraighill, an
independent research firm focused on
global financial service companies
Éire Smith
Investment Associate
• Joined VEF straight out of university
• Education: BA in Business and
Economics from Trinity College Dublin
Helena Caan Mattsson
General Counsel / Head of Sustainability
Experience: Extensive background in
M&A, private equity and corporate law
• Associate at Cederquist, Baker &
McKenzie, Roschier
• Education: LL.M form Stockholm
University & LL.M in Business Law from
Jönköping International Business School
Elisabet Hultén
Deputy CFO
Experience: 10+ years of several roles
within finance function in Big Four
• Business Controller, DIBS Payment
Services
• Education: MSc in Business
Administration from Gothenburg School
of Economics and Law
12
Introduction to VEF – The Emerging Market Fintech Investor
1
VEF’s Portfolio
2
Investment Opportunities
3
ESG
4
Appendix
5
13
VEF portfolio summary
Company Country Segment Inv. date Ownership %
Invested amount
(USD mln)
Sep’21 fair value
(USD mln)
Brazil Asset focused Ecosystem Dec-17 8.4% 73.4 169.0
Mexico Diversified FS for Mexican SMBs Jun-18 10.4% 56.5 135.6
Emerging Europe Cross-Border Remittances Jun-16 12.3% 13.9 29.2
India Mobile Payments Platform Apr-20 9.9% 13.0 28.7
Africa Mobile Money Marketplace Oct-15 4.8% 14.6 18.4
Russia Payments & Consumer Credit Sep-15 23.0% 6.7 13.8
Brazil Consumer Credit Marketplace Mar-16 18.4% 4.1 12.3
Brazil Accounting SaaS provider for SMEs & accountants Apr-17 20.1% 6.5 11.9
Brazil Digital Investments Sep-17 17.5% 5.7 10.5
India Online Trucking Platform Jul-21 1.0% 10.0 10.0
Pakistan Digital Lending & Payments Jul-16 22.0% 2.9 7.4
India Secured Lending Platform Mar-21 1.4% 7.0 7.0
Brazil HR & Payroll Management Sep-19 16.0% 8.5 1.3
Pakistan Salary on Demand Jun-21 15.0% 0.9 0.9
Mexico Salary on Demand Mar-21 1.2% 0.5 0.5
USD 456 mln
(excl. cash and liquid assets)
14 * As of 30th Sep 2021
A Selection of VEF’s Key Geographies and Portfolio Holdings
2
Brazil
A.
Mexico
B.
India
C.
Emerging Europe
D.
15
Brazil is the most obvious fintech opportunity globally
A SCALE MARKET OPPORTUNITY
With a population of over 200 million people, Brazil is one of the world’s largest economies, and the kind of scale emerging market we like to invest in.
ONE OF THE MOST ‘ONLINE’ MARKETS IN THE WORLD
Brazil is one of the most ‘online’ markets in the world with high smartphone and internet penetration, a growing ecommerce market and strong tech adoption.
Brazilian fintech adoption saw a 60% increase between 2017 and 2019.
OLIGOPOLISTIC BANKING SECTOR AND SUPERNATURAL REVENUE ECONOMICS
Brazil’s banking market is highly concentrated, with the top five banks holding over 80% of total loans in the system, while fees and interest rates are some of
the highest anywhere in the world. It is an immense revenue pool for fintech to attack.
SUPPORTIVE REGULATORY LANDSCAPE
The Central Bank of Brazil is supportive of the fintech ecosystem as a way of leveling the playing field and improving the financial wellbeing of the average
Brazilian. Not always the case across the emerging world.
PEOPLE AND ECOSYSTEM
We have found many strong entrepreneurs and teams in Brazil and a very supportive VC and investment ecosystem into which to invest and partner.
MULTIPLE EXIT ROUTES WITH A HISTORY OF VALUE CREATION
Brazil has a healthy exit opportunity set through M&A and IPO. The Brazilian fintech ecosystem has seen massive exits of benchmark companies PagSeguro,
Stone, Banco Inter and XP, with other multi-billion-dollar acquisitions across the tech landscape.
WELL-BANKED ECOSYSTEM
Unlike many emerging markets, the Brazilian banking system is first world in many aspects, and its population is comfortable in the use of a broad array of
financial products. It is less a case of financial education and one of offering better products at a better price and user experience than incumbents.
16
Brazil constitutes 37% of VEF’s portfolio with 5 active investments
30,5%
2,2%
2,2%
1,9%
0,2%
63,0%
% of 3Q21 total portfolio NAV
37%
Remaining
portfolio
17
-
100
200
300
-
50
100
150
200
250
300
Q1-16
Q2-16
Q3-16
Q4-16
Q1-17
Q2-17
Q3-17
Q4-17
Q1-18
Q2-18
Q3-18
Q4-18
Q1-19
Q2-19
Q3-19
Q4-19
Q1-20
Q2-20
Q3-20
Q4-20
Q1-21
Q2-21
Q3-21
Recurring revenue Upfront revenue
Creditas
Brazil’s leading digital-first secured lending platform
Focus Asset Focused Ecosystem
Founded 2012
Key region Brazil
Share of NAV: 30.5%
Key facts
Fair value USD 169.0 mln
Investment USD 73.4 mln
Ownership stake 8.4%
Year of investment 2017
+R$1.1
BILLION
in annualized revenues
269k
ACTIVE
customers
R$2.9bn
LENDING
portfolio
55%
GROSS MARGIN
of credit portfolio
Quarterly revenue 2013-2021 – 65% of revenue is recurrent
As of 3Q21, Creditas’ loan portfiolio reached BRL 2.9 bln up 181%
yoy, with 3Q21 revenues of BRL 257 mln up 50%+ QoQ and over
3x YoY.
One of LatAm’s leading private fintech plays, Creditas is on a clear
path towards IPO.
Creditas is a building an asset focused ecosystem that supports
customers in 3 essential aspects; living (home), mobility
(transport) and earning (salary) by providing fintech, insuretech
and consumer solutions.
01
Collateral based lending is the core monetisation tool and allows
Creditas to build an eduring client relationship at low rates. Core
product suite is loans against home, auto and payroll today with
broader streams like insurance in the offering.
02
Creditas in brief Creditas in figures
R$ million
18
Credit
Portfolio
(R$ million)
New Loan
Origination
(R$ million)
3 8 68 95 127 171 216256 311 387
535
679
892916
1 043
1 255
1 545
2 015
2 921
-
500
1 000
1 500
2 000
2 500
3 000
3 500
Q1-17
Q2-17
Q3-17
Q4-17
Q1-18
Q2-18
Q3-18
Q4-18
Q1-19
Q2-19
Q3-19
Q4-19
Q1-20
Q2-20
Q3-20
Q4-20
Q1-21
Q2-21
Q3-21
Revenue
(R$ million)
Net
Income
(R$ million)
Creditas
Creditas’ strong business model is reflected well in its financial metrics
2 5 17 30 39 50 59 58 78 102
162 189
268
96
223
313
421
613
938
-
100
200
300
400
500
600
700
800
900
1 000
Q1-17
Q2-17
Q3-17
Q4-17
Q1-18
Q2-18
Q3-18
Q4-18
Q1-19
Q2-19
Q3-19
Q4-19
Q1-20
Q2-20
Q3-20
Q4-20
Q1-21
Q2-21
Q3-21
1 2 4 8 11 15 17
27 24
33
55
67
80 71 81
104
124
170
257
-
50
100
150
200
250
300
-
50
100
150
200
250
300
Q1-16
Q2-16
Q3-16
Q4-16
Q1-17
Q2-17
Q3-17
Q4-17
Q1-18
Q2-18
Q3-18
Q4-18
Q1-19
Q2-19
Q3-19
Q4-19
Q1-20
Q2-20
Q3-20
Q4-20
Q1-21
Q2-21
Q3-21
Recurring revenue Upfront revenue
(1) (3) (3) (3) (4) (6) (7)
5
(12)(15)
(20)
9
(27)
(32)
(75)(70)
(52)
(40)
(43)
(57)
(65)
(70)
(81)
(90)
(80)
(70)
(60)
(50)
(40)
(30)
(20)
(10)
-
10
20
Q1-16
Q2-16
Q3-16
Q4-16
Q1-17
Q2-17
Q3-17
Q4-17
Q1-18
Q2-18
Q3-18
Q4-18
Q1-19
Q2-19
Q3-19
Q4-19
Q1-20
Q2-20
Q3-20
Q4-20
Q1-21
Q2-21
Q3-21
CAGR
YTD 21 YoY 138%
CY17-20 139%
CAGR
YTD 21 YoY 181%
CY17-20 142%
CAGR
YTD 21 YoY 233%
CY17-20 155%
19
Creditas, product suite rollout and value creation history
With a loan book now standing at BRL 2.9b and significant strides in the ibuyer space YTD, we see considerable upside in Creditas in the coming months
3Q20 4Q20 1H21 3Q21
VEF raises
$61m in share
placement
Creditas $255m
Series E at
$1.75b valuation
VEF invests
$25m
VEF share price
and NAV reach
record highs
Creditas acquires
Bcredi
Creditas invests in
Voltz,; a Brazilian
electric motorcycle
startup.
Creditas acquires
Minuto Seguros, a
Brazilian digital
insurance platform,
strengthening its car
platform
Creditas acquires
Volanty, a used car
platform; growing 2x
pa and broadening
asset focused
ecosystem on path to
IPO.
Creditas partners with
NuBank, world’s
largest neobank.
Creditas will offer its
products to Nubank
customers in Brazil.
VEF
NAV
$268m $388m $404m $554m
Value creation in Creditas continues; currently marked to the last round post-money valuation of $1.75b (Dec 2020)
20
25,0 25,0
73,2
50,4
80,7
102,1
169,0 169,0 169,0 169,0
2017 2018 2Q19 1Q20 2Q20 3Q20 4Q20 1Q21 2Q21 3Q21
New Investment (USD m)
Initial Investment
Series C
($25m)
Series D
($23.4m)
Series E
($25m)
Mark-to-model
Latest transaction
A Selection of VEF’s Key Geographies and Portfolio Holdings
2
Brazil
A.
Mexico
B.
India
C.
Emerging Europe
D.
21
Mexico is a scale market with a large underserved SME and
consumer segment
Mexico constitutes 25% of VEF’s portfolio
SME and Financial Services
Serving the underserved
small business community
• 7 million SMEs in Mexico, <10% of which have access
to financing
• Banks focus predominantly on serving large corporate
clients and high-end retail
• Mandatory electronic invoicing (CFDI) provides unique
centralized data to analyze SMEs
• SME loans stand at $22B annually and set to grow
dramatically over the coming years
SME Credit and Financial Services
25%
VEF
Investments
• Massive scale of the opportunity with an addressable
market of 32.3m workers in the formal economy
• 75% of the population lives paycheck to paycheck
and lacks savings to cover unexpected expenses
• Access to traditional forms of credit is extremely
limited and hard to access
• ~$1.7b market size for the pay-on-demand category,
growing to $3.2b to include other employee wellness
and benefits products
Employee Wellness and Benefits
Employee Wellness
Provides instant access to
earned wages
22
Konfio
Digital banking and software tools for Mexico’s SMEs
Konfio has broadened its product suite to offer an arrary of
SaaS and payment tools, and also offers lending as a service
to some of Mexico’s largest FMCG companies.
Mexico is Latin America’s 2nd largest market with a
population of 127M (number 10 globally) and over 7M SMEs.
Konfio focuses on the top-end credit of the small business
segment which is viewed as a USD 45 bln opportunity.
Recently raised a USD 110 mln Series E2 funding round
becoming Mexico’s latest unicorn. Round was led by
Tarsadia, where VEF invested an additional USD 9.3 mln.
Konfio builds digital banking and software tools to boost
SME growth and productivity in Mexico.
Konfio leverages tech, big data and recent Mexican fiscal
control to offer loans to creditworthy SMEs historically
underserved by traditional banks.
CAGR 2017-2020
Revenue: 146%
Gross portfolio: 137%
Focus Diversified financial services for Mexican SMBs
Founded 2014
Key region Mexico
Share of NAV: 24.5%
Key facts
Fair value USD 135.6 mln
Investment USD 56.5 mln
Ownership stake 10.4%
Year of investment 2018
23
Konfio
Data-driven financial services
24
Konfío product suite expansion & value creation history
Rolling out a three-pillar strategy of lending, SaaS and payments to serve Mexican SMEs
3Q20 4Q20 1H21 3Q21
VEF raises
$61m in share placement
Konfío acquires ERP and
accounting software
company Gestionix in
further expansion of
Konfío’s SaaS tools
VEF share price and NAV
reach record highs
Konfío develops payments
solutions in-house and via
M&A
Konfío raises $125m Series E
funding round with VEF
participation of $19.8m
Konfío becomes Mexico’s 4th
unicorn with $110m Series E2
funding round (VEF
participation of $9.3m)
VEF
NAV
$268
m
$388m $404m $554m
Evolution of VEF’s stake valuation in Konfio
2018 2Q19 3Q19 1Q20 2Q20 3Q20 4Q20 1Q21 2Q21 3Q21
New investment USD mln
Series C
($15m)
$15.0m
$35.0m $41.6m
$32.4m $28.1m
$40.3m
$48.5m
$61.0m
$75.4m
$135.6m
Conv. Note
($10m)
Series D
($2.5m)
Series E
($19.8m)
Series E2
($9.3m)
Mark-to-model
A Selection of VEF’s Key Geographies and Portfolio Holdings
2
Brazil
A.
Mexico
B.
India
C.
Emerging Europe
D.
26
India is an exciting market with an evolved fintech ecosystem
India constitutes 8% of VEF’s portfolio
8%
VEF
Investments
Payments
Simplifying the complex
payments infrastructure for
merchants
• A scale market with 2nd largest population and one of the largest banked
populations in the world. High smartphone penetration, digital adoption and data
usage has resulted in high adoption of fintech
• Government and regulatory drive to digital payments and bolstering of public
payment infrastructure
• Rapidly growing e-commerce opportunity with significant resources focused on
developing payment solutions
• Complex payments infrastructure with many unique payment methods and
mandatory 2 factor authentication has resulted in some of the most advanced
payment solutions globally
Payments
• More than 90% of Indians don’t have access to formal credit. 60% of their debt is
unsecured, which is expensive and limited in quantum
• At the same time, 95% of their net worth is held in some form of asset, with Indian
households have over 25,000 tonnes of gold holdings worth ~USD 1.5tn
• Combining the huge credit gap and unproductive gold in Indian households
represents a huge market opportunity
Asset-backed (gold) lending Asset-backed lending
Championed creation of a new
category – doorstep gold loan
27
• At VEF, we are experiencing an attractive and growing pipeline of ‘embedded
fintech’ opportunities. BlackBuck represents our first investment in this space
• India’s economy relies on a very fragmented and disorganised trucking industry for
the transportation of goods across the country. There are 1.5mn truckers (fleet
owners) who own 3.5mn trucks.
• The highly fragmented nature of the trucking sector is relatively unique globally and
provides a huge opportunity to disrupt.
Embedded Fintech (Logistics)
Embedded fintech
Leading transformation in the
Indian logistics industry
Juspay
India’s leading mobile payments platform for online merchants
Juspay solves these challenges for customers with their unifying layer
of products and value-added services, with more than 250 mln
downloads of its SDK.
Juspay improves conversion rates for merchants and others in the
payment value chain, facilitating ~USD 50 bln of annualised GMV and
~6 mln transactions per day*.
Based in Bangalore, Juspay is backed by Accel India, Wellington
Management, and serves some of India’s largest merchants including
Amazon, Flipkart and Uber.
Juspay is India’s leading mobile payments platform for online
merchants.
01
India has one of the most advanced and complex electronic payment
infrastructures globally, resulting in friction and challenges for
merchants and banks in the country.
02
Focus Mobile Payments
Founded 2012
Key region India
Share of NAV: 5.2%
Key facts
Fair value USD 28.7 mln
Investment USD 13.0 mln
Ownership stake 9.9%
Year of investment 2020
* As of August 2021
28
Juspay in figures
200%+
M12 revenue retention of
enterprise clients
~2x
Growth in transactions per
day in last 2 years
250 mln+
SDK installs
~6 mln
Average transactions per day
(Aug’21)
80%
Market share of Juspay
clients in digital payments
~$50 bln
Annualized GMV (Aug’21)
<1%
Monthly merchant churn
160+
Total number of enterprise
clients and merchants
Juspay
Digital payments are witnessing exponential growth in India and Juspay is well positioned to capitalize on the huge opportunity
Value and volume of UPI transactions in India
0
500
1 000
1 500
2000
2500
3 000
3 500
4 000
0
500
1 000
1 500
2000
2500
3 000
3 500
4 000
4 500
5 000
5 500
6 000
6 500
7 000
Oct-16 Feb- 17 Jun-17 Oct-17 Feb- 18 Jun-18 Oct-18 Feb- 19 Jun-19 Oct-19 Feb- 20 Jun-20 Oct-20 Feb- 21 Jun-21
Value in INR billion (LHS) Volume in million (RHS)
29
UPI is fast becoming the most favored method of digital payment….
4
25
100
FY18 FY21 FY26
Number of UPI transactions
….projected to witness exponential growth over next 5 years
68
578
FY21 FY26
Value of UPI transaction
(USD billion)
4x
9x
6,0
2,0
1,5
1,2
0,5
Juspay PayU Razorpay Billdesk Pine Labs
Transactions per day in millions
Juspay has achieved ~1.2x scale compared to next 4 peers combined
80
50
40
30 30
Billdesk Juspay Pine Labs PayU Razorpay
Total annualized payments volume (USD billion)
~1.2x scale compared to next 4 peers
combined
Source: Company, Research
Rupeek
India’s fastest-growing asset-backed digital lending platform
Rupeek is solving for this paradox by building products to make
credit accessible to the masses in a fair and convenient manner and
is contributing to the financial inclusion of the Indian population.
Rupeek currently disburses ~USD 800 mln annually and is
growing 15% month-on-month. The company has also sustained
high customer centricity with a consumer NPS being >65.
Based in Bangalore, Rupeek is backed by some of the prominent
investors including Accel India, GGV, DST, Gemini and Bertelsmann.
Rupeek, which provides online gold loans at the doorstep, is India’s
fastest growing asset-backed digital lending platform* and is our
second investment in India.
01
More than 90% of Indians don’t have access to formal credit. At the
same time, 95% of their net worth is held in some form of asset,
with Indian households holding over 25,000 tonnes of gold worth
~USD 1.5 tn.
02
Focus Secured Lending Platform
Founded 2015
Key region India
Share of NAV: 1.3%
Key facts
Fair value USD 7.0 mln
Investment USD 7.0 mln
Ownership stake 1.4%
Year of investment 2021
* Accordoing to Deloitte Touche Tohmatsu India’s ‘Technology Fast 50’
Indian gold loan industry and Rupeek in figures
#1
Rupeek is India’s fastest
growing tech start-up
c.15%
Month-on-month
disbursement growth
$800m
Annualized disbursement
by Rupeek
RUPEEK
100m+
Potential gold loan
borrowers in India
+$150b
Annual gold loan book in
India
+$1.5tn
Value of gold held by Indian
households
INDUSTRY
30
Blackbuck – 3rd investment in India and 1st in embedded fintech
India’s largest online trucking platform
BlackBuck digitizes fleet operations for truckers (providing
predominantly payments solutions around tolls and fuel) and
operates a marketplace matching trucks with relevant loads.
Blackbuck is a leader in its category and has built several unique
solutions for Indian truckers. 35% of India’s trucking toll spend
today happens through BlackBuck.
The company achieved unicorn status in the last concluded round.
Alongside VEF, Blackbuck is supported by multiple global investors
including Accel, B Capital, Goldman Sachs, IFC, Sands Capital,
Sequoia, Tiger Global, Tribe Capital, and Wellington Management.
At VEF, we are experiencing an attractive and growing pipeline of
‘embedded fintech’ opportunities and BlackBuck represents our
first investment in this space and our third investment in India
01
BlackBuck is the largest online trucking platform in India and
currently drives 90%+ market share of all online trucking activity. It
is leading a transformation in the India logistics industry, which is
fast moving from paper & pencil to digital.
02
Focus Online trucking platform
Founded 2015
Key region India
Share of NAV: 1.8%
Key facts
Fair value USD 10 mln
Investment USD 10 mln
Ownership stake 1.0%
Year of investment 2021
31
Blackbuck in figures
#1
India’s largest trucking
network
1,000+
Industrial hubs connected
by Blackbuck
15m+
Monthly transactions
10k+
Number of SME and
enterprises customers
700k+
Number of truckers on
Blackbuck platform
1.2m+
Number of trucks on the
platform
A Selection of VEF’s Key Geographies and Portfolio Holdings
2
Brazil
A.
Mexico
B.
India
C.
Emerging Europe
D.
32
ü Global remittances totaled USD 700+ bln in 2020 (World Bank)
and continues to grow
ü The average cost of making a cross-border remittance in
4Q20 was 6.5%
ü Growing share of cross-border remittances being executed
electronically
ü Electronic cross-border remittances benefit in speed and price
ü Large portion of cross-border remittances conducted regularly
and predictably
Cross-Border Remittances
Emerging Europe
Emerging Europe constitutes 5% of VEF’s
portfolio
Cross-Border
Remittances
Offering real-time low-cost
digital money transfer options
across the globe
5%
VEF
Investments
33
TransferGo
A leading digital cross-border remittance provider in Europe
TransferGo has a high market share in key corridors across its
prime CEE/CIS region of focus.
Deep bank integration facilitates the fastest guaranteed
settlement times amongst peers, while customers pay up to
90% less using TransferGo vs banks.
TransferGO recently closed a $50mn Series C funding round,
leaving it well placed to win its region/segment of focus.
TransferGo is a low-cost, digital money transfer business
offering real-time service to customers across the globe.
01
Currently serving a customer base of over 2.5mln people,
TransferGo’s segment of focus are migrant workers, who are
some of the most consistent and regular remittance customers.
02
+£1.4bn
Sep’21 run-rate transaction
volume
#1
Best rated money transfer
platform in the world
TransferGo in figures
+2.5m
Customers registered
since inception
30 sec
Transaction processing
speed capability
c.£24.2m
Sep’21 run-rate revenue,
growing +27% YoY
+66%
Sep’21 gross margin
OPERATIONAL FINANCIAL
4.3x-6.6x
CLTV/CAC vs peer
group of 2.6x
Focus Cross Border Remittances
Founded 2012
Key region Europe
Share of NAV: 5.3%
Key facts
Fair value USD 29.2 mln
Investment USD 13.9 mln
Ownership stake 12.3%
Year of investment 2016
34
15%
30%
80% 20%
31%
Turkey Ukraine Poland Romania Lithuania
Digital remittance volume
Non-digital remittance volume
TransferGo
TransferGo bridges the unmet need for blue-collar migrants to conveniently transfer money abroad
TransferGo: The business model in brief Global digital remittance volume is set to increase …
… and already a large volume opportunity in key markets
Sources: Statista, BTCA, World Bank, Bank of Ukraine, Business Insider
Moved abroad to earn
money
Has a blue-collar job and
income
Limited proficiency in local
language
Limited financial literacy
Support family at home
financially
Build savings and wealth
Pay off debt (home &
abroad)
Find a trustworthy financial
partner
Stay on top of finances
Easy initiation of recurring
and one-off payments
“Save” product to deposit
funds
Inability to open local bank
accounts
Building savings & wealth
Access to affordable
overdraft credit facilities,
currently dominated by pay-
day lenders and incumbents
Situation Goals Needs Challenges
“Blue-collar migrants have unique financial needs and they remain underserved”
• TransferGo offers a simple and inexpensive way for blue-collar migrants
to transfer money across borders
• Extract a competitive commission based on the value of the transfer
538
478 428 430 417 423 417 400 373 363
60
104
145 183 225 247 277 314 360 387
642
2014 2017
2015 2016 2019
2018 2020E 2021E
694
2022E 2023E
750
598 582 573
613
670
714 733
Digital Volume (USD bln) Non-Digital Volume (USD bln)
Family in
home
country
Blue-collar
migrant
Frequent low-value
money transfers
Commission to
TransferGo
82
69
64
33 31
25 22 20 20 17
CEE,
Ukraine
…
India
China
Philipines
Mexico
France
Nigeria
Egypt
Pakistan
Germany
Annual remittance volume by destination (USD bn)
19%
Forecasted digital remittance volume growth rate (CAGR ’20-’24)
Digital remittance penetration in key markets (USD bn)
11% 21% 25% 16%
A 2% take-rate implies a $1.6bn
revenue opportunity
21
11
7
5
1
CEE
Ukraine
&
Turkey
35
TransferGo
TransferGo v/s. Wise v/s. Remitly
Source: TGo/ Wise/ Remitly/ GS
36
Product
Card-to-card and bank remittances
SME offering
Remittances-as-a-service
C2C transfers
Multi-currency account with debit
card
SME/ Enterprise offering
Remittances
(for immigrants, generally one-way)
Corridors
743 corridors
50 receiving countries
Mainly send-only
1,600 corridors
59 receiving countries
Send and receive
700 corridors
150 receiving countries
Mainly send-only
Licencing
UK
Lithuania (EEA-wide EMI)
Ukraine
Turkey
EEA
Hong Kong
India
Malaysia
(50+ others)
Australia
Canada
Ireland
Nigeria
US
UK
Technology
27/7 end-to-end automation allow for
transactions to be processed in seconds (30
sec. transaction processing speed capability)
20% of transactions are processed
within 20 seconds (38% instantly,
83% < 1 day)
75% of transactions < 1 hr but longer
tail
Geographic exposure
(revenues)
Ukraine, CEE & Turkey 95% Europe 33%, UK 23%, N. America
17%, APAC 21%, RoW 6%
(FY 2021)
US 77%, Canada 12%, Other 1%
(India, the Philippines, and Mexico
biggest corridors)
Introduction to VEF – The Emerging Market Fintech Investor
1
VEF’s Portfolio
2
Investment Opportunities
3
ESG
4
Appendix
5
37
• Continuously evaluating 3 core opportunities for investment and shareholder value creation
• Investment decisions and prioritization driven by expected IRR from each opportunity
PIPELINE OPPORTUNITIES
• Investing in new companies based on our country-specific approach
• Leverage our deep fintech expertise, global lens and partner network to find the best
opportunities
• Largest opportunity to deploy capital as fintech in emerging markets continues to gain
momentum with many success stories
• Core country and company target lists provide focus to getting the best deals that meet
expected IRR hurdles
FOLLOW-ON INVESTMENTS
• Opportunities to invest more in portfolio winners
• Companies we have lived with, know the best and highest conviction on expected IRR
• $ value deployable in follow-ons grows with size of the portfolio and valuation of portfolio
winners
• High level of visibility as to when follow-on investment opportunities will arise
BUYBACKS
• Opportunity to generate shareholder value if share price discount is high and confidence in
evolution in portfolio winners is such that expected IRR meets hurdle rate
• Opportunity dependent on market conditions, with least visibility
Pipeline
Follow-
ons
Buybacks
Hurdle
IRR
Investment opportunities
3 core avenues for capital allocation
38
Strong history of follow-ons augmenting shareholder value creation
Investing more in portfolio winners, companies we know inside-out, with high conviction on expected IRRs
Follow-on investments
Historic and projected follow-on investments (USD mln)
39
0,04
1,6
5 12 40 29 24
30
3
6
9
12
11
12
15
0
2
4
6
8
10
12
14
16
0
5
10
15
20
25
30
35
40
45
2015 2016 2017 2018 2019 2020 2021 - YTD YTD'21 to YE -
Predicted
Follow-on Follow-on (planned) Avg # of companies in VEF portfolio
Total expected follow-ons of
~$54m in 2021, of which
$24m has been invested
already YTD.
TBU
Pipeline heating up, but we remain disciplined and selective
• Deal flow as healthy as ever with fintech in emerging markets gaining momentum and high profile exits.
• Country by country approach to searching for opportunities and teams that we believe will be winners in their space.
• Leverage our deep fintech expertise, global lens on financial services and strong local partner network to identify opportunities that exceed
our expected IRR hurdle.
• Have core countries and company target lists to focus our efforts.
• Countries of focus are Brazil, India and Mexico with large volume of big deals and frontiers like Egypt and Pakistan with a less developed
ecosystem and smaller ticket opportunities.
• With 3 new investments so far in 2021, we are likely to make further new investments this year and/or next as we convert a busy pipeline.
Deal count by stage YTD 2021(1) YTD 2020(2) YoY % Full year 2020
YTD 2021 as % of
2020
Leads 249 107 133% ▲ 131 190%
Qualified Leads 141 58 143% ▲ 69 204%
1 Deals seen as of 15-Oct-21; 2 Deals seen as of 15-Oct-20
YTD 2021, we have already seen almost double the deals we saw in full year 2020 and ~2.3x the deals we saw in first 9.5 months of 2020.
However, we remain highly selective and diligent despite the pipeline heating up.
40
Creditas, compounding from a larger base
The value of VEF’s position in portfolio North Star, Creditas, accounts for 30% of VEF’s total NAV. Growing at a run-rate north of 100% YoY, we are
starting to enjoy a larger base effect, from what is still early days of their journey into a scale opportunity space. M&A and partnerships are adding a
fresh leg to a strong underlying growth story. IPO targeted for 2022.
NAV continues to reach new highs and a strong basis for continued growth
YTD 2021 has started where 2020 left off and we remain encouraged by all we see in our portfolio as we look ahead. We are exceptionally well
placed post our recent capital raise and have some great partners in our cap table that provide much more then just capital.
Portfolio break outs and ones to watch – Konfio, our next Creditas – Juspay, Jumo and TGo in focus
Through 2021, we see clear potential for other names within the portfolio to break out and scale within their focus space and geographies. Top of
list, Konfio, exceptionally well-funded and delivering on its diversified SME financial services platform. Juspay, Jumo and TGo are all stories starting
to break out and can have meaningful future NAV impact.
ESG: VEF moves jurisdiction to Sweden; portfolio companies at the front line of sustainable finance
We recently announced the completion of our domicile change from Bermuda to Sweden, an important step in our ESG journey and in ensuring
that VEF is a long-term sustainable company and an attractive investment for all types of investors. Many of our companies drive financial
inclusion and fairness within their focus ecosystems.
Fintech theme gathering momentum – long a portfolio of strong assets, rich pipeline in the works
YTD 2021 has easily been the busiest period on the pipeline front in our history. We have engaged with over ~212 opportunities YTD (Sep’21) in our
core geographies, vis-à-vis 131 for all of 2020. While we continue to see a healthy pipeline flow, we maintain our focus, patience and diligence in
the current climate. We have made just 1 new investment from the 2021 funnel cohort, but expect to complete more by YE21.
Key risks
Uncertain macro and markets outlook from ongoing COVID spread.
VEF investment case
VEF provides unique access to one of the most exciting value creation spaces within emerging markets.
41
Introduction to VEF – The Emerging Market Fintech Investor
1
VEF’s Portfolio
2
Investment Opportunities
3
ESG
4
Appendix
5
42
VEF sustainability and core values
Stewardship
Active and responsible shareholder that takes corporate
governance very seriously, both within VEF and in portfolio
companies
Integrity
Transparent, open, honest, fair and ethical towards all
stakeholders
Respect for people and diversity
Respect for diversity of thought, background and the individual.
Innovation and success come out of bringing people together
from different backgrounds, with different ideas, strengths and
experiences.
Positive impact
Returns by positive social impact. Participate in the creation of
economic opportunities for those without, advance new
technologies and business models that are sustainable and
improve financial intermediation.
VEF core values
VEF sustainability in brief
VEF core values – the foundation
Broad and robust policy package
Sustainability principles
and tailored focus areas
Portfolio companies
driving impact
43
VEF’s sustainability strategy
An investment decision-making process driven by a strong belief in:
Sustainability as a fundamental part of business
Power of active shareholding, to ensure strong governance and
responsible business practices
Sustainability strategy
Portfolio companies
• Biggest sustainability effect comes through our portfolio companies
• Current VEF ESG targets for portfolio companies:
• 100% have relevant policies within business ethics
• 100% compliant with VEF business ethics requirements
• 3 areas specifically relevant to VEF as an EM fintech investor:
VEF industry involvement
• A global community with the main goal to promote
responsible investing and practices within the digital finance
industry
• VEF is a signatory
• 10 investor guidelines
• Responsible financing:
§ Fair and transparent consumer practices
§ Data privacy and security
§ Responsible lending and debt prevention
•Regulatory compliance, anti-corruption, AML and
general business ethics
Business ethics
•Fair and transparent consumer practices
•Data privacy and security
Responsible
financing
•Improve and provide access to fair and
affordable financial services
Financial inclusion
1
2
Sustainability at VEF
Two dimensions of sustainability at VEF:
VEF as a company and investor
• While small today, we recognize the value and importance in keeping
our house for our long-term and sustainable growth as an investment
company
• Domicile change to Sweden – an important step in our ESG journey
1
2
44
Investment process backed by a thorough ESG diligence
Investment
process
From sourcing to investment decision
• Discussed at an early stage
• Fundamentally believe “If it is not ethical, it is not scalable”
• Investment cases with positive social impact often have very attractive fundamentals, eg. underserved consumers or
SMEs
Close collaboration
• Investment team and sustainability team work closely on all investments
ESG assessment in-house
• A tailored in-house assessment before all new investments
• Periodical assessments post-investments
ESG diligence Pre-investment
• Analysis of exposure to ESG risks mandatory before investing
• Focused on VEF core ESG areas, business ethics, responsible financing and financial inclusion
Post-investment
• Periodical assessment of portfolio companies to:
a) Ensure we are aware of potential issues
b) Track progress within ESG
c) Active involvement where needed, eg. ensure appropriate policies and processes or just general guidance to improve
and move to the next step
d) Maturity often depend on life stage of company
e) Expect improvement and commitment to grow with the portfolio companies
VEF is an active and responsible shareholder, believing in the fundamental importance of integrating ESG considerations into our investment
process to create sustainable and long-term value for our investors
45
Supporting the SDGs – social impact
Financial inclusion
• Supporter of UN Sustainable Development Goals
• Access to financial services for people and small businesses is an
important part in achieving the SDGs, eg. reduce poverty and hunger,
reduce inequality and promote gender equality
• 1.7 billion people in the world have no access to financial services
EM fintech = impact
The majority of VEF portfolio companies play an important role in the
furthering of financial inclusion, by providing a) services to consumers
and SMEs who are un- or underserved by traditional financial
institutions or b) access to financial services at fair and affordable
terms:
• Loans to low-income people and SMEs
• Financial services on fair and affordable terms
• Access to financial services for previously unbanked or underbanked
Our capital positively impact the access to fair and affordable financial services while staying true to our mandate of maximizing return
46
Fintech for financial inclusion – VEF portfolio (1/2)
Most VEF portfolio companies play an important role in the furthering of financial inclusion, by providing:
a) services to underserved consumers and SMEs; or
b) access to financial services at fair and affordable terms.
• Mexican SMEs are underserved by traditional banks -only
3 out of 10 businesses have access to formal credit
• Konfio provides credit and other financial services to SMEs
• Facilitating growth opportunities for SMEs and sole traders
– average 25% increase in sales following Konfio loan
• Passionate about gender diversity – currently an ongoing
project to close the gender pay gap within Konfio
A rising star
41%
Sole proprietors
1/3
are women
+50%
first time formal
financial services
users with no
credit history
• For 60% of Jumo customers it’s their first interaction with
formal financial services.
• Jumo lends to formal and informal SMEs, often shunned by
banks.
• Removing barriers to access and reaching segments that
have been previously excluded from financial services.
• Served almost 18m customers
• Originated over US$ 3bn in loans
• 60% are first time users of formal financial services
A VEF benchmark for financial inclusion
27%
earn less than
US$ 2 per day
1/3
are women
21%
live in rural areas
Fintech for financial inclusion – VEF portfolio (2/2)
Most VEF portfolio companies play an important role in the furthering of financial inclusion, by providing:
a) services to underserved consumers and SMEs; or
b) access to financial services at fair and affordable terms.
• A vast majority of population and SMEs lack access to
formal credit
o 21% of the adult population have a bank account
o 2% of adults and 7% of SMEs receive formal credit
from financial institutions
• Finja is Pakistan’s leading digital lending platform for
MSMEs
• Serve more than 3,000 unique MSME and 200,00 unique
retail customers, of which a majority are underserved
Serving underserved population and SMEs
21%
Adult banked
population
7%
%age of SMEs
receiving formal
credit
2%
%age of adults
receiving formal
credit
• Brazilian consumers pay some of the highest
interest rates in the world
• Reduces the Brazilian consumer debt burden and
offers loans at significantly more affordable terms
• Creditas cuts interest rates 80-90% from the
normal 100-400%/annum typically charged by
unsecured consumer lenders and credit card
providers in Brazil
Improving access to secured credit at affordable terms
• Rupeek provides customers access to secured
credit at affordable terms
• Many customers have previously not had access
to formal credit
• Mission: “bring financial inclusion to the masses
by making credit accessible to Indians in a
convenient and cost-efficient way”
Welcoming new board member, Hanna Loikkanen
• Following her election at
our May AGM, we are
delighted to
welcome Hanna
Loikkanen as a new
member of the VEF Board
of Directors.
• Hanna's extensive
experience in financial
services, private equity and
ESG across emerging and
frontier markets will be
invaluable to VEF in the
years ahead.
Redomestication from Bermuda to Sweden complete
• The redomestication of our
parent company from
Bermuda to Sweden was
completed at the end of
June.
• Following the domicile
change, VEF shares now
trade under the ticker
VEFAB,
• Our new structure ensures
that VEF is a long-term
sustainable company and
an attractive investment
for all types of investors,
and is an important step in
our ESG journey.
ESG: Redomestication and new board member
49
Introduction to VEF – The Emerging Market Fintech Investor
1
VEF’s Portfolio
2
Investment Opportunities
3
ESG
4
Appendix
5
50
Appendix
5
Deal sourcing
A.
History of value creation
B.
Governance structure
C.
Other portfolio holdings
D.
51
TOP-DOWN DRIVERS
IDENTIFY SEGMENTS OF FOCUS ATTRACTIVE OPPORTUNITIES ALL ABOUT TEAM AND PEOPLE
Deal sourcing
Country by country approach to targeting opportunities
Tech adoption
+
Behaviour
Regulation
+
Regulatory drivers
Capital markets
+
Funding sources
+
Exit environment
Access to talent
Macroeconomics
+
Unit Economics
+
Demographics
Cultural aspects
Private players Venture capital funds Listed players Incumbents
BOTTOM-UP MAPPING
52
Global fintech lens with trusted local partners
Strong value proposition: global lens + deep sector expertise + strong local partner support + local knowledge
`
`
….and leverages a strong network of local VC partners and co-
investors providing a superior value proposition.
COMMENTS
• Each Emerging Market has a local VC circle that dominate the sourcing and curating of early-stage digital opportunities, inclusive of fintech
• We have built strong relationships with the best local VCs and have co-invested and sit on boards with the majority of them over many years
• These relationships are a key positive for ongoing sourcing and successful building out of individual portfolio companies and our overall portfolio
53
Rigorous investment process
We identify and track investees for a long time before investing
COUNTRY-BY-COUNTRY APPROACH TO IDENTIFYING OPPORTUNITIES
Use top-down drivers and bottom-up mapping to identify attractive opportunities and teams
1.
INVEST TIME AND BUILD A RAPPORT
Spend time with the team on the ground, getting to know the individuals, business, products and
competitors. Continue to track progress from a distance
2.
INVESTMENT COMMITTEE
Produce investment proposal and present to investment committee who are fully appraised of the funnel
and have input before this stage. Gain formal approval to proceed and range of potential terms under
which to negotiate.
3.
DUE DILIGENCE
Perform thorough due diligence (legal, operational, technology and financial) leveraging third party
experts where necessary.
4.
CLOSING
Legal and final closing procedures
5.
TOTAL INVESTMENT PROCESS
Ongoing
DURATION
3 months –
1.5 years
1 month
1-2 months
1-2 months
6 months –
2 years
54
Appendix
5
Deal sourcing
A.
History of value creation
B.
Governance structure
C.
Other portfolio holdings
D.
55
IPOs
Company Valuation Offer size Year
$33bn $2.4bn 2020
$6.5bn $870mn 2020
$14.9bn $2.0bn 2019
$6.8bn $2.7bn 2018
$6.1bn $1.4bn 2018
M&As
Target Acquirer Price Year
$569m 2021
$1.1bn 2020
$200mn 2020
$165mn 2019
$49mn 2019
Strong back drop for value accretive exits within the EM fintech space
Growing wave of fintech M&A and exits
512
376
205
266
94
244
# of transactions
21,6
14,9
5,6
11,4
2,9
10,9
0,1
B a
n k
i
n g
/ L
e n d
i
n g
T e
c h We
a l
t
h & C a
p i
t
a l
Ma
r k
e t
s T
e c
h F
MS I
n s
u r
T e
c
h H e
a l
t
h c
a r
e F
i
n T
e c
h P a
y
m e n
t s F
i n
a n
c i
a
l B
P O
1,703
1H 21
Banking / Lending Tech
Wealth & Capital Markets Tech
InsurTech
Payments
Healthcare FinTech
FMS
Financial BPO
Financing Volume (USD Billions)
Record fintech funding in 1H211
Source: (1) 2Q21 Fintech Insights, Financial Technology Partners
Evolution of Global Fintech M&A
Recent EM Fintech exits
75 91
130
234 241
136
905 916
872
993 972
400
500
600
700
800
900
1 000
–
$50
$100
$150
$200
$250
$300
2016 2017 2018 2019 2020 1H 21
Global Fintech M&A Volume (US$ bn) Deal count
56
732
TBU
Appendix
5
Deal sourcing
A.
History of value creation
B.
Governance structure
C.
Other portfolio holdings
D.
57
Diverse engaged Board with broad-based value-added experience
Lars O Grönstedt
Chairman of the Board
Experience:
• CEO of Handelsbanken between 2001–2006, and Chairman of
the Board of Handelsbanken between 2006–2008
Education:
• BA in languages and literature from Stockholm University, and an
MBA from Stockholm School of Economics
David Nangle
Board Member and Managing Director
Experience:
• Renaissance Capital Head of Research and Financials Sector
Research
• ING Barings Head of EMEA Financials Research
Education:
• Degree in B. Comm Intl. (French) from University College Dublin
Per Brillioth
Board Member
Experience: 22+ years of EM investing
• MD of VNV Global AB (VNV)
• Head of the Emerging Markets section at the Swedish
investment bank Hagströmer & Qviberg between 1994 and 2000
Education:
• Graduate of Stockholm University and a Master of Finance from
London Business School
Ranjan Tandon
Board Member
Experience:
• Founder and Chairman, Libra Advisors
• Several operating positions with DCM in India and Halliburton in
Europe; CFO of InterMarine
• Education:
• Degree in Chemical Eng. from Indian Institute of Technology
Kanpur, India and a graduate of Harvard Business School
Allison Goldberg
Board Member
Experience:
• Partner at Saints Capital Media Ventures and former partner at
Advancit Capital
Education:
• Bachelor of Science in Economics from Wharton School at the
University of Pennsylvania
Hanna Loikkanen
Board Member
Experience:
• 25+ years of experience in emerging markets
• Independent Non-Exec Director at Finnfund and Bank of Georgia
• 13+ years at East Capital, a specialist in emerging & frontier markets
Education:
• Master of Economics at Helsinki School of Economics and Business
Administration
58
Appendix
5
Deal sourcing
A.
History of value creation
B.
Governance structure
C.
Other portfolio holdings
D.
59
VEF portfolio summary
Company Country Segment Inv. date Ownership %
Invested amount
(USD mln)
Sep’21 fair value
(USD mln)
Brazil Asset focused Ecosystem Dec-17 8.4% 73.4 169.0
Mexico Diversified FS for Mexican SMBs Jun-18 10.4% 56.5 135.6
Emerging Europe Cross-Border Remittances Jun-16 12.3% 13.9 29.2
India Mobile Payments Platform Apr-20 9.9% 13.0 28.7
Africa Mobile Money Marketplace Oct-15 4.8% 14.6 18.4
Russia Payments & Consumer Credit Sep-15 23.0% 6.7 13.8
Brazil Consumer Credit Marketplace Mar-16 18.4% 4.1 12.3
Brazil Accounting SaaS provider for SMEs & accountants Apr-17 20.1% 6.5 11.9
Brazil Digital Investments Sep-17 17.5% 5.7 10.5
India Online Trucking Platform Jul-21 1.0% 10.0 10.0
Pakistan Digital Lending & Payments Jul-16 22.0% 2.9 7.4
India Secured Lending Platform Mar-21 1.4% 7.0 7.0
Brazil HR & Payroll Management Sep-19 16.0% 8.5 1.3
Pakistan Salary on Demand Jun-21 15.0% 0.9 0.9
Mexico Salary on Demand Mar-21 1.2% 0.5 0.5
USD 456 mln
(excl. cash and liquid assets)
60 * As of 30th Sep 2021
Russia – A scale market and global leader in digital banking
Russia constitutes 3% of VEF’s portfolio
• Russia is a scale market with a population of 145 mln people and high
levels of fintech adoption, ranking number 3 globally at 82%
• The consumer credit market has grown rapidly in recent years with
growing opportunity for fintech to serve both consumers and merchants
in the POS space
• Founded in 2007, Tinkoff is one of the world’s largest digital banks, with
over 11mln customers
• Today Tinkoff gives its customers access to a fully-fledged and digital
ecosystem of financial, credit, insurance, investment, mobile, lifestyle, and
business products and services – all through its mobile app
• One of the most profitable banks in the world with ROEs north of 40%
(2020)
Digital Banking
Consumer Credit
Payments and Consumer Credit
Point of sale financing options for both
online and offline customers
Digital Bank and Credit*
Market cap: $22.0B1
*VEF was a shareholder in Tinkoff Bank and exited the business in 2019
1
Market cap as of 19-Oct-21
3%
VEF
Investments
Listed players
61
Revo
Leading buy now pay later player in the Russian market
Working with Russia’s online and offline merchants to increase
conversion and basket size, Revo also leverages proprietary
customer data to deliver personalized marketing services for
merchants.
Numerous scale partners across Russia, including some of the
country’s largest merchants in the offline and online space, while
also expanding into the CEE, including Poland and Romania.
Business model similar to offline pay-later solutions in Turkey/Brazil
and online solutions of Affirm, Klarna and Afterpay in the US,
Australia and Europe.
The Afterpay of Russia/CEE, Revo REVO provides buy now pay
later (BNPL) financing solutions for customers in Russia and CEE
through the Mokka brand.
01
One of the hottest sectors in fintech globally, BNPL has become a
mainstream option for financing purchases at the point of sale,
taking a share of the pie from the credit card market and often
considered as an alternative payment method as opposed to credit.
02
Key Merchant Partners
Focus Merchant Payments & Consumer Credit
Founded 2013
Key region Russia / CEE
Share of NAV: 2.5%
Key facts
Fair value USD 13.8 mln
Investment USD 6.7 mln
Ownership stake 23.0%
Year of investment 2015
62
Brazil constitutes 37% of VEF’s portfolio with 5 active investments
30,5%
2,2%
2,2%
1,9%
0,2%
63,0%
% of 3Q21 total portfolio NAV
37%
Remaining
portfolio
63
Nibo
Brazil’s leading accounting SaaS provider for SMEs and accountants
With over ~330k paying SMEs serviced through ~3.5k accountant
customers, Nibo’s tools empower accountants to better and more
profitably serve their customers.
Large addressable market of +10M SMEs with a regulatory
requirement to employ accounting services in Brazil and ~80k
accounting firms.
Proven model seen scale and succeed in other markets, eg. Intuit
(US), Xero (NZ) and Fortnox (Sweden).
Nibo is the leading accounting SaaS provider in Brazil, transforming
the way accountants and SMEs interact in one of the most
complex and regulated accounting and tax environments in the
world.
01
Nibo offers their customers a suite of financial management tools
including accounts and bank reconciliation, payment of bills, cash
flow projection tools and issuance of invoices and boletos.
02
Nibo SaaS dashboard
SMBs Accountants
ERP
General Ledger
Accounting
software
3
Accounting
Tax
calculations
Payroll
calculations
Nibo for
accountants
Accounting
analysis
Communication
Document storage
Cash Control
1
Finance
Management
2
Focus Accounting SaaS provider for SMEs & Accountants
Founded 2012
Key region Brazil
Share of NAV: 2.2%
Key facts
Fair value USD 11.9 mln
Investment USD 6.5 mln
Ownership stake 20.1%
Year of investment 2017
64
65
Brazil v/s. Sweden Brazil’s scale relative to Sweden
GDP $ 1,434b $ 531b 3x
Population 210m 10m 20x
Total addressable SMEs 10m 1.2m 5x
Total addressable accountancies 80,000 23,500 3x
Nibo v/s. Fortnox
Total SME customers 330,000 385,000
Implied market share 3.3% 32.1%
Maximum growth potential 30x 3x
Total accountants 3,500 6,000
Implied market share 4.4% 25.5%
Maximum growth potential 23x 4x
Current valuation $ 53m $ 3.9b
Valuation of Fortnox v/s. Nibo 74x
Significant potential
upside in Nibo
Source: World Bank, Fortnox Annual Report and Call Transcripts, VEF Estimates; Fortnox’s market cap as of 18-Oct-2021
With one of the most
regulated and enforced tax
systems in the world, Brazil
represents a ~3x-5x market
opportunity vis-à-vis Sweden
Nibo
Nibo vs Fortnox – A VEF investment case
FinanZero
Digital marketplace for consumer loans in Brazil
Full integration with over 52 credit institutions (banks and fintechs)
allows FinanZero to handle the whole lending process from start to
finish.
The company is focused on three sizeable loan broker segments:
unsecured consumer loans, secured car finance loans and
secured home equity loans, while new products such as payroll
loans and credit cards are soon to be introduced.
Proven model seen scale and success in other markets and a
founding team with a successful track record and experience from
a leading consumer loan broker in Sweden.
FinanZero is a pioneering digital marketplace for consumer loans
in Brazil.
01
Acting as an independent broker, FinanZero negotiates the
customer’s loan with several banks and fintechs at once to find the
loan with the best interest rate and terms for the consumer.
02
+21%
Revenue growth in
2Q21 (QoQ)
52
Lending partners live
on the platform
+2.5m
Loan applications
in 2Q21
Quarterly revenue 2017-2021
FinanZero in figures
4.9/5
Rating out of c. 10.5k
Google reviews
(BRL ‘000)
Focus Consumer Loan Marketplace
Founded 2016
Key region Brazil
Share of NAV: 2.2%
Key facts
Fair value USD 12.3 mln
Investment USD 4.1 mln
Ownership stake 18.0%
Year of investment 2016
-
1 000
2000
3 000
4 000
5 000
6 000
Q1-16
Q2-16
Q3-16
Q4-16
Q1-17
Q2-17
Q3-17
Q4-17
Q1-18
Q2-18
Q3-18
Q4-18
Q1-19
Q2-19
Q3-19
Q4-19
Q1-20
Q2-20
Q3-20
Q4-20
Q1-21
Q2-21
66
FinanZero
Digital marketplace for consumer loans in Brazil
FinaZero: Business model in brief Lessons from the Swedish online broker market
1 2
Loan comparison service
Best offers available,
full transparency
Highest quality
applicants, based on
lenders preferences
Loan offers, delivered in the
way the lender provides
1 2
3
4
Applications from
customers
1 2 3 4
Loan broker service. Makes money from
commission on paid-out loans
FinanZero to pocket up to 14% commission with no balance sheet risk
§ The online loan broker model is a proven win-win for all involved parties
- Consumers: Improved transparency, usability and lower interest rates
- Lending partners: Reduced risk and lowered marketing cost
- FinanZero: Acts as an intermediary between the consumers and lending partners in
this win-win scenario, which creates loyalty and strong lock-in effects
§ USD 4 billion market
- Lendo yearly renegotiates approx. 3.4% of the total Swedish unsecured
loan market, equivalent to 0.9 USDbn
- A similar position in Brazil would equal a market size of 4.1 USDbn1
1
2 USD 0.9 bln
USD 4.1 bln
‒ The inherent lock-in effects of the loan broking model
make lenders increasingly dependent on Finanzero
‒ Commissions can be increased over time
‒ In Sweden, both Lendo and Zmarta has managed to
substantially increase their commissions
‒ From an average commission of 1.25% during the first
years to an average of approx. 6% today
Commissions are set to increase
The Brazilian unsecured loan market comprise a large opportunity
Source: (1) Based on 3.4% of Brazil’s unsecured loan market of 119 USDbn (448 BRLbn, Banco Central Do Brasil).
67
Magnetis
A digital investment advisor
Given the deep pool of wealth, high levels of consumer technology
adoption, large existing revenue pool and lack of financial market
literacy, Brazil represents one of the largest addressable markets
for digital wealth management globally.
Strong team with vast experience of investing in Brazil and in-
depth knowledge of regulatory architecture and requirements in a
space with limited competition.
Digital investment platforms became one of the hottest sectors in
fintech in 2020, with record account openings and a surge in
usage experienced globally.
Magnetis is a digital investment advisor in Brazil, democratizing
access to affordable and easy-to-use investment management,
offering customers a simple, digital tool to manage their wealth.
01
Using state-of-the-art technology, the product takes the
individual’s risk preferences into account, then builds and
manages a tailored portfolio of money market, insured fixed
income, hedge funds and equity ETFs at the click of a button.
02
Build a portfolio
tailored to you
1 Invest in a few
clicks
2
Track your progress and invest more
3
Focus Digital Investment Advisor
Founded 2015
Key region Brazil
Share of NAV: 1.9%
Key facts
Fair value USD 10.5 mln
Investment USD 5.7 mln
Ownership stake 17.5%
Year of investment 2017
68
Mexico is a scale market with a large underserved SME and
consumer segment
Mexico constitutes 25% of VEF’s portfolio
SME and Financial Services
Serving the underserved
small business community
• 7 million SMEs in Mexico, <10% of which have access
to financing
• Banks focus predominantly on serving large corporate
clients and high-end retail
• Mandatory electronic invoicing (CFDI) provides unique
centralized data to analyze SMEs
• SME loans stand at $22B annually and set to grow
dramatically over the coming years
SME Credit and Financial Services
25%
VEF
Investments
• Massive scale of the opportunity with an addressable
market of 32.3m workers in the formal economy
• 75% of the population lives paycheck to paycheck
and lacks savings to cover unexpected expenses
• Access to traditional forms of credit is extremely
limited and hard to access
• ~$1.7b market size for the pay-on-demand category,
growing to $3.2b to include other employee wellness
and benefits products
Employee Wellness and Benefits
Employee Wellness
Provides instant access to
earned wages
69
Minu
Mexico’s leading employee financial wellness company and the market leader for salary on demand
Minu solves for the employee liquidity gap, which is profound in the Mexican society where 75%
of workers live from paycheck to paycheck with average wages of $550/month.
Both employers and employees love Minu’s solution and its impact: 92% employer NPS and
4.8/5.0 app ratings.
Minu witnessed exponential growth in 2020 with an 18x increase in the number of transactions
last year.
Minu is the market leader in pay on demand in Mexico, offering employees 24x7 instant access
to their earned wages for a $2 fixed fee.
01
Minu works with 100+ large enterprises in both the private and public sector, including TotalPlay,
Telefonica, Scotiabank, OfficeMax, Rappi, Manpower and Cap Gemini.
02
Focus Salary on demand
Founded 2019
Key region Mexico
Share of NAV: 0.1%
Key facts
Fair value USD 0.5 mln
Investment USD 0.5 mln
Ownership stake 1.2%
Year of investment 2021
70
• Severely underbanked population, one of the lowest banked regions
globally
• Lack of access impossible to address with branches / traditional
banking model
• Strong penetration of mobile network operators incentivized to
broaden their reach into financial services
• A number of financial institutions keen to extend their products to the
unbanked population
Digital Consumer Financial Services
Africa VEF
Investment
Africa constitutes 3% of VEF’s portfolio
Mobile Money
Marketplace
Provides inclusive financial
services to unbanked
consumers and SMEs
3%
VEF
Investments
71
Jumo
One of the largest and fastest money marketplaces in emerging markets
Over 18M unique customers to date with over USD 3 bln in funds
disbursed. For 60% of customers it is their first interaction with
formal financial services.
Model has no real peer today. Very strong and deep management
bench.
JUMO is a full technology stack for building and running financial
services using advanced data science and machine learning to
power the fastest and leanest financial services infrastructure in
their markets.
01
Today JUMO is live in seven markets across sub-Saharan Africa
and South Asia: Ghana, Kenya, Tanzania, Uganda, Zambia, Côte
d’Ivoire, and Pakistan.
02
JUMO Mobile Money Marketplace
JUMO Capital
Financial Service Providers
Telenor
Tigo
Airtel
MTN
Mobile Network Operators
Barclays Letshego Ecobank
Focus Banking as a Service
Founded 2014
Key region Pan-Africa, Asia
Share of NAV: 3.3%
Key facts
Fair value USD 18.4 mln
Investment USD 14.6 mln
Ownership stake 4.8%
Year of investment 2015
Through their platform, JUMO partners with banks and telcos to
give customers access to savings and loan products via their
mobile phone in markets where millions of adults are excluded
from or underserved by traditional financial services.
72
Pakistan
• World’s sixth most populous country with 130 million
mobile users but large unbanked population (only
~20% of adults have bank accounts) where as little as
2% of adults and 7% of SMEs receive formal credit
from financial institutions
• Online ecosystem is witnessing hypergrowth
• A cash-based economy ready for disruption:
progressively moving towards a cashless economy
with strong support from regulators
Mobile Wallet and Credit
VEF
Investments
• There are 61 mln formally employed people in
Pakistan today – representing a large opportunity
• On the credit side, consumer credit is minimal and
currently stands at less 2% of GDP, excluding asset
finance like auto, home, etc. which is also minuscule
• There are only 2mln credit cards outstanding in
Pakistan and only 1 in 20 people has ever taken
formal credit
Employee Wellness and Benefits
73
Pakistan constitutes 1% of VEF’s portfolio
1%
Mobile Wallet and Credit
Serving unbanked consumers and
merchants alike
Employee Wellness
Provides instant access to
earned wages
Finja
A leading digital lending platform and integrated payments ecosystem in Pakistan
Finja offers working capital and supply chain loans to small
businesses, and personal and payroll-backed loans to salaried
professionals.
Finja also operates an integrated payments ecosystem and mobile
wallet, offering bill payments, an ecommerce marketplace and the
recently launched FinjaCard, a physical card offering for urban
salaried professionals, controlled digitally through the Finja app.
Strong founding team of serial entrepreneurs with experience in
mobile wallets, online marketplaces and financial products in
Pakistan.
Pakistan is a scale emerging market with a young and digitally-
literate population of 210 mln people,.with the tech ecosystem
steadily gaining momentum in recent years.
01
Finja is a digital lending platform with an integrated payments
ecosystem focused on the financial wellness of businesses and
their employees.
02
Focus Digital Lending & Payments
Founded 2016
Key region Pakistan
Share of NAV: 1.3%
Key facts
Fair value USD 7.4 mln
Investment USD 2.9 mln
Ownership stake 22.0%
Year of investment 2016
74
Abhi
Employee wellness platform catering to the needs of employees between pay cycles
From an employer perspective, the product adds no extra cost to
their payroll as the fee is borne by the employee. Corporates also
benefit from higher employee satisfaction and lower churn.
Modernizing the pay cycle is the most fundamental transformation
a company can make to its relationship with employees, and salary
on demand is a great scale product the cornerstone for a much
broader employee financial wellness play.
Abhi raised their USD 2 mln seed round in June 2021, led by VEF
and with participation from international and local investors
including Village Global, Sarmayacar, i2i Ventures, Zayn Capital,
and Portman Wills, the co-founder and CTO of Wagestream.
Abhi is VEF’s second fintech investment into the early stage scale
opportunity market of Pakistan, and our third in the financial
wellness space, following similar investments in Brazil and Mexico.
01
Abhi integrates with corporates to offer their employees salary
advance products to reduce their financial stress and avoid
expensive payday debt.
02
Focus Salary on Demand
Founded 2021
Key region Pakistan
Share of NAV: 0.2%
Key facts
Fair value USD 0.9 mln
Investment USD 0.9 mln
Ownership stake 15.0%
Year of investment 2021
75
NAV valuation approach
Methodology and process
VEF formally revalues its portfolio and sets a fresh NAV on a quarterly basis, in tandem with and signed off by its
auditors, PwC.
While the inputs of our cash and any listed holdings is clear, for all private company holdings, the fair value of each is measured based
on either 1) the latest investment round, or 2) using a mark-to-model approach.
1) Companies are measured based on the valuation set in the latest investment round for a period of up to 12 months post the
transaction at which point the valuation is considered stale. The investment round itself is considered acceptable if it is of relevant
size and led by a professional investor. Even then, the valuation has to be agreed and signed off by the VEF team and its auditor.
2) 12 months post transaction, the valuation of the company is moved to a mark-to-model approach. VEF management sets or
signs off on 12-month rolling company forecasts. It then sets the most logical company variable (revenues, AUM, EBITDA) against
an average market peer group valuation multiple to arrive at a fair valuation for the holding in local currency, before translating it
into hard currency at period end. The process is overseen by the valuation and audit team at PwC and is continuously evaluated
by both management and PwC.
76
Thank you

More Related Content

What's hot

Standard Treasury Series A Pitch Deck
Standard Treasury Series A Pitch DeckStandard Treasury Series A Pitch Deck
Standard Treasury Series A Pitch Deck
Zachary Townsend
 
Pitch Deck Teardown: DeckMatch's $1M Seed deck
Pitch Deck Teardown: DeckMatch's $1M Seed deckPitch Deck Teardown: DeckMatch's $1M Seed deck
Pitch Deck Teardown: DeckMatch's $1M Seed deck
HajeJanKamps
 
The behind-the-scenes story of our €1.6m seed round with Peter Thiel
The behind-the-scenes story of our €1.6m seed round with Peter ThielThe behind-the-scenes story of our €1.6m seed round with Peter Thiel
The behind-the-scenes story of our €1.6m seed round with Peter Thiel
Anh-Tho Chuong
 
Rokoko pitch deck: $80M motion capture tech
Rokoko pitch deck: $80M motion capture techRokoko pitch deck: $80M motion capture tech
Rokoko pitch deck: $80M motion capture tech
Pitch Decks
 
Pitch Deck Teardown: Super.com's $60M Series C deck
Pitch Deck Teardown: Super.com's $60M Series C deckPitch Deck Teardown: Super.com's $60M Series C deck
Pitch Deck Teardown: Super.com's $60M Series C deck
HajeJanKamps
 
Peleton pitch deck
Peleton pitch deckPeleton pitch deck
Peleton pitch deck
Pitch Decks
 
(Pitch Deck): How FTX raised over $1 billion
(Pitch Deck): How FTX raised over $1 billion(Pitch Deck): How FTX raised over $1 billion
(Pitch Deck): How FTX raised over $1 billion
Pitch Decks
 
Square pitch deck
Square pitch deckSquare pitch deck
Square pitch deck
pitchenvy
 
Pitch Deck Teardown: Party Round's $7M, er, party round deck
Pitch Deck Teardown: Party Round's $7M, er, party round deckPitch Deck Teardown: Party Round's $7M, er, party round deck
Pitch Deck Teardown: Party Round's $7M, er, party round deck
HajeJanKamps
 
Mint: $325K VC investment turned into $170M. Mint's initial pitch deck
Mint: $325K VC investment turned into $170M. Mint's initial pitch deckMint: $325K VC investment turned into $170M. Mint's initial pitch deck
Mint: $325K VC investment turned into $170M. Mint's initial pitch deck
AA BB
 
SME Neo-banks - Global Overview | Fintech Fraternity
SME Neo-banks - Global Overview | Fintech FraternitySME Neo-banks - Global Overview | Fintech Fraternity
SME Neo-banks - Global Overview | Fintech Fraternity
Fintech Fraternity
 
Manpacks Pitch Deck
Manpacks Pitch DeckManpacks Pitch Deck
Manpacks Pitch Deck
startuphome
 
Ark Kapital's $182M pitch deck for AI-driven early-stage investments
Ark Kapital's $182M pitch deck for AI-driven early-stage investments Ark Kapital's $182M pitch deck for AI-driven early-stage investments
Ark Kapital's $182M pitch deck for AI-driven early-stage investments
Pitch Decks
 
Lunar
LunarLunar
Lunar
SiftedEU
 
Hive - Investor Deck
Hive - Investor DeckHive - Investor Deck
Hive - Investor Deck
Alex Reed
 
Pitch Deck Teardown: Mint House's $35M Series B deck
Pitch Deck Teardown: Mint House's $35M Series B deckPitch Deck Teardown: Mint House's $35M Series B deck
Pitch Deck Teardown: Mint House's $35M Series B deck
HajeJanKamps
 
Stripe Pitch Deck designed by Zlides
Stripe Pitch Deck designed by ZlidesStripe Pitch Deck designed by Zlides
Stripe Pitch Deck designed by Zlides
Zlides
 
Square Pitch Deck
Square Pitch DeckSquare Pitch Deck
Square Pitch Deck
Vishal Kumar
 
Plum Fintech Pitch Deck
Plum Fintech Pitch DeckPlum Fintech Pitch Deck
Plum Fintech Pitch Deck
AngusSpencer
 
Coinbase Pitch Deck designed by Zlides
Coinbase Pitch Deck designed by ZlidesCoinbase Pitch Deck designed by Zlides
Coinbase Pitch Deck designed by Zlides
Zlides
 

What's hot (20)

Standard Treasury Series A Pitch Deck
Standard Treasury Series A Pitch DeckStandard Treasury Series A Pitch Deck
Standard Treasury Series A Pitch Deck
 
Pitch Deck Teardown: DeckMatch's $1M Seed deck
Pitch Deck Teardown: DeckMatch's $1M Seed deckPitch Deck Teardown: DeckMatch's $1M Seed deck
Pitch Deck Teardown: DeckMatch's $1M Seed deck
 
The behind-the-scenes story of our €1.6m seed round with Peter Thiel
The behind-the-scenes story of our €1.6m seed round with Peter ThielThe behind-the-scenes story of our €1.6m seed round with Peter Thiel
The behind-the-scenes story of our €1.6m seed round with Peter Thiel
 
Rokoko pitch deck: $80M motion capture tech
Rokoko pitch deck: $80M motion capture techRokoko pitch deck: $80M motion capture tech
Rokoko pitch deck: $80M motion capture tech
 
Pitch Deck Teardown: Super.com's $60M Series C deck
Pitch Deck Teardown: Super.com's $60M Series C deckPitch Deck Teardown: Super.com's $60M Series C deck
Pitch Deck Teardown: Super.com's $60M Series C deck
 
Peleton pitch deck
Peleton pitch deckPeleton pitch deck
Peleton pitch deck
 
(Pitch Deck): How FTX raised over $1 billion
(Pitch Deck): How FTX raised over $1 billion(Pitch Deck): How FTX raised over $1 billion
(Pitch Deck): How FTX raised over $1 billion
 
Square pitch deck
Square pitch deckSquare pitch deck
Square pitch deck
 
Pitch Deck Teardown: Party Round's $7M, er, party round deck
Pitch Deck Teardown: Party Round's $7M, er, party round deckPitch Deck Teardown: Party Round's $7M, er, party round deck
Pitch Deck Teardown: Party Round's $7M, er, party round deck
 
Mint: $325K VC investment turned into $170M. Mint's initial pitch deck
Mint: $325K VC investment turned into $170M. Mint's initial pitch deckMint: $325K VC investment turned into $170M. Mint's initial pitch deck
Mint: $325K VC investment turned into $170M. Mint's initial pitch deck
 
SME Neo-banks - Global Overview | Fintech Fraternity
SME Neo-banks - Global Overview | Fintech FraternitySME Neo-banks - Global Overview | Fintech Fraternity
SME Neo-banks - Global Overview | Fintech Fraternity
 
Manpacks Pitch Deck
Manpacks Pitch DeckManpacks Pitch Deck
Manpacks Pitch Deck
 
Ark Kapital's $182M pitch deck for AI-driven early-stage investments
Ark Kapital's $182M pitch deck for AI-driven early-stage investments Ark Kapital's $182M pitch deck for AI-driven early-stage investments
Ark Kapital's $182M pitch deck for AI-driven early-stage investments
 
Lunar
LunarLunar
Lunar
 
Hive - Investor Deck
Hive - Investor DeckHive - Investor Deck
Hive - Investor Deck
 
Pitch Deck Teardown: Mint House's $35M Series B deck
Pitch Deck Teardown: Mint House's $35M Series B deckPitch Deck Teardown: Mint House's $35M Series B deck
Pitch Deck Teardown: Mint House's $35M Series B deck
 
Stripe Pitch Deck designed by Zlides
Stripe Pitch Deck designed by ZlidesStripe Pitch Deck designed by Zlides
Stripe Pitch Deck designed by Zlides
 
Square Pitch Deck
Square Pitch DeckSquare Pitch Deck
Square Pitch Deck
 
Plum Fintech Pitch Deck
Plum Fintech Pitch DeckPlum Fintech Pitch Deck
Plum Fintech Pitch Deck
 
Coinbase Pitch Deck designed by Zlides
Coinbase Pitch Deck designed by ZlidesCoinbase Pitch Deck designed by Zlides
Coinbase Pitch Deck designed by Zlides
 

Similar to Pitch deck

Cento Southeast Asia Tech Investment FY2022
Cento Southeast Asia Tech Investment FY2022Cento Southeast Asia Tech Investment FY2022
Cento Southeast Asia Tech Investment FY2022
ssuser7a8dcd
 
state-of-india-fintech-union-2022.pdf
state-of-india-fintech-union-2022.pdfstate-of-india-fintech-union-2022.pdf
state-of-india-fintech-union-2022.pdf
ssuserdf252e
 
South Korea VC Report 2022.pdf
South Korea VC Report 2022.pdfSouth Korea VC Report 2022.pdf
South Korea VC Report 2022.pdf
White Star Capital
 
KMPG pulse-of-fintech H2 2022 - Global Analysis
KMPG pulse-of-fintech H2 2022 - Global AnalysisKMPG pulse-of-fintech H2 2022 - Global Analysis
KMPG pulse-of-fintech H2 2022 - Global Analysis
jeffreytsui4
 
6127a0965afd7898a34f69dadc24b8d17ada0b1b
6127a0965afd7898a34f69dadc24b8d17ada0b1b6127a0965afd7898a34f69dadc24b8d17ada0b1b
6127a0965afd7898a34f69dadc24b8d17ada0b1b
RepublikaDigital
 
DealBook of Ukraine: 2021 edition
DealBook of Ukraine: 2021 editionDealBook of Ukraine: 2021 edition
DealBook of Ukraine: 2021 edition
Yevgen Sysoyev
 
The State of European Fintech 2020
The State of European Fintech 2020The State of European Fintech 2020
The State of European Fintech 2020
Finch Capital
 
Ukraine Deal Review 2021. Tech Venture Capital and Private Equity deals of Uk...
Ukraine Deal Review 2021. Tech Venture Capital and Private Equity deals of Uk...Ukraine Deal Review 2021. Tech Venture Capital and Private Equity deals of Uk...
Ukraine Deal Review 2021. Tech Venture Capital and Private Equity deals of Uk...
Ukrainian Venture Capital and Private Equity Association
 
2021 MENA Venture Investor Ranking Report (SAMPLE)
2021 MENA Venture Investor Ranking Report (SAMPLE)2021 MENA Venture Investor Ranking Report (SAMPLE)
2021 MENA Venture Investor Ranking Report (SAMPLE)
RashedRawashdeh
 
IDFC-FIRST-Bank-Investor-Presentation-Q4-FY23.pdf
IDFC-FIRST-Bank-Investor-Presentation-Q4-FY23.pdfIDFC-FIRST-Bank-Investor-Presentation-Q4-FY23.pdf
IDFC-FIRST-Bank-Investor-Presentation-Q4-FY23.pdf
BhushanKale32
 
Lithium Pitch Deck | Community
Lithium Pitch Deck | Community Lithium Pitch Deck | Community
Lithium Pitch Deck | Community
TomLittler2
 
State Of European FinTech: Current Trends & Prediction 2017
State Of European FinTech: Current Trends & Prediction 2017State Of European FinTech: Current Trends & Prediction 2017
State Of European FinTech: Current Trends & Prediction 2017
Innovate Finance
 
White Star Capital SEA 2022 Venture Capital Landscape
White Star Capital SEA 2022 Venture Capital LandscapeWhite Star Capital SEA 2022 Venture Capital Landscape
White Star Capital SEA 2022 Venture Capital Landscape
Sanjay Zimmermann
 
FT Partners Research - Understanding the Impact of COVID-19 on FinTech
FT Partners Research - Understanding the Impact of COVID-19 on FinTechFT Partners Research - Understanding the Impact of COVID-19 on FinTech
FT Partners Research - Understanding the Impact of COVID-19 on FinTech
FT Partners / Financial Technology Partners
 
Ecobank annual report 2004
Ecobank annual report 2004Ecobank annual report 2004
Ecobank annual report 2004
Michael Olafusi
 
AVentures DealBook 2020
AVentures DealBook 2020AVentures DealBook 2020
AVentures DealBook 2020
Yevgen Sysoyev
 
AVentures DealBook 2019
AVentures DealBook 2019AVentures DealBook 2019
AVentures DealBook 2019
Yevgen Sysoyev
 
Ufrate chinese accelerators 2016 08-26
Ufrate chinese accelerators 2016 08-26Ufrate chinese accelerators 2016 08-26
Ufrate chinese accelerators 2016 08-26
Masters of Corporate Venture Capital
 
Finch Capital predictions 2018 - Summary
Finch Capital predictions 2018 - SummaryFinch Capital predictions 2018 - Summary
Finch Capital predictions 2018 - Summary
Radboud Vlaar
 
Finch Capital 2018 Predictions Summary
Finch Capital 2018 Predictions SummaryFinch Capital 2018 Predictions Summary
Finch Capital 2018 Predictions Summary
Aman Ghei
 

Similar to Pitch deck (20)

Cento Southeast Asia Tech Investment FY2022
Cento Southeast Asia Tech Investment FY2022Cento Southeast Asia Tech Investment FY2022
Cento Southeast Asia Tech Investment FY2022
 
state-of-india-fintech-union-2022.pdf
state-of-india-fintech-union-2022.pdfstate-of-india-fintech-union-2022.pdf
state-of-india-fintech-union-2022.pdf
 
South Korea VC Report 2022.pdf
South Korea VC Report 2022.pdfSouth Korea VC Report 2022.pdf
South Korea VC Report 2022.pdf
 
KMPG pulse-of-fintech H2 2022 - Global Analysis
KMPG pulse-of-fintech H2 2022 - Global AnalysisKMPG pulse-of-fintech H2 2022 - Global Analysis
KMPG pulse-of-fintech H2 2022 - Global Analysis
 
6127a0965afd7898a34f69dadc24b8d17ada0b1b
6127a0965afd7898a34f69dadc24b8d17ada0b1b6127a0965afd7898a34f69dadc24b8d17ada0b1b
6127a0965afd7898a34f69dadc24b8d17ada0b1b
 
DealBook of Ukraine: 2021 edition
DealBook of Ukraine: 2021 editionDealBook of Ukraine: 2021 edition
DealBook of Ukraine: 2021 edition
 
The State of European Fintech 2020
The State of European Fintech 2020The State of European Fintech 2020
The State of European Fintech 2020
 
Ukraine Deal Review 2021. Tech Venture Capital and Private Equity deals of Uk...
Ukraine Deal Review 2021. Tech Venture Capital and Private Equity deals of Uk...Ukraine Deal Review 2021. Tech Venture Capital and Private Equity deals of Uk...
Ukraine Deal Review 2021. Tech Venture Capital and Private Equity deals of Uk...
 
2021 MENA Venture Investor Ranking Report (SAMPLE)
2021 MENA Venture Investor Ranking Report (SAMPLE)2021 MENA Venture Investor Ranking Report (SAMPLE)
2021 MENA Venture Investor Ranking Report (SAMPLE)
 
IDFC-FIRST-Bank-Investor-Presentation-Q4-FY23.pdf
IDFC-FIRST-Bank-Investor-Presentation-Q4-FY23.pdfIDFC-FIRST-Bank-Investor-Presentation-Q4-FY23.pdf
IDFC-FIRST-Bank-Investor-Presentation-Q4-FY23.pdf
 
Lithium Pitch Deck | Community
Lithium Pitch Deck | Community Lithium Pitch Deck | Community
Lithium Pitch Deck | Community
 
State Of European FinTech: Current Trends & Prediction 2017
State Of European FinTech: Current Trends & Prediction 2017State Of European FinTech: Current Trends & Prediction 2017
State Of European FinTech: Current Trends & Prediction 2017
 
White Star Capital SEA 2022 Venture Capital Landscape
White Star Capital SEA 2022 Venture Capital LandscapeWhite Star Capital SEA 2022 Venture Capital Landscape
White Star Capital SEA 2022 Venture Capital Landscape
 
FT Partners Research - Understanding the Impact of COVID-19 on FinTech
FT Partners Research - Understanding the Impact of COVID-19 on FinTechFT Partners Research - Understanding the Impact of COVID-19 on FinTech
FT Partners Research - Understanding the Impact of COVID-19 on FinTech
 
Ecobank annual report 2004
Ecobank annual report 2004Ecobank annual report 2004
Ecobank annual report 2004
 
AVentures DealBook 2020
AVentures DealBook 2020AVentures DealBook 2020
AVentures DealBook 2020
 
AVentures DealBook 2019
AVentures DealBook 2019AVentures DealBook 2019
AVentures DealBook 2019
 
Ufrate chinese accelerators 2016 08-26
Ufrate chinese accelerators 2016 08-26Ufrate chinese accelerators 2016 08-26
Ufrate chinese accelerators 2016 08-26
 
Finch Capital predictions 2018 - Summary
Finch Capital predictions 2018 - SummaryFinch Capital predictions 2018 - Summary
Finch Capital predictions 2018 - Summary
 
Finch Capital 2018 Predictions Summary
Finch Capital 2018 Predictions SummaryFinch Capital 2018 Predictions Summary
Finch Capital 2018 Predictions Summary
 

More from JohnDough52

TAccounts.pdf
TAccounts.pdfTAccounts.pdf
TAccounts.pdf
JohnDough52
 
Culture Book_2023.pdf
Culture Book_2023.pdfCulture Book_2023.pdf
Culture Book_2023.pdf
JohnDough52
 
DBS Group Holdings 2015
DBS Group Holdings 2015DBS Group Holdings 2015
DBS Group Holdings 2015
JohnDough52
 
IT satisfaction.pdf
IT satisfaction.pdfIT satisfaction.pdf
IT satisfaction.pdf
JohnDough52
 
HUNFINTECH-2022
HUNFINTECH-2022HUNFINTECH-2022
HUNFINTECH-2022
JohnDough52
 
Hungarian electric battery
Hungarian electric batteryHungarian electric battery
Hungarian electric battery
JohnDough52
 

More from JohnDough52 (6)

TAccounts.pdf
TAccounts.pdfTAccounts.pdf
TAccounts.pdf
 
Culture Book_2023.pdf
Culture Book_2023.pdfCulture Book_2023.pdf
Culture Book_2023.pdf
 
DBS Group Holdings 2015
DBS Group Holdings 2015DBS Group Holdings 2015
DBS Group Holdings 2015
 
IT satisfaction.pdf
IT satisfaction.pdfIT satisfaction.pdf
IT satisfaction.pdf
 
HUNFINTECH-2022
HUNFINTECH-2022HUNFINTECH-2022
HUNFINTECH-2022
 
Hungarian electric battery
Hungarian electric batteryHungarian electric battery
Hungarian electric battery
 

Recently uploaded

Pushing the limits of ePRTC: 100ns holdover for 100 days
Pushing the limits of ePRTC: 100ns holdover for 100 daysPushing the limits of ePRTC: 100ns holdover for 100 days
Pushing the limits of ePRTC: 100ns holdover for 100 days
Adtran
 
How to Get CNIC Information System with Paksim Ga.pptx
How to Get CNIC Information System with Paksim Ga.pptxHow to Get CNIC Information System with Paksim Ga.pptx
How to Get CNIC Information System with Paksim Ga.pptx
danishmna97
 
GraphSummit Singapore | The Art of the Possible with Graph - Q2 2024
GraphSummit Singapore | The Art of the  Possible with Graph - Q2 2024GraphSummit Singapore | The Art of the  Possible with Graph - Q2 2024
GraphSummit Singapore | The Art of the Possible with Graph - Q2 2024
Neo4j
 
20240607 QFM018 Elixir Reading List May 2024
20240607 QFM018 Elixir Reading List May 202420240607 QFM018 Elixir Reading List May 2024
20240607 QFM018 Elixir Reading List May 2024
Matthew Sinclair
 
GraphSummit Singapore | Graphing Success: Revolutionising Organisational Stru...
GraphSummit Singapore | Graphing Success: Revolutionising Organisational Stru...GraphSummit Singapore | Graphing Success: Revolutionising Organisational Stru...
GraphSummit Singapore | Graphing Success: Revolutionising Organisational Stru...
Neo4j
 
Observability Concepts EVERY Developer Should Know -- DeveloperWeek Europe.pdf
Observability Concepts EVERY Developer Should Know -- DeveloperWeek Europe.pdfObservability Concepts EVERY Developer Should Know -- DeveloperWeek Europe.pdf
Observability Concepts EVERY Developer Should Know -- DeveloperWeek Europe.pdf
Paige Cruz
 
Mind map of terminologies used in context of Generative AI
Mind map of terminologies used in context of Generative AIMind map of terminologies used in context of Generative AI
Mind map of terminologies used in context of Generative AI
Kumud Singh
 
How to use Firebase Data Connect For Flutter
How to use Firebase Data Connect For FlutterHow to use Firebase Data Connect For Flutter
How to use Firebase Data Connect For Flutter
Daiki Mogmet Ito
 
Driving Business Innovation: Latest Generative AI Advancements & Success Story
Driving Business Innovation: Latest Generative AI Advancements & Success StoryDriving Business Innovation: Latest Generative AI Advancements & Success Story
Driving Business Innovation: Latest Generative AI Advancements & Success Story
Safe Software
 
GraphSummit Singapore | The Future of Agility: Supercharging Digital Transfor...
GraphSummit Singapore | The Future of Agility: Supercharging Digital Transfor...GraphSummit Singapore | The Future of Agility: Supercharging Digital Transfor...
GraphSummit Singapore | The Future of Agility: Supercharging Digital Transfor...
Neo4j
 
Serial Arm Control in Real Time Presentation
Serial Arm Control in Real Time PresentationSerial Arm Control in Real Time Presentation
Serial Arm Control in Real Time Presentation
tolgahangng
 
Essentials of Automations: The Art of Triggers and Actions in FME
Essentials of Automations: The Art of Triggers and Actions in FMEEssentials of Automations: The Art of Triggers and Actions in FME
Essentials of Automations: The Art of Triggers and Actions in FME
Safe Software
 
Goodbye Windows 11: Make Way for Nitrux Linux 3.5.0!
Goodbye Windows 11: Make Way for Nitrux Linux 3.5.0!Goodbye Windows 11: Make Way for Nitrux Linux 3.5.0!
Goodbye Windows 11: Make Way for Nitrux Linux 3.5.0!
SOFTTECHHUB
 
RESUME BUILDER APPLICATION Project for students
RESUME BUILDER APPLICATION Project for studentsRESUME BUILDER APPLICATION Project for students
RESUME BUILDER APPLICATION Project for students
KAMESHS29
 
20240605 QFM017 Machine Intelligence Reading List May 2024
20240605 QFM017 Machine Intelligence Reading List May 202420240605 QFM017 Machine Intelligence Reading List May 2024
20240605 QFM017 Machine Intelligence Reading List May 2024
Matthew Sinclair
 
TrustArc Webinar - 2024 Global Privacy Survey
TrustArc Webinar - 2024 Global Privacy SurveyTrustArc Webinar - 2024 Global Privacy Survey
TrustArc Webinar - 2024 Global Privacy Survey
TrustArc
 
Building Production Ready Search Pipelines with Spark and Milvus
Building Production Ready Search Pipelines with Spark and MilvusBuilding Production Ready Search Pipelines with Spark and Milvus
Building Production Ready Search Pipelines with Spark and Milvus
Zilliz
 
Infrastructure Challenges in Scaling RAG with Custom AI models
Infrastructure Challenges in Scaling RAG with Custom AI modelsInfrastructure Challenges in Scaling RAG with Custom AI models
Infrastructure Challenges in Scaling RAG with Custom AI models
Zilliz
 
“Building and Scaling AI Applications with the Nx AI Manager,” a Presentation...
“Building and Scaling AI Applications with the Nx AI Manager,” a Presentation...“Building and Scaling AI Applications with the Nx AI Manager,” a Presentation...
“Building and Scaling AI Applications with the Nx AI Manager,” a Presentation...
Edge AI and Vision Alliance
 
Mariano G Tinti - Decoding SpaceX
Mariano G Tinti - Decoding SpaceXMariano G Tinti - Decoding SpaceX
Mariano G Tinti - Decoding SpaceX
Mariano Tinti
 

Recently uploaded (20)

Pushing the limits of ePRTC: 100ns holdover for 100 days
Pushing the limits of ePRTC: 100ns holdover for 100 daysPushing the limits of ePRTC: 100ns holdover for 100 days
Pushing the limits of ePRTC: 100ns holdover for 100 days
 
How to Get CNIC Information System with Paksim Ga.pptx
How to Get CNIC Information System with Paksim Ga.pptxHow to Get CNIC Information System with Paksim Ga.pptx
How to Get CNIC Information System with Paksim Ga.pptx
 
GraphSummit Singapore | The Art of the Possible with Graph - Q2 2024
GraphSummit Singapore | The Art of the  Possible with Graph - Q2 2024GraphSummit Singapore | The Art of the  Possible with Graph - Q2 2024
GraphSummit Singapore | The Art of the Possible with Graph - Q2 2024
 
20240607 QFM018 Elixir Reading List May 2024
20240607 QFM018 Elixir Reading List May 202420240607 QFM018 Elixir Reading List May 2024
20240607 QFM018 Elixir Reading List May 2024
 
GraphSummit Singapore | Graphing Success: Revolutionising Organisational Stru...
GraphSummit Singapore | Graphing Success: Revolutionising Organisational Stru...GraphSummit Singapore | Graphing Success: Revolutionising Organisational Stru...
GraphSummit Singapore | Graphing Success: Revolutionising Organisational Stru...
 
Observability Concepts EVERY Developer Should Know -- DeveloperWeek Europe.pdf
Observability Concepts EVERY Developer Should Know -- DeveloperWeek Europe.pdfObservability Concepts EVERY Developer Should Know -- DeveloperWeek Europe.pdf
Observability Concepts EVERY Developer Should Know -- DeveloperWeek Europe.pdf
 
Mind map of terminologies used in context of Generative AI
Mind map of terminologies used in context of Generative AIMind map of terminologies used in context of Generative AI
Mind map of terminologies used in context of Generative AI
 
How to use Firebase Data Connect For Flutter
How to use Firebase Data Connect For FlutterHow to use Firebase Data Connect For Flutter
How to use Firebase Data Connect For Flutter
 
Driving Business Innovation: Latest Generative AI Advancements & Success Story
Driving Business Innovation: Latest Generative AI Advancements & Success StoryDriving Business Innovation: Latest Generative AI Advancements & Success Story
Driving Business Innovation: Latest Generative AI Advancements & Success Story
 
GraphSummit Singapore | The Future of Agility: Supercharging Digital Transfor...
GraphSummit Singapore | The Future of Agility: Supercharging Digital Transfor...GraphSummit Singapore | The Future of Agility: Supercharging Digital Transfor...
GraphSummit Singapore | The Future of Agility: Supercharging Digital Transfor...
 
Serial Arm Control in Real Time Presentation
Serial Arm Control in Real Time PresentationSerial Arm Control in Real Time Presentation
Serial Arm Control in Real Time Presentation
 
Essentials of Automations: The Art of Triggers and Actions in FME
Essentials of Automations: The Art of Triggers and Actions in FMEEssentials of Automations: The Art of Triggers and Actions in FME
Essentials of Automations: The Art of Triggers and Actions in FME
 
Goodbye Windows 11: Make Way for Nitrux Linux 3.5.0!
Goodbye Windows 11: Make Way for Nitrux Linux 3.5.0!Goodbye Windows 11: Make Way for Nitrux Linux 3.5.0!
Goodbye Windows 11: Make Way for Nitrux Linux 3.5.0!
 
RESUME BUILDER APPLICATION Project for students
RESUME BUILDER APPLICATION Project for studentsRESUME BUILDER APPLICATION Project for students
RESUME BUILDER APPLICATION Project for students
 
20240605 QFM017 Machine Intelligence Reading List May 2024
20240605 QFM017 Machine Intelligence Reading List May 202420240605 QFM017 Machine Intelligence Reading List May 2024
20240605 QFM017 Machine Intelligence Reading List May 2024
 
TrustArc Webinar - 2024 Global Privacy Survey
TrustArc Webinar - 2024 Global Privacy SurveyTrustArc Webinar - 2024 Global Privacy Survey
TrustArc Webinar - 2024 Global Privacy Survey
 
Building Production Ready Search Pipelines with Spark and Milvus
Building Production Ready Search Pipelines with Spark and MilvusBuilding Production Ready Search Pipelines with Spark and Milvus
Building Production Ready Search Pipelines with Spark and Milvus
 
Infrastructure Challenges in Scaling RAG with Custom AI models
Infrastructure Challenges in Scaling RAG with Custom AI modelsInfrastructure Challenges in Scaling RAG with Custom AI models
Infrastructure Challenges in Scaling RAG with Custom AI models
 
“Building and Scaling AI Applications with the Nx AI Manager,” a Presentation...
“Building and Scaling AI Applications with the Nx AI Manager,” a Presentation...“Building and Scaling AI Applications with the Nx AI Manager,” a Presentation...
“Building and Scaling AI Applications with the Nx AI Manager,” a Presentation...
 
Mariano G Tinti - Decoding SpaceX
Mariano G Tinti - Decoding SpaceXMariano G Tinti - Decoding SpaceX
Mariano G Tinti - Decoding SpaceX
 

Pitch deck

  • 1. Investor Presentation 3Q 2021 The emerging market fintech investor
  • 2. ESG: Key governance milestones - redomestication to Sweden complete, Board strenghtened Our recent AGM delivered some key decisions and changes to the VEF story, which continue our positive ESG drive. First, the decision to move our holding company to Sweden, where we are listed, from Bermuda, was ratified and the process was successfully completed in early July. Coupled with this, we are very excited to welcome new board member Hanna Loikkanen to the VEF board and family. Recent highlights Portfolio holdings in focus - Juspay, Jumo and TGo Beyond the current big 2 (Creditas and Konfio), we continue to gain confidence in these 3 holdings, which sit in the top half (size-wise) of our portfolio, are delivering strong underlying trends and are well placed to secure additional capital to drive future growth , as proven by TGo’s recent $50mn Series C. Konfio raised USD 235 mln Series E in 2 instalments in 2021 Through June and September, Konfio raised a total of $235mln, as it looks to achieve its goal of becoming Mexico’s number 1 digital bank for SMEs though organic and inorganic means. VEF invested an additional ~$29mln as part of the raise. Creditas – M&A and partnerships providing a fresh leg of growth 2021 has been an exceptionally strong YTD for Creditas post 4Q20 fundraise as evidenced by reported quarterly headline metrics. In addition to the core growth, 2021 was defined by a number of acquisitions and partnerships that should add fuel to an already strong organic growth story. A third investment in India, a first in the embedded fintech space – welcome Blackbuck In July’21, VEF made it’s third investment in India and invested USD 10 mln into Blackbuck, India’s largest trucking platform. This is our first foray into the embedded fintech space, about which we are becoming increasingly excited. 2 Successful recent capital raise - $102 mln in Aug-21 We successfully raised $102 mln of additional capital to continue investing in our mandate of EM Fintech. It was our biggest raise to date and supported by both our current shareholder base and a host of quality new investor names VEF Shares have been trading at a premium to NAV for the longest period since inception A combination of growing track record, portfolio composition and its direction of travelled overlayed with increased investor relations and liquidity in our shares, have all supported the share price in this window for VEF
  • 3. Introduction to VEF – The Emerging Market Fintech Investor 1 VEF’s Portfolio 2 Investment Opportunities 3 ESG 4 Appendix 5 3
  • 4. The emerging market fintech investor Riding one of the strongest multi-year secular growth trends in some of the world’s fastest-growing markets Emerging market specialists • Extensive Emerging Markets investing experience • David Nangle, CEO: 20+ years EM financial services • Alexis Koumoudos, CIO: 10+ years EM investing • Execution of 20+ private transactions across Emerging Markets Fintech expertise Listed investment company • VEF is listed on Nasdaq First North Growth Market in the Nordics • A unique access vehicle: Opportunity to access fast-growing private fintech assets in the public market 1Including board seat in Iyzico (now exited); NAV post private placement of c. SEK 885M (c. $102M) in Aug-21 and share price as of 15-Oct-21 • Deep sector knowledge built through evaluation of over 600 deals and sitting on 121 board seats across all lines of fintech • Unique global fintech lens • Strong track record of value creation with 2 successful exits in Russia’s and Turkey’s leading fintech companies, Tinkoff and iyzico 25,8% 35,5% IRR (NAV per share) IRR (Price per share) $554M NAV (3Q21) 18 Investments since inception $98M Cash & Liquid Investments 3 Number of exits 37% 25% 8% 5% 3% 3% 1% 18% Brazil Mexico Emerging Europe Russia India Africa Pakistan 3Q21 NAV split 4 * As on 15-Oct-21 since inception Cash & equivalents
  • 5. Clear investment approach coupled with deep fintech expertise SECTOR We target all lines of financial services inclusive of payments, credit and savings/investments. The “right” target sector is very market- dependent. GEOGRAPHY Within emerging markets, we focus on the more populous and scalable markets, referenced against competition for opportunities and point in the cycle. MINORITY STAKES AND A BOARD SEAT VEF targets sizeable minority stakes of 10–20% with board representation in its portfolio companies. We are active and supportive shareholders. UNIQUE FINTECH INVESTMENT There are very few ways to play the growing fintech investment theme in public markets and even less in the emerging world. VEF is a unique access asset in this regard. • Offline • Online • Mobile • Remittances • Consumer • SME • Secured • Unsecured • Digital Banks • Personal Finance Managers • Mobile Wallets • Wealth Management • Roboadvisors • Digital Brokers • Accounting SaaS • HR & Payroll Management • BNPL • Online comparison and brokerage • Full-stack digital CREDIT PAYMENTS PERSONAL FINANCE INVESTMENTS EMBEDDED FINTECH INSURTECH Targeted investment approach with a clear mandate … … and deep expertise across the fintech spectrum = VEF investments 5
  • 6. A diversified portfolio across scale emerging markets VEF has backed entrepreneurs across the emerging world since inception in 2015 Russia – 3% Emerging Europe – 5% Africa - 3% Pakistan – 1% Brazil – 37% Mexico – 25% India – 8% VEF investments *% of 3Q21 VEF NAV (incl. cash) Mexico Brazil Africa Emerging Europe Russia 6 Pakistan India ** Cash and equivalents comprise 18% of 3Q21 NAV
  • 7. Portfolio evolution through 3Q21 • We have 15 holdings as of 3Q21, diversified by geography, business type and stage of development. • In 3Q21, we made one new investment: USD 10 mln in Blackbuck, India’s largest online trucking platform. This marks our first embedded-fintech play. • We also made a follow-on investment of USD 9.3 mln in Konfio. Portfolio focus & concentration • Brazil and broader LatAm account for 37%/62% of our geographic spread. • Creditas is our clear largest holding at 31% of total NAV and continuing to compound off a larger base. • Top 2 holdings are 55% / top 5 are 69% of NAV. Cash position • USD 98 mln cash position post private placement in Aug‘21. Pipeline • Pipeline busier then ever (we have seen 258 deals YTD Oct-21 vis-à-vis 131 in full-year 2020) and we expect to convert more new investments in the coming months. Portfolio commentary 30,5% 24,5% 5,3% 5,2% 3,3% 2,5% 2,2% 2,2% 6,8% 17,5% Cash & liquid assets VEF portfolio NAV as of 30-Sep-2021 USD 553.6 mln Others (<2% of NAV)1 1 Others include investments in Magnetis, Blackbuck, Rupeek, Finja, Xerpa, Abhi and Minu which contribute <2% of NAV as of 3Q21 2 Unadjusted for ~$1m of other net liabilities 7
  • 8. Strong track record of investing in benchmark private fintech names across EM We are now present in one of top 3 private fintech assets each in Brazil, Mexico & India. We have a track record of backing and successfully exiting fintech champions in Russia and Turkey. VEF exits Mexico Market leader in digital SME financial services. Brazil Financial services ecosystem built around core fixed assets; one of the few unicorns in Brazil. Turkey Leading digital payments player successfully exited yielding ~3x CoC and ~57% IRR – Turkey’s biggest fintech exit. Russia Russia’a largest digital bank successfully exited yielding ~6x CoC and ~65% IRR. Number 1 digital bank in Russia/EM. Current investments in 2 of LatAm’s fintech champions Successful exits from fintech leaders in Russia & Turkey India Asset-backed digital lending platform beginning with gold- backed loans. Recent investments in India’s fastest growing tech start-up* and a leading digital payments company * Accordoing to Deloitte Touche Tohmatsu India’s ‘Technology Fast 50’ 2020 8 India India’s leading mobile payments platform for online merchants. VEF current investments comprising 61% of NAV
  • 9. -60% -50% -40% -30% -20% -10% 0% 10% 20% 30% 40% 50% Dec-15 Jul-16 Feb-17 Sep-17 Apr-18 Nov-18 Jun-19 Jan-20 Aug-20 Mar-21 Oct-21 Premium / (discount) to NAV Premium/(Discount) to NAV1 Key figures Share price, NAV/share and the premium/discount NAV/share & share price development $554M NAV (3Q21) 0,0 1,0 2,0 3,0 4,0 5,0 6,0 7,0 Dec-15 Jul-16 Feb-17 Sep-17 Apr-18 Nov-18 Jun-19 Jan-20 Aug-20 Mar-21 Oct-21 NAV/Share (SEK) Share Price (SEK) SEK 4.64 NAV/share (3Q21) SEK 6.29 Share price (15-Oct-21) $759M Market cap (15-Oct-21) 9
  • 10. Strong history of value creation since inception 2 successful exits in 2019 with IRRs >55%, and NAV per share IRR of 25% Focus Digital Bank Founded 2007 Key region Russia Year of investment 2015 Amount invested $19M Proceeds $117M Investment overview • A leading fintech innovator in Russia, Tinkoff Bank is one of the world’s largest online banks with 15m customers today and offers a full range of financial services for individuals and businesses via its mobile app and web interface. • The company was founded in 2006 by Oleg Tinkoff. • VEF invested (via spin-off from VNV) in Tinkoff in 2015. Exit Overview Key facts 19 117 Total proceeds ($M) Amount invested ($M) +65% IRR Date entered Jun-15 Date exited Feb-19 Holding period 3.6 years IRR 65% CoC 6.1x Investment overview • Iyzico is one of the fastest growing fintech players in Turkey, offering digital payment solutions to online sellers and shoppers. • The company was founded in 2013 by German-born Turks Barbaros Özbuğutu and Tahsin Isın, who had moved from Germany to Turkey to set up the business. • VEF invested in Iyzico in 2017 and sold its stake to Naspers in December 2019. Exit Overview 11 35 Total proceeds ($M) Amount invested ($M) +57% IRR Date entered Jan-17 Date exited Dec-19 Holding period 2.6 years IRR 57% CoC 3.2x Focus Payments Founded 2013 Key region Turkey Year of investment 2017 Amount invested $11M Proceeds $35M Key facts 10
  • 11. VEF shareholder structure ¹ Holding as per the latest notification to the Company. Based on Euroclear Sweden AB data and holdings known to the company. Including foreign nominees. * The Company has 1,000,000 outstanding warrants and three LTIP program outstanding that could give rise to a maximum of 49,375,925 new shares. 11 Owner Holdings, SDRs Holding % Ruane, Cunniff & Goldfarb 1 217,832,109 20.9% Libra Fund 1 124,198,165 11.9% Fidelity Investments (FMR) 95,139,868 9.1% Swedbank Robur Funds 92,874,245 8.9% Wellington Management 1 49,585,580 4.8% Fidelity International (FIL) 26,265,135 2.5% Highclere 20,310,000 1.9% Robeco 20,000,000 1.9% Avanza Pension 13,840,047 1.3% GADD & Cie S.A. 13,280,957 1.3% Svenska Handelsbanken AB for PB 10,100,000 1.0% Atlant Funds 9,241,952 0.9% Top 12 Institutional Holders 692,668,058 66.5% Others 349,121,920 33.5% Total Shares 1,042,289,978 100.0% Shares held by management 24,566,890 2.4%
  • 12. Strong team with significant EM/fintech experience David Nangle CEO • Experience: 20+ years EM FS • Renaissance Capital Head of Research and Financials Sector Research • ING Barings Head of EMEA Financials Research • Education: Degree in B. Comm Intl. (French) from University College Dublin Alexis Koumoudos CIO • Experience: 10 years EM investing and 5 years entreprenuer • Partner at Skyline Capital Management, an emerging market focused hedge fund • Education: MSc in Quant Finance & BA in Business Fin. from Durham University Shashi Shekhar Mahajan Investment Associate • Experience: 5+ years of EM private equity investing and investment banking • PE professional at True North Managers India, a growth buyout PE managing $3B • IB Analyst at JP Morgan India • Education: MBA from London Business School and BEngineering from BITS Pilani Henrik Stenlund CFO Experience: 15+ years • COO of Pomegranate Investment, VNV • CEO, Strix Television • Education: MSc in Business and Economics Cathal Carroll Investment Manager • Experience: 15 years+ experience in the financial services industry across DM and EM • Co-founder of Carraighill, an independent research firm focused on global financial service companies Éire Smith Investment Associate • Joined VEF straight out of university • Education: BA in Business and Economics from Trinity College Dublin Helena Caan Mattsson General Counsel / Head of Sustainability Experience: Extensive background in M&A, private equity and corporate law • Associate at Cederquist, Baker & McKenzie, Roschier • Education: LL.M form Stockholm University & LL.M in Business Law from Jönköping International Business School Elisabet Hultén Deputy CFO Experience: 10+ years of several roles within finance function in Big Four • Business Controller, DIBS Payment Services • Education: MSc in Business Administration from Gothenburg School of Economics and Law 12
  • 13. Introduction to VEF – The Emerging Market Fintech Investor 1 VEF’s Portfolio 2 Investment Opportunities 3 ESG 4 Appendix 5 13
  • 14. VEF portfolio summary Company Country Segment Inv. date Ownership % Invested amount (USD mln) Sep’21 fair value (USD mln) Brazil Asset focused Ecosystem Dec-17 8.4% 73.4 169.0 Mexico Diversified FS for Mexican SMBs Jun-18 10.4% 56.5 135.6 Emerging Europe Cross-Border Remittances Jun-16 12.3% 13.9 29.2 India Mobile Payments Platform Apr-20 9.9% 13.0 28.7 Africa Mobile Money Marketplace Oct-15 4.8% 14.6 18.4 Russia Payments & Consumer Credit Sep-15 23.0% 6.7 13.8 Brazil Consumer Credit Marketplace Mar-16 18.4% 4.1 12.3 Brazil Accounting SaaS provider for SMEs & accountants Apr-17 20.1% 6.5 11.9 Brazil Digital Investments Sep-17 17.5% 5.7 10.5 India Online Trucking Platform Jul-21 1.0% 10.0 10.0 Pakistan Digital Lending & Payments Jul-16 22.0% 2.9 7.4 India Secured Lending Platform Mar-21 1.4% 7.0 7.0 Brazil HR & Payroll Management Sep-19 16.0% 8.5 1.3 Pakistan Salary on Demand Jun-21 15.0% 0.9 0.9 Mexico Salary on Demand Mar-21 1.2% 0.5 0.5 USD 456 mln (excl. cash and liquid assets) 14 * As of 30th Sep 2021
  • 15. A Selection of VEF’s Key Geographies and Portfolio Holdings 2 Brazil A. Mexico B. India C. Emerging Europe D. 15
  • 16. Brazil is the most obvious fintech opportunity globally A SCALE MARKET OPPORTUNITY With a population of over 200 million people, Brazil is one of the world’s largest economies, and the kind of scale emerging market we like to invest in. ONE OF THE MOST ‘ONLINE’ MARKETS IN THE WORLD Brazil is one of the most ‘online’ markets in the world with high smartphone and internet penetration, a growing ecommerce market and strong tech adoption. Brazilian fintech adoption saw a 60% increase between 2017 and 2019. OLIGOPOLISTIC BANKING SECTOR AND SUPERNATURAL REVENUE ECONOMICS Brazil’s banking market is highly concentrated, with the top five banks holding over 80% of total loans in the system, while fees and interest rates are some of the highest anywhere in the world. It is an immense revenue pool for fintech to attack. SUPPORTIVE REGULATORY LANDSCAPE The Central Bank of Brazil is supportive of the fintech ecosystem as a way of leveling the playing field and improving the financial wellbeing of the average Brazilian. Not always the case across the emerging world. PEOPLE AND ECOSYSTEM We have found many strong entrepreneurs and teams in Brazil and a very supportive VC and investment ecosystem into which to invest and partner. MULTIPLE EXIT ROUTES WITH A HISTORY OF VALUE CREATION Brazil has a healthy exit opportunity set through M&A and IPO. The Brazilian fintech ecosystem has seen massive exits of benchmark companies PagSeguro, Stone, Banco Inter and XP, with other multi-billion-dollar acquisitions across the tech landscape. WELL-BANKED ECOSYSTEM Unlike many emerging markets, the Brazilian banking system is first world in many aspects, and its population is comfortable in the use of a broad array of financial products. It is less a case of financial education and one of offering better products at a better price and user experience than incumbents. 16
  • 17. Brazil constitutes 37% of VEF’s portfolio with 5 active investments 30,5% 2,2% 2,2% 1,9% 0,2% 63,0% % of 3Q21 total portfolio NAV 37% Remaining portfolio 17
  • 18. - 100 200 300 - 50 100 150 200 250 300 Q1-16 Q2-16 Q3-16 Q4-16 Q1-17 Q2-17 Q3-17 Q4-17 Q1-18 Q2-18 Q3-18 Q4-18 Q1-19 Q2-19 Q3-19 Q4-19 Q1-20 Q2-20 Q3-20 Q4-20 Q1-21 Q2-21 Q3-21 Recurring revenue Upfront revenue Creditas Brazil’s leading digital-first secured lending platform Focus Asset Focused Ecosystem Founded 2012 Key region Brazil Share of NAV: 30.5% Key facts Fair value USD 169.0 mln Investment USD 73.4 mln Ownership stake 8.4% Year of investment 2017 +R$1.1 BILLION in annualized revenues 269k ACTIVE customers R$2.9bn LENDING portfolio 55% GROSS MARGIN of credit portfolio Quarterly revenue 2013-2021 – 65% of revenue is recurrent As of 3Q21, Creditas’ loan portfiolio reached BRL 2.9 bln up 181% yoy, with 3Q21 revenues of BRL 257 mln up 50%+ QoQ and over 3x YoY. One of LatAm’s leading private fintech plays, Creditas is on a clear path towards IPO. Creditas is a building an asset focused ecosystem that supports customers in 3 essential aspects; living (home), mobility (transport) and earning (salary) by providing fintech, insuretech and consumer solutions. 01 Collateral based lending is the core monetisation tool and allows Creditas to build an eduring client relationship at low rates. Core product suite is loans against home, auto and payroll today with broader streams like insurance in the offering. 02 Creditas in brief Creditas in figures R$ million 18
  • 19. Credit Portfolio (R$ million) New Loan Origination (R$ million) 3 8 68 95 127 171 216256 311 387 535 679 892916 1 043 1 255 1 545 2 015 2 921 - 500 1 000 1 500 2 000 2 500 3 000 3 500 Q1-17 Q2-17 Q3-17 Q4-17 Q1-18 Q2-18 Q3-18 Q4-18 Q1-19 Q2-19 Q3-19 Q4-19 Q1-20 Q2-20 Q3-20 Q4-20 Q1-21 Q2-21 Q3-21 Revenue (R$ million) Net Income (R$ million) Creditas Creditas’ strong business model is reflected well in its financial metrics 2 5 17 30 39 50 59 58 78 102 162 189 268 96 223 313 421 613 938 - 100 200 300 400 500 600 700 800 900 1 000 Q1-17 Q2-17 Q3-17 Q4-17 Q1-18 Q2-18 Q3-18 Q4-18 Q1-19 Q2-19 Q3-19 Q4-19 Q1-20 Q2-20 Q3-20 Q4-20 Q1-21 Q2-21 Q3-21 1 2 4 8 11 15 17 27 24 33 55 67 80 71 81 104 124 170 257 - 50 100 150 200 250 300 - 50 100 150 200 250 300 Q1-16 Q2-16 Q3-16 Q4-16 Q1-17 Q2-17 Q3-17 Q4-17 Q1-18 Q2-18 Q3-18 Q4-18 Q1-19 Q2-19 Q3-19 Q4-19 Q1-20 Q2-20 Q3-20 Q4-20 Q1-21 Q2-21 Q3-21 Recurring revenue Upfront revenue (1) (3) (3) (3) (4) (6) (7) 5 (12)(15) (20) 9 (27) (32) (75)(70) (52) (40) (43) (57) (65) (70) (81) (90) (80) (70) (60) (50) (40) (30) (20) (10) - 10 20 Q1-16 Q2-16 Q3-16 Q4-16 Q1-17 Q2-17 Q3-17 Q4-17 Q1-18 Q2-18 Q3-18 Q4-18 Q1-19 Q2-19 Q3-19 Q4-19 Q1-20 Q2-20 Q3-20 Q4-20 Q1-21 Q2-21 Q3-21 CAGR YTD 21 YoY 138% CY17-20 139% CAGR YTD 21 YoY 181% CY17-20 142% CAGR YTD 21 YoY 233% CY17-20 155% 19
  • 20. Creditas, product suite rollout and value creation history With a loan book now standing at BRL 2.9b and significant strides in the ibuyer space YTD, we see considerable upside in Creditas in the coming months 3Q20 4Q20 1H21 3Q21 VEF raises $61m in share placement Creditas $255m Series E at $1.75b valuation VEF invests $25m VEF share price and NAV reach record highs Creditas acquires Bcredi Creditas invests in Voltz,; a Brazilian electric motorcycle startup. Creditas acquires Minuto Seguros, a Brazilian digital insurance platform, strengthening its car platform Creditas acquires Volanty, a used car platform; growing 2x pa and broadening asset focused ecosystem on path to IPO. Creditas partners with NuBank, world’s largest neobank. Creditas will offer its products to Nubank customers in Brazil. VEF NAV $268m $388m $404m $554m Value creation in Creditas continues; currently marked to the last round post-money valuation of $1.75b (Dec 2020) 20 25,0 25,0 73,2 50,4 80,7 102,1 169,0 169,0 169,0 169,0 2017 2018 2Q19 1Q20 2Q20 3Q20 4Q20 1Q21 2Q21 3Q21 New Investment (USD m) Initial Investment Series C ($25m) Series D ($23.4m) Series E ($25m) Mark-to-model Latest transaction
  • 21. A Selection of VEF’s Key Geographies and Portfolio Holdings 2 Brazil A. Mexico B. India C. Emerging Europe D. 21
  • 22. Mexico is a scale market with a large underserved SME and consumer segment Mexico constitutes 25% of VEF’s portfolio SME and Financial Services Serving the underserved small business community • 7 million SMEs in Mexico, <10% of which have access to financing • Banks focus predominantly on serving large corporate clients and high-end retail • Mandatory electronic invoicing (CFDI) provides unique centralized data to analyze SMEs • SME loans stand at $22B annually and set to grow dramatically over the coming years SME Credit and Financial Services 25% VEF Investments • Massive scale of the opportunity with an addressable market of 32.3m workers in the formal economy • 75% of the population lives paycheck to paycheck and lacks savings to cover unexpected expenses • Access to traditional forms of credit is extremely limited and hard to access • ~$1.7b market size for the pay-on-demand category, growing to $3.2b to include other employee wellness and benefits products Employee Wellness and Benefits Employee Wellness Provides instant access to earned wages 22
  • 23. Konfio Digital banking and software tools for Mexico’s SMEs Konfio has broadened its product suite to offer an arrary of SaaS and payment tools, and also offers lending as a service to some of Mexico’s largest FMCG companies. Mexico is Latin America’s 2nd largest market with a population of 127M (number 10 globally) and over 7M SMEs. Konfio focuses on the top-end credit of the small business segment which is viewed as a USD 45 bln opportunity. Recently raised a USD 110 mln Series E2 funding round becoming Mexico’s latest unicorn. Round was led by Tarsadia, where VEF invested an additional USD 9.3 mln. Konfio builds digital banking and software tools to boost SME growth and productivity in Mexico. Konfio leverages tech, big data and recent Mexican fiscal control to offer loans to creditworthy SMEs historically underserved by traditional banks. CAGR 2017-2020 Revenue: 146% Gross portfolio: 137% Focus Diversified financial services for Mexican SMBs Founded 2014 Key region Mexico Share of NAV: 24.5% Key facts Fair value USD 135.6 mln Investment USD 56.5 mln Ownership stake 10.4% Year of investment 2018 23
  • 25. Konfío product suite expansion & value creation history Rolling out a three-pillar strategy of lending, SaaS and payments to serve Mexican SMEs 3Q20 4Q20 1H21 3Q21 VEF raises $61m in share placement Konfío acquires ERP and accounting software company Gestionix in further expansion of Konfío’s SaaS tools VEF share price and NAV reach record highs Konfío develops payments solutions in-house and via M&A Konfío raises $125m Series E funding round with VEF participation of $19.8m Konfío becomes Mexico’s 4th unicorn with $110m Series E2 funding round (VEF participation of $9.3m) VEF NAV $268 m $388m $404m $554m Evolution of VEF’s stake valuation in Konfio 2018 2Q19 3Q19 1Q20 2Q20 3Q20 4Q20 1Q21 2Q21 3Q21 New investment USD mln Series C ($15m) $15.0m $35.0m $41.6m $32.4m $28.1m $40.3m $48.5m $61.0m $75.4m $135.6m Conv. Note ($10m) Series D ($2.5m) Series E ($19.8m) Series E2 ($9.3m) Mark-to-model
  • 26. A Selection of VEF’s Key Geographies and Portfolio Holdings 2 Brazil A. Mexico B. India C. Emerging Europe D. 26
  • 27. India is an exciting market with an evolved fintech ecosystem India constitutes 8% of VEF’s portfolio 8% VEF Investments Payments Simplifying the complex payments infrastructure for merchants • A scale market with 2nd largest population and one of the largest banked populations in the world. High smartphone penetration, digital adoption and data usage has resulted in high adoption of fintech • Government and regulatory drive to digital payments and bolstering of public payment infrastructure • Rapidly growing e-commerce opportunity with significant resources focused on developing payment solutions • Complex payments infrastructure with many unique payment methods and mandatory 2 factor authentication has resulted in some of the most advanced payment solutions globally Payments • More than 90% of Indians don’t have access to formal credit. 60% of their debt is unsecured, which is expensive and limited in quantum • At the same time, 95% of their net worth is held in some form of asset, with Indian households have over 25,000 tonnes of gold holdings worth ~USD 1.5tn • Combining the huge credit gap and unproductive gold in Indian households represents a huge market opportunity Asset-backed (gold) lending Asset-backed lending Championed creation of a new category – doorstep gold loan 27 • At VEF, we are experiencing an attractive and growing pipeline of ‘embedded fintech’ opportunities. BlackBuck represents our first investment in this space • India’s economy relies on a very fragmented and disorganised trucking industry for the transportation of goods across the country. There are 1.5mn truckers (fleet owners) who own 3.5mn trucks. • The highly fragmented nature of the trucking sector is relatively unique globally and provides a huge opportunity to disrupt. Embedded Fintech (Logistics) Embedded fintech Leading transformation in the Indian logistics industry
  • 28. Juspay India’s leading mobile payments platform for online merchants Juspay solves these challenges for customers with their unifying layer of products and value-added services, with more than 250 mln downloads of its SDK. Juspay improves conversion rates for merchants and others in the payment value chain, facilitating ~USD 50 bln of annualised GMV and ~6 mln transactions per day*. Based in Bangalore, Juspay is backed by Accel India, Wellington Management, and serves some of India’s largest merchants including Amazon, Flipkart and Uber. Juspay is India’s leading mobile payments platform for online merchants. 01 India has one of the most advanced and complex electronic payment infrastructures globally, resulting in friction and challenges for merchants and banks in the country. 02 Focus Mobile Payments Founded 2012 Key region India Share of NAV: 5.2% Key facts Fair value USD 28.7 mln Investment USD 13.0 mln Ownership stake 9.9% Year of investment 2020 * As of August 2021 28 Juspay in figures 200%+ M12 revenue retention of enterprise clients ~2x Growth in transactions per day in last 2 years 250 mln+ SDK installs ~6 mln Average transactions per day (Aug’21) 80% Market share of Juspay clients in digital payments ~$50 bln Annualized GMV (Aug’21) <1% Monthly merchant churn 160+ Total number of enterprise clients and merchants
  • 29. Juspay Digital payments are witnessing exponential growth in India and Juspay is well positioned to capitalize on the huge opportunity Value and volume of UPI transactions in India 0 500 1 000 1 500 2000 2500 3 000 3 500 4 000 0 500 1 000 1 500 2000 2500 3 000 3 500 4 000 4 500 5 000 5 500 6 000 6 500 7 000 Oct-16 Feb- 17 Jun-17 Oct-17 Feb- 18 Jun-18 Oct-18 Feb- 19 Jun-19 Oct-19 Feb- 20 Jun-20 Oct-20 Feb- 21 Jun-21 Value in INR billion (LHS) Volume in million (RHS) 29 UPI is fast becoming the most favored method of digital payment…. 4 25 100 FY18 FY21 FY26 Number of UPI transactions ….projected to witness exponential growth over next 5 years 68 578 FY21 FY26 Value of UPI transaction (USD billion) 4x 9x 6,0 2,0 1,5 1,2 0,5 Juspay PayU Razorpay Billdesk Pine Labs Transactions per day in millions Juspay has achieved ~1.2x scale compared to next 4 peers combined 80 50 40 30 30 Billdesk Juspay Pine Labs PayU Razorpay Total annualized payments volume (USD billion) ~1.2x scale compared to next 4 peers combined Source: Company, Research
  • 30. Rupeek India’s fastest-growing asset-backed digital lending platform Rupeek is solving for this paradox by building products to make credit accessible to the masses in a fair and convenient manner and is contributing to the financial inclusion of the Indian population. Rupeek currently disburses ~USD 800 mln annually and is growing 15% month-on-month. The company has also sustained high customer centricity with a consumer NPS being >65. Based in Bangalore, Rupeek is backed by some of the prominent investors including Accel India, GGV, DST, Gemini and Bertelsmann. Rupeek, which provides online gold loans at the doorstep, is India’s fastest growing asset-backed digital lending platform* and is our second investment in India. 01 More than 90% of Indians don’t have access to formal credit. At the same time, 95% of their net worth is held in some form of asset, with Indian households holding over 25,000 tonnes of gold worth ~USD 1.5 tn. 02 Focus Secured Lending Platform Founded 2015 Key region India Share of NAV: 1.3% Key facts Fair value USD 7.0 mln Investment USD 7.0 mln Ownership stake 1.4% Year of investment 2021 * Accordoing to Deloitte Touche Tohmatsu India’s ‘Technology Fast 50’ Indian gold loan industry and Rupeek in figures #1 Rupeek is India’s fastest growing tech start-up c.15% Month-on-month disbursement growth $800m Annualized disbursement by Rupeek RUPEEK 100m+ Potential gold loan borrowers in India +$150b Annual gold loan book in India +$1.5tn Value of gold held by Indian households INDUSTRY 30
  • 31. Blackbuck – 3rd investment in India and 1st in embedded fintech India’s largest online trucking platform BlackBuck digitizes fleet operations for truckers (providing predominantly payments solutions around tolls and fuel) and operates a marketplace matching trucks with relevant loads. Blackbuck is a leader in its category and has built several unique solutions for Indian truckers. 35% of India’s trucking toll spend today happens through BlackBuck. The company achieved unicorn status in the last concluded round. Alongside VEF, Blackbuck is supported by multiple global investors including Accel, B Capital, Goldman Sachs, IFC, Sands Capital, Sequoia, Tiger Global, Tribe Capital, and Wellington Management. At VEF, we are experiencing an attractive and growing pipeline of ‘embedded fintech’ opportunities and BlackBuck represents our first investment in this space and our third investment in India 01 BlackBuck is the largest online trucking platform in India and currently drives 90%+ market share of all online trucking activity. It is leading a transformation in the India logistics industry, which is fast moving from paper & pencil to digital. 02 Focus Online trucking platform Founded 2015 Key region India Share of NAV: 1.8% Key facts Fair value USD 10 mln Investment USD 10 mln Ownership stake 1.0% Year of investment 2021 31 Blackbuck in figures #1 India’s largest trucking network 1,000+ Industrial hubs connected by Blackbuck 15m+ Monthly transactions 10k+ Number of SME and enterprises customers 700k+ Number of truckers on Blackbuck platform 1.2m+ Number of trucks on the platform
  • 32. A Selection of VEF’s Key Geographies and Portfolio Holdings 2 Brazil A. Mexico B. India C. Emerging Europe D. 32
  • 33. ü Global remittances totaled USD 700+ bln in 2020 (World Bank) and continues to grow ü The average cost of making a cross-border remittance in 4Q20 was 6.5% ü Growing share of cross-border remittances being executed electronically ü Electronic cross-border remittances benefit in speed and price ü Large portion of cross-border remittances conducted regularly and predictably Cross-Border Remittances Emerging Europe Emerging Europe constitutes 5% of VEF’s portfolio Cross-Border Remittances Offering real-time low-cost digital money transfer options across the globe 5% VEF Investments 33
  • 34. TransferGo A leading digital cross-border remittance provider in Europe TransferGo has a high market share in key corridors across its prime CEE/CIS region of focus. Deep bank integration facilitates the fastest guaranteed settlement times amongst peers, while customers pay up to 90% less using TransferGo vs banks. TransferGO recently closed a $50mn Series C funding round, leaving it well placed to win its region/segment of focus. TransferGo is a low-cost, digital money transfer business offering real-time service to customers across the globe. 01 Currently serving a customer base of over 2.5mln people, TransferGo’s segment of focus are migrant workers, who are some of the most consistent and regular remittance customers. 02 +£1.4bn Sep’21 run-rate transaction volume #1 Best rated money transfer platform in the world TransferGo in figures +2.5m Customers registered since inception 30 sec Transaction processing speed capability c.£24.2m Sep’21 run-rate revenue, growing +27% YoY +66% Sep’21 gross margin OPERATIONAL FINANCIAL 4.3x-6.6x CLTV/CAC vs peer group of 2.6x Focus Cross Border Remittances Founded 2012 Key region Europe Share of NAV: 5.3% Key facts Fair value USD 29.2 mln Investment USD 13.9 mln Ownership stake 12.3% Year of investment 2016 34
  • 35. 15% 30% 80% 20% 31% Turkey Ukraine Poland Romania Lithuania Digital remittance volume Non-digital remittance volume TransferGo TransferGo bridges the unmet need for blue-collar migrants to conveniently transfer money abroad TransferGo: The business model in brief Global digital remittance volume is set to increase … … and already a large volume opportunity in key markets Sources: Statista, BTCA, World Bank, Bank of Ukraine, Business Insider Moved abroad to earn money Has a blue-collar job and income Limited proficiency in local language Limited financial literacy Support family at home financially Build savings and wealth Pay off debt (home & abroad) Find a trustworthy financial partner Stay on top of finances Easy initiation of recurring and one-off payments “Save” product to deposit funds Inability to open local bank accounts Building savings & wealth Access to affordable overdraft credit facilities, currently dominated by pay- day lenders and incumbents Situation Goals Needs Challenges “Blue-collar migrants have unique financial needs and they remain underserved” • TransferGo offers a simple and inexpensive way for blue-collar migrants to transfer money across borders • Extract a competitive commission based on the value of the transfer 538 478 428 430 417 423 417 400 373 363 60 104 145 183 225 247 277 314 360 387 642 2014 2017 2015 2016 2019 2018 2020E 2021E 694 2022E 2023E 750 598 582 573 613 670 714 733 Digital Volume (USD bln) Non-Digital Volume (USD bln) Family in home country Blue-collar migrant Frequent low-value money transfers Commission to TransferGo 82 69 64 33 31 25 22 20 20 17 CEE, Ukraine … India China Philipines Mexico France Nigeria Egypt Pakistan Germany Annual remittance volume by destination (USD bn) 19% Forecasted digital remittance volume growth rate (CAGR ’20-’24) Digital remittance penetration in key markets (USD bn) 11% 21% 25% 16% A 2% take-rate implies a $1.6bn revenue opportunity 21 11 7 5 1 CEE Ukraine & Turkey 35
  • 36. TransferGo TransferGo v/s. Wise v/s. Remitly Source: TGo/ Wise/ Remitly/ GS 36 Product Card-to-card and bank remittances SME offering Remittances-as-a-service C2C transfers Multi-currency account with debit card SME/ Enterprise offering Remittances (for immigrants, generally one-way) Corridors 743 corridors 50 receiving countries Mainly send-only 1,600 corridors 59 receiving countries Send and receive 700 corridors 150 receiving countries Mainly send-only Licencing UK Lithuania (EEA-wide EMI) Ukraine Turkey EEA Hong Kong India Malaysia (50+ others) Australia Canada Ireland Nigeria US UK Technology 27/7 end-to-end automation allow for transactions to be processed in seconds (30 sec. transaction processing speed capability) 20% of transactions are processed within 20 seconds (38% instantly, 83% < 1 day) 75% of transactions < 1 hr but longer tail Geographic exposure (revenues) Ukraine, CEE & Turkey 95% Europe 33%, UK 23%, N. America 17%, APAC 21%, RoW 6% (FY 2021) US 77%, Canada 12%, Other 1% (India, the Philippines, and Mexico biggest corridors)
  • 37. Introduction to VEF – The Emerging Market Fintech Investor 1 VEF’s Portfolio 2 Investment Opportunities 3 ESG 4 Appendix 5 37
  • 38. • Continuously evaluating 3 core opportunities for investment and shareholder value creation • Investment decisions and prioritization driven by expected IRR from each opportunity PIPELINE OPPORTUNITIES • Investing in new companies based on our country-specific approach • Leverage our deep fintech expertise, global lens and partner network to find the best opportunities • Largest opportunity to deploy capital as fintech in emerging markets continues to gain momentum with many success stories • Core country and company target lists provide focus to getting the best deals that meet expected IRR hurdles FOLLOW-ON INVESTMENTS • Opportunities to invest more in portfolio winners • Companies we have lived with, know the best and highest conviction on expected IRR • $ value deployable in follow-ons grows with size of the portfolio and valuation of portfolio winners • High level of visibility as to when follow-on investment opportunities will arise BUYBACKS • Opportunity to generate shareholder value if share price discount is high and confidence in evolution in portfolio winners is such that expected IRR meets hurdle rate • Opportunity dependent on market conditions, with least visibility Pipeline Follow- ons Buybacks Hurdle IRR Investment opportunities 3 core avenues for capital allocation 38
  • 39. Strong history of follow-ons augmenting shareholder value creation Investing more in portfolio winners, companies we know inside-out, with high conviction on expected IRRs Follow-on investments Historic and projected follow-on investments (USD mln) 39 0,04 1,6 5 12 40 29 24 30 3 6 9 12 11 12 15 0 2 4 6 8 10 12 14 16 0 5 10 15 20 25 30 35 40 45 2015 2016 2017 2018 2019 2020 2021 - YTD YTD'21 to YE - Predicted Follow-on Follow-on (planned) Avg # of companies in VEF portfolio Total expected follow-ons of ~$54m in 2021, of which $24m has been invested already YTD. TBU
  • 40. Pipeline heating up, but we remain disciplined and selective • Deal flow as healthy as ever with fintech in emerging markets gaining momentum and high profile exits. • Country by country approach to searching for opportunities and teams that we believe will be winners in their space. • Leverage our deep fintech expertise, global lens on financial services and strong local partner network to identify opportunities that exceed our expected IRR hurdle. • Have core countries and company target lists to focus our efforts. • Countries of focus are Brazil, India and Mexico with large volume of big deals and frontiers like Egypt and Pakistan with a less developed ecosystem and smaller ticket opportunities. • With 3 new investments so far in 2021, we are likely to make further new investments this year and/or next as we convert a busy pipeline. Deal count by stage YTD 2021(1) YTD 2020(2) YoY % Full year 2020 YTD 2021 as % of 2020 Leads 249 107 133% ▲ 131 190% Qualified Leads 141 58 143% ▲ 69 204% 1 Deals seen as of 15-Oct-21; 2 Deals seen as of 15-Oct-20 YTD 2021, we have already seen almost double the deals we saw in full year 2020 and ~2.3x the deals we saw in first 9.5 months of 2020. However, we remain highly selective and diligent despite the pipeline heating up. 40
  • 41. Creditas, compounding from a larger base The value of VEF’s position in portfolio North Star, Creditas, accounts for 30% of VEF’s total NAV. Growing at a run-rate north of 100% YoY, we are starting to enjoy a larger base effect, from what is still early days of their journey into a scale opportunity space. M&A and partnerships are adding a fresh leg to a strong underlying growth story. IPO targeted for 2022. NAV continues to reach new highs and a strong basis for continued growth YTD 2021 has started where 2020 left off and we remain encouraged by all we see in our portfolio as we look ahead. We are exceptionally well placed post our recent capital raise and have some great partners in our cap table that provide much more then just capital. Portfolio break outs and ones to watch – Konfio, our next Creditas – Juspay, Jumo and TGo in focus Through 2021, we see clear potential for other names within the portfolio to break out and scale within their focus space and geographies. Top of list, Konfio, exceptionally well-funded and delivering on its diversified SME financial services platform. Juspay, Jumo and TGo are all stories starting to break out and can have meaningful future NAV impact. ESG: VEF moves jurisdiction to Sweden; portfolio companies at the front line of sustainable finance We recently announced the completion of our domicile change from Bermuda to Sweden, an important step in our ESG journey and in ensuring that VEF is a long-term sustainable company and an attractive investment for all types of investors. Many of our companies drive financial inclusion and fairness within their focus ecosystems. Fintech theme gathering momentum – long a portfolio of strong assets, rich pipeline in the works YTD 2021 has easily been the busiest period on the pipeline front in our history. We have engaged with over ~212 opportunities YTD (Sep’21) in our core geographies, vis-à-vis 131 for all of 2020. While we continue to see a healthy pipeline flow, we maintain our focus, patience and diligence in the current climate. We have made just 1 new investment from the 2021 funnel cohort, but expect to complete more by YE21. Key risks Uncertain macro and markets outlook from ongoing COVID spread. VEF investment case VEF provides unique access to one of the most exciting value creation spaces within emerging markets. 41
  • 42. Introduction to VEF – The Emerging Market Fintech Investor 1 VEF’s Portfolio 2 Investment Opportunities 3 ESG 4 Appendix 5 42
  • 43. VEF sustainability and core values Stewardship Active and responsible shareholder that takes corporate governance very seriously, both within VEF and in portfolio companies Integrity Transparent, open, honest, fair and ethical towards all stakeholders Respect for people and diversity Respect for diversity of thought, background and the individual. Innovation and success come out of bringing people together from different backgrounds, with different ideas, strengths and experiences. Positive impact Returns by positive social impact. Participate in the creation of economic opportunities for those without, advance new technologies and business models that are sustainable and improve financial intermediation. VEF core values VEF sustainability in brief VEF core values – the foundation Broad and robust policy package Sustainability principles and tailored focus areas Portfolio companies driving impact 43
  • 44. VEF’s sustainability strategy An investment decision-making process driven by a strong belief in: Sustainability as a fundamental part of business Power of active shareholding, to ensure strong governance and responsible business practices Sustainability strategy Portfolio companies • Biggest sustainability effect comes through our portfolio companies • Current VEF ESG targets for portfolio companies: • 100% have relevant policies within business ethics • 100% compliant with VEF business ethics requirements • 3 areas specifically relevant to VEF as an EM fintech investor: VEF industry involvement • A global community with the main goal to promote responsible investing and practices within the digital finance industry • VEF is a signatory • 10 investor guidelines • Responsible financing: § Fair and transparent consumer practices § Data privacy and security § Responsible lending and debt prevention •Regulatory compliance, anti-corruption, AML and general business ethics Business ethics •Fair and transparent consumer practices •Data privacy and security Responsible financing •Improve and provide access to fair and affordable financial services Financial inclusion 1 2 Sustainability at VEF Two dimensions of sustainability at VEF: VEF as a company and investor • While small today, we recognize the value and importance in keeping our house for our long-term and sustainable growth as an investment company • Domicile change to Sweden – an important step in our ESG journey 1 2 44
  • 45. Investment process backed by a thorough ESG diligence Investment process From sourcing to investment decision • Discussed at an early stage • Fundamentally believe “If it is not ethical, it is not scalable” • Investment cases with positive social impact often have very attractive fundamentals, eg. underserved consumers or SMEs Close collaboration • Investment team and sustainability team work closely on all investments ESG assessment in-house • A tailored in-house assessment before all new investments • Periodical assessments post-investments ESG diligence Pre-investment • Analysis of exposure to ESG risks mandatory before investing • Focused on VEF core ESG areas, business ethics, responsible financing and financial inclusion Post-investment • Periodical assessment of portfolio companies to: a) Ensure we are aware of potential issues b) Track progress within ESG c) Active involvement where needed, eg. ensure appropriate policies and processes or just general guidance to improve and move to the next step d) Maturity often depend on life stage of company e) Expect improvement and commitment to grow with the portfolio companies VEF is an active and responsible shareholder, believing in the fundamental importance of integrating ESG considerations into our investment process to create sustainable and long-term value for our investors 45
  • 46. Supporting the SDGs – social impact Financial inclusion • Supporter of UN Sustainable Development Goals • Access to financial services for people and small businesses is an important part in achieving the SDGs, eg. reduce poverty and hunger, reduce inequality and promote gender equality • 1.7 billion people in the world have no access to financial services EM fintech = impact The majority of VEF portfolio companies play an important role in the furthering of financial inclusion, by providing a) services to consumers and SMEs who are un- or underserved by traditional financial institutions or b) access to financial services at fair and affordable terms: • Loans to low-income people and SMEs • Financial services on fair and affordable terms • Access to financial services for previously unbanked or underbanked Our capital positively impact the access to fair and affordable financial services while staying true to our mandate of maximizing return 46
  • 47. Fintech for financial inclusion – VEF portfolio (1/2) Most VEF portfolio companies play an important role in the furthering of financial inclusion, by providing: a) services to underserved consumers and SMEs; or b) access to financial services at fair and affordable terms. • Mexican SMEs are underserved by traditional banks -only 3 out of 10 businesses have access to formal credit • Konfio provides credit and other financial services to SMEs • Facilitating growth opportunities for SMEs and sole traders – average 25% increase in sales following Konfio loan • Passionate about gender diversity – currently an ongoing project to close the gender pay gap within Konfio A rising star 41% Sole proprietors 1/3 are women +50% first time formal financial services users with no credit history • For 60% of Jumo customers it’s their first interaction with formal financial services. • Jumo lends to formal and informal SMEs, often shunned by banks. • Removing barriers to access and reaching segments that have been previously excluded from financial services. • Served almost 18m customers • Originated over US$ 3bn in loans • 60% are first time users of formal financial services A VEF benchmark for financial inclusion 27% earn less than US$ 2 per day 1/3 are women 21% live in rural areas
  • 48. Fintech for financial inclusion – VEF portfolio (2/2) Most VEF portfolio companies play an important role in the furthering of financial inclusion, by providing: a) services to underserved consumers and SMEs; or b) access to financial services at fair and affordable terms. • A vast majority of population and SMEs lack access to formal credit o 21% of the adult population have a bank account o 2% of adults and 7% of SMEs receive formal credit from financial institutions • Finja is Pakistan’s leading digital lending platform for MSMEs • Serve more than 3,000 unique MSME and 200,00 unique retail customers, of which a majority are underserved Serving underserved population and SMEs 21% Adult banked population 7% %age of SMEs receiving formal credit 2% %age of adults receiving formal credit • Brazilian consumers pay some of the highest interest rates in the world • Reduces the Brazilian consumer debt burden and offers loans at significantly more affordable terms • Creditas cuts interest rates 80-90% from the normal 100-400%/annum typically charged by unsecured consumer lenders and credit card providers in Brazil Improving access to secured credit at affordable terms • Rupeek provides customers access to secured credit at affordable terms • Many customers have previously not had access to formal credit • Mission: “bring financial inclusion to the masses by making credit accessible to Indians in a convenient and cost-efficient way”
  • 49. Welcoming new board member, Hanna Loikkanen • Following her election at our May AGM, we are delighted to welcome Hanna Loikkanen as a new member of the VEF Board of Directors. • Hanna's extensive experience in financial services, private equity and ESG across emerging and frontier markets will be invaluable to VEF in the years ahead. Redomestication from Bermuda to Sweden complete • The redomestication of our parent company from Bermuda to Sweden was completed at the end of June. • Following the domicile change, VEF shares now trade under the ticker VEFAB, • Our new structure ensures that VEF is a long-term sustainable company and an attractive investment for all types of investors, and is an important step in our ESG journey. ESG: Redomestication and new board member 49
  • 50. Introduction to VEF – The Emerging Market Fintech Investor 1 VEF’s Portfolio 2 Investment Opportunities 3 ESG 4 Appendix 5 50
  • 51. Appendix 5 Deal sourcing A. History of value creation B. Governance structure C. Other portfolio holdings D. 51
  • 52. TOP-DOWN DRIVERS IDENTIFY SEGMENTS OF FOCUS ATTRACTIVE OPPORTUNITIES ALL ABOUT TEAM AND PEOPLE Deal sourcing Country by country approach to targeting opportunities Tech adoption + Behaviour Regulation + Regulatory drivers Capital markets + Funding sources + Exit environment Access to talent Macroeconomics + Unit Economics + Demographics Cultural aspects Private players Venture capital funds Listed players Incumbents BOTTOM-UP MAPPING 52
  • 53. Global fintech lens with trusted local partners Strong value proposition: global lens + deep sector expertise + strong local partner support + local knowledge ` ` ….and leverages a strong network of local VC partners and co- investors providing a superior value proposition. COMMENTS • Each Emerging Market has a local VC circle that dominate the sourcing and curating of early-stage digital opportunities, inclusive of fintech • We have built strong relationships with the best local VCs and have co-invested and sit on boards with the majority of them over many years • These relationships are a key positive for ongoing sourcing and successful building out of individual portfolio companies and our overall portfolio 53
  • 54. Rigorous investment process We identify and track investees for a long time before investing COUNTRY-BY-COUNTRY APPROACH TO IDENTIFYING OPPORTUNITIES Use top-down drivers and bottom-up mapping to identify attractive opportunities and teams 1. INVEST TIME AND BUILD A RAPPORT Spend time with the team on the ground, getting to know the individuals, business, products and competitors. Continue to track progress from a distance 2. INVESTMENT COMMITTEE Produce investment proposal and present to investment committee who are fully appraised of the funnel and have input before this stage. Gain formal approval to proceed and range of potential terms under which to negotiate. 3. DUE DILIGENCE Perform thorough due diligence (legal, operational, technology and financial) leveraging third party experts where necessary. 4. CLOSING Legal and final closing procedures 5. TOTAL INVESTMENT PROCESS Ongoing DURATION 3 months – 1.5 years 1 month 1-2 months 1-2 months 6 months – 2 years 54
  • 55. Appendix 5 Deal sourcing A. History of value creation B. Governance structure C. Other portfolio holdings D. 55
  • 56. IPOs Company Valuation Offer size Year $33bn $2.4bn 2020 $6.5bn $870mn 2020 $14.9bn $2.0bn 2019 $6.8bn $2.7bn 2018 $6.1bn $1.4bn 2018 M&As Target Acquirer Price Year $569m 2021 $1.1bn 2020 $200mn 2020 $165mn 2019 $49mn 2019 Strong back drop for value accretive exits within the EM fintech space Growing wave of fintech M&A and exits 512 376 205 266 94 244 # of transactions 21,6 14,9 5,6 11,4 2,9 10,9 0,1 B a n k i n g / L e n d i n g T e c h We a l t h & C a p i t a l Ma r k e t s T e c h F MS I n s u r T e c h H e a l t h c a r e F i n T e c h P a y m e n t s F i n a n c i a l B P O 1,703 1H 21 Banking / Lending Tech Wealth & Capital Markets Tech InsurTech Payments Healthcare FinTech FMS Financial BPO Financing Volume (USD Billions) Record fintech funding in 1H211 Source: (1) 2Q21 Fintech Insights, Financial Technology Partners Evolution of Global Fintech M&A Recent EM Fintech exits 75 91 130 234 241 136 905 916 872 993 972 400 500 600 700 800 900 1 000 – $50 $100 $150 $200 $250 $300 2016 2017 2018 2019 2020 1H 21 Global Fintech M&A Volume (US$ bn) Deal count 56 732 TBU
  • 57. Appendix 5 Deal sourcing A. History of value creation B. Governance structure C. Other portfolio holdings D. 57
  • 58. Diverse engaged Board with broad-based value-added experience Lars O Grönstedt Chairman of the Board Experience: • CEO of Handelsbanken between 2001–2006, and Chairman of the Board of Handelsbanken between 2006–2008 Education: • BA in languages and literature from Stockholm University, and an MBA from Stockholm School of Economics David Nangle Board Member and Managing Director Experience: • Renaissance Capital Head of Research and Financials Sector Research • ING Barings Head of EMEA Financials Research Education: • Degree in B. Comm Intl. (French) from University College Dublin Per Brillioth Board Member Experience: 22+ years of EM investing • MD of VNV Global AB (VNV) • Head of the Emerging Markets section at the Swedish investment bank Hagströmer & Qviberg between 1994 and 2000 Education: • Graduate of Stockholm University and a Master of Finance from London Business School Ranjan Tandon Board Member Experience: • Founder and Chairman, Libra Advisors • Several operating positions with DCM in India and Halliburton in Europe; CFO of InterMarine • Education: • Degree in Chemical Eng. from Indian Institute of Technology Kanpur, India and a graduate of Harvard Business School Allison Goldberg Board Member Experience: • Partner at Saints Capital Media Ventures and former partner at Advancit Capital Education: • Bachelor of Science in Economics from Wharton School at the University of Pennsylvania Hanna Loikkanen Board Member Experience: • 25+ years of experience in emerging markets • Independent Non-Exec Director at Finnfund and Bank of Georgia • 13+ years at East Capital, a specialist in emerging & frontier markets Education: • Master of Economics at Helsinki School of Economics and Business Administration 58
  • 59. Appendix 5 Deal sourcing A. History of value creation B. Governance structure C. Other portfolio holdings D. 59
  • 60. VEF portfolio summary Company Country Segment Inv. date Ownership % Invested amount (USD mln) Sep’21 fair value (USD mln) Brazil Asset focused Ecosystem Dec-17 8.4% 73.4 169.0 Mexico Diversified FS for Mexican SMBs Jun-18 10.4% 56.5 135.6 Emerging Europe Cross-Border Remittances Jun-16 12.3% 13.9 29.2 India Mobile Payments Platform Apr-20 9.9% 13.0 28.7 Africa Mobile Money Marketplace Oct-15 4.8% 14.6 18.4 Russia Payments & Consumer Credit Sep-15 23.0% 6.7 13.8 Brazil Consumer Credit Marketplace Mar-16 18.4% 4.1 12.3 Brazil Accounting SaaS provider for SMEs & accountants Apr-17 20.1% 6.5 11.9 Brazil Digital Investments Sep-17 17.5% 5.7 10.5 India Online Trucking Platform Jul-21 1.0% 10.0 10.0 Pakistan Digital Lending & Payments Jul-16 22.0% 2.9 7.4 India Secured Lending Platform Mar-21 1.4% 7.0 7.0 Brazil HR & Payroll Management Sep-19 16.0% 8.5 1.3 Pakistan Salary on Demand Jun-21 15.0% 0.9 0.9 Mexico Salary on Demand Mar-21 1.2% 0.5 0.5 USD 456 mln (excl. cash and liquid assets) 60 * As of 30th Sep 2021
  • 61. Russia – A scale market and global leader in digital banking Russia constitutes 3% of VEF’s portfolio • Russia is a scale market with a population of 145 mln people and high levels of fintech adoption, ranking number 3 globally at 82% • The consumer credit market has grown rapidly in recent years with growing opportunity for fintech to serve both consumers and merchants in the POS space • Founded in 2007, Tinkoff is one of the world’s largest digital banks, with over 11mln customers • Today Tinkoff gives its customers access to a fully-fledged and digital ecosystem of financial, credit, insurance, investment, mobile, lifestyle, and business products and services – all through its mobile app • One of the most profitable banks in the world with ROEs north of 40% (2020) Digital Banking Consumer Credit Payments and Consumer Credit Point of sale financing options for both online and offline customers Digital Bank and Credit* Market cap: $22.0B1 *VEF was a shareholder in Tinkoff Bank and exited the business in 2019 1 Market cap as of 19-Oct-21 3% VEF Investments Listed players 61
  • 62. Revo Leading buy now pay later player in the Russian market Working with Russia’s online and offline merchants to increase conversion and basket size, Revo also leverages proprietary customer data to deliver personalized marketing services for merchants. Numerous scale partners across Russia, including some of the country’s largest merchants in the offline and online space, while also expanding into the CEE, including Poland and Romania. Business model similar to offline pay-later solutions in Turkey/Brazil and online solutions of Affirm, Klarna and Afterpay in the US, Australia and Europe. The Afterpay of Russia/CEE, Revo REVO provides buy now pay later (BNPL) financing solutions for customers in Russia and CEE through the Mokka brand. 01 One of the hottest sectors in fintech globally, BNPL has become a mainstream option for financing purchases at the point of sale, taking a share of the pie from the credit card market and often considered as an alternative payment method as opposed to credit. 02 Key Merchant Partners Focus Merchant Payments & Consumer Credit Founded 2013 Key region Russia / CEE Share of NAV: 2.5% Key facts Fair value USD 13.8 mln Investment USD 6.7 mln Ownership stake 23.0% Year of investment 2015 62
  • 63. Brazil constitutes 37% of VEF’s portfolio with 5 active investments 30,5% 2,2% 2,2% 1,9% 0,2% 63,0% % of 3Q21 total portfolio NAV 37% Remaining portfolio 63
  • 64. Nibo Brazil’s leading accounting SaaS provider for SMEs and accountants With over ~330k paying SMEs serviced through ~3.5k accountant customers, Nibo’s tools empower accountants to better and more profitably serve their customers. Large addressable market of +10M SMEs with a regulatory requirement to employ accounting services in Brazil and ~80k accounting firms. Proven model seen scale and succeed in other markets, eg. Intuit (US), Xero (NZ) and Fortnox (Sweden). Nibo is the leading accounting SaaS provider in Brazil, transforming the way accountants and SMEs interact in one of the most complex and regulated accounting and tax environments in the world. 01 Nibo offers their customers a suite of financial management tools including accounts and bank reconciliation, payment of bills, cash flow projection tools and issuance of invoices and boletos. 02 Nibo SaaS dashboard SMBs Accountants ERP General Ledger Accounting software 3 Accounting Tax calculations Payroll calculations Nibo for accountants Accounting analysis Communication Document storage Cash Control 1 Finance Management 2 Focus Accounting SaaS provider for SMEs & Accountants Founded 2012 Key region Brazil Share of NAV: 2.2% Key facts Fair value USD 11.9 mln Investment USD 6.5 mln Ownership stake 20.1% Year of investment 2017 64
  • 65. 65 Brazil v/s. Sweden Brazil’s scale relative to Sweden GDP $ 1,434b $ 531b 3x Population 210m 10m 20x Total addressable SMEs 10m 1.2m 5x Total addressable accountancies 80,000 23,500 3x Nibo v/s. Fortnox Total SME customers 330,000 385,000 Implied market share 3.3% 32.1% Maximum growth potential 30x 3x Total accountants 3,500 6,000 Implied market share 4.4% 25.5% Maximum growth potential 23x 4x Current valuation $ 53m $ 3.9b Valuation of Fortnox v/s. Nibo 74x Significant potential upside in Nibo Source: World Bank, Fortnox Annual Report and Call Transcripts, VEF Estimates; Fortnox’s market cap as of 18-Oct-2021 With one of the most regulated and enforced tax systems in the world, Brazil represents a ~3x-5x market opportunity vis-à-vis Sweden Nibo Nibo vs Fortnox – A VEF investment case
  • 66. FinanZero Digital marketplace for consumer loans in Brazil Full integration with over 52 credit institutions (banks and fintechs) allows FinanZero to handle the whole lending process from start to finish. The company is focused on three sizeable loan broker segments: unsecured consumer loans, secured car finance loans and secured home equity loans, while new products such as payroll loans and credit cards are soon to be introduced. Proven model seen scale and success in other markets and a founding team with a successful track record and experience from a leading consumer loan broker in Sweden. FinanZero is a pioneering digital marketplace for consumer loans in Brazil. 01 Acting as an independent broker, FinanZero negotiates the customer’s loan with several banks and fintechs at once to find the loan with the best interest rate and terms for the consumer. 02 +21% Revenue growth in 2Q21 (QoQ) 52 Lending partners live on the platform +2.5m Loan applications in 2Q21 Quarterly revenue 2017-2021 FinanZero in figures 4.9/5 Rating out of c. 10.5k Google reviews (BRL ‘000) Focus Consumer Loan Marketplace Founded 2016 Key region Brazil Share of NAV: 2.2% Key facts Fair value USD 12.3 mln Investment USD 4.1 mln Ownership stake 18.0% Year of investment 2016 - 1 000 2000 3 000 4 000 5 000 6 000 Q1-16 Q2-16 Q3-16 Q4-16 Q1-17 Q2-17 Q3-17 Q4-17 Q1-18 Q2-18 Q3-18 Q4-18 Q1-19 Q2-19 Q3-19 Q4-19 Q1-20 Q2-20 Q3-20 Q4-20 Q1-21 Q2-21 66
  • 67. FinanZero Digital marketplace for consumer loans in Brazil FinaZero: Business model in brief Lessons from the Swedish online broker market 1 2 Loan comparison service Best offers available, full transparency Highest quality applicants, based on lenders preferences Loan offers, delivered in the way the lender provides 1 2 3 4 Applications from customers 1 2 3 4 Loan broker service. Makes money from commission on paid-out loans FinanZero to pocket up to 14% commission with no balance sheet risk § The online loan broker model is a proven win-win for all involved parties - Consumers: Improved transparency, usability and lower interest rates - Lending partners: Reduced risk and lowered marketing cost - FinanZero: Acts as an intermediary between the consumers and lending partners in this win-win scenario, which creates loyalty and strong lock-in effects § USD 4 billion market - Lendo yearly renegotiates approx. 3.4% of the total Swedish unsecured loan market, equivalent to 0.9 USDbn - A similar position in Brazil would equal a market size of 4.1 USDbn1 1 2 USD 0.9 bln USD 4.1 bln ‒ The inherent lock-in effects of the loan broking model make lenders increasingly dependent on Finanzero ‒ Commissions can be increased over time ‒ In Sweden, both Lendo and Zmarta has managed to substantially increase their commissions ‒ From an average commission of 1.25% during the first years to an average of approx. 6% today Commissions are set to increase The Brazilian unsecured loan market comprise a large opportunity Source: (1) Based on 3.4% of Brazil’s unsecured loan market of 119 USDbn (448 BRLbn, Banco Central Do Brasil). 67
  • 68. Magnetis A digital investment advisor Given the deep pool of wealth, high levels of consumer technology adoption, large existing revenue pool and lack of financial market literacy, Brazil represents one of the largest addressable markets for digital wealth management globally. Strong team with vast experience of investing in Brazil and in- depth knowledge of regulatory architecture and requirements in a space with limited competition. Digital investment platforms became one of the hottest sectors in fintech in 2020, with record account openings and a surge in usage experienced globally. Magnetis is a digital investment advisor in Brazil, democratizing access to affordable and easy-to-use investment management, offering customers a simple, digital tool to manage their wealth. 01 Using state-of-the-art technology, the product takes the individual’s risk preferences into account, then builds and manages a tailored portfolio of money market, insured fixed income, hedge funds and equity ETFs at the click of a button. 02 Build a portfolio tailored to you 1 Invest in a few clicks 2 Track your progress and invest more 3 Focus Digital Investment Advisor Founded 2015 Key region Brazil Share of NAV: 1.9% Key facts Fair value USD 10.5 mln Investment USD 5.7 mln Ownership stake 17.5% Year of investment 2017 68
  • 69. Mexico is a scale market with a large underserved SME and consumer segment Mexico constitutes 25% of VEF’s portfolio SME and Financial Services Serving the underserved small business community • 7 million SMEs in Mexico, <10% of which have access to financing • Banks focus predominantly on serving large corporate clients and high-end retail • Mandatory electronic invoicing (CFDI) provides unique centralized data to analyze SMEs • SME loans stand at $22B annually and set to grow dramatically over the coming years SME Credit and Financial Services 25% VEF Investments • Massive scale of the opportunity with an addressable market of 32.3m workers in the formal economy • 75% of the population lives paycheck to paycheck and lacks savings to cover unexpected expenses • Access to traditional forms of credit is extremely limited and hard to access • ~$1.7b market size for the pay-on-demand category, growing to $3.2b to include other employee wellness and benefits products Employee Wellness and Benefits Employee Wellness Provides instant access to earned wages 69
  • 70. Minu Mexico’s leading employee financial wellness company and the market leader for salary on demand Minu solves for the employee liquidity gap, which is profound in the Mexican society where 75% of workers live from paycheck to paycheck with average wages of $550/month. Both employers and employees love Minu’s solution and its impact: 92% employer NPS and 4.8/5.0 app ratings. Minu witnessed exponential growth in 2020 with an 18x increase in the number of transactions last year. Minu is the market leader in pay on demand in Mexico, offering employees 24x7 instant access to their earned wages for a $2 fixed fee. 01 Minu works with 100+ large enterprises in both the private and public sector, including TotalPlay, Telefonica, Scotiabank, OfficeMax, Rappi, Manpower and Cap Gemini. 02 Focus Salary on demand Founded 2019 Key region Mexico Share of NAV: 0.1% Key facts Fair value USD 0.5 mln Investment USD 0.5 mln Ownership stake 1.2% Year of investment 2021 70
  • 71. • Severely underbanked population, one of the lowest banked regions globally • Lack of access impossible to address with branches / traditional banking model • Strong penetration of mobile network operators incentivized to broaden their reach into financial services • A number of financial institutions keen to extend their products to the unbanked population Digital Consumer Financial Services Africa VEF Investment Africa constitutes 3% of VEF’s portfolio Mobile Money Marketplace Provides inclusive financial services to unbanked consumers and SMEs 3% VEF Investments 71
  • 72. Jumo One of the largest and fastest money marketplaces in emerging markets Over 18M unique customers to date with over USD 3 bln in funds disbursed. For 60% of customers it is their first interaction with formal financial services. Model has no real peer today. Very strong and deep management bench. JUMO is a full technology stack for building and running financial services using advanced data science and machine learning to power the fastest and leanest financial services infrastructure in their markets. 01 Today JUMO is live in seven markets across sub-Saharan Africa and South Asia: Ghana, Kenya, Tanzania, Uganda, Zambia, Côte d’Ivoire, and Pakistan. 02 JUMO Mobile Money Marketplace JUMO Capital Financial Service Providers Telenor Tigo Airtel MTN Mobile Network Operators Barclays Letshego Ecobank Focus Banking as a Service Founded 2014 Key region Pan-Africa, Asia Share of NAV: 3.3% Key facts Fair value USD 18.4 mln Investment USD 14.6 mln Ownership stake 4.8% Year of investment 2015 Through their platform, JUMO partners with banks and telcos to give customers access to savings and loan products via their mobile phone in markets where millions of adults are excluded from or underserved by traditional financial services. 72
  • 73. Pakistan • World’s sixth most populous country with 130 million mobile users but large unbanked population (only ~20% of adults have bank accounts) where as little as 2% of adults and 7% of SMEs receive formal credit from financial institutions • Online ecosystem is witnessing hypergrowth • A cash-based economy ready for disruption: progressively moving towards a cashless economy with strong support from regulators Mobile Wallet and Credit VEF Investments • There are 61 mln formally employed people in Pakistan today – representing a large opportunity • On the credit side, consumer credit is minimal and currently stands at less 2% of GDP, excluding asset finance like auto, home, etc. which is also minuscule • There are only 2mln credit cards outstanding in Pakistan and only 1 in 20 people has ever taken formal credit Employee Wellness and Benefits 73 Pakistan constitutes 1% of VEF’s portfolio 1% Mobile Wallet and Credit Serving unbanked consumers and merchants alike Employee Wellness Provides instant access to earned wages
  • 74. Finja A leading digital lending platform and integrated payments ecosystem in Pakistan Finja offers working capital and supply chain loans to small businesses, and personal and payroll-backed loans to salaried professionals. Finja also operates an integrated payments ecosystem and mobile wallet, offering bill payments, an ecommerce marketplace and the recently launched FinjaCard, a physical card offering for urban salaried professionals, controlled digitally through the Finja app. Strong founding team of serial entrepreneurs with experience in mobile wallets, online marketplaces and financial products in Pakistan. Pakistan is a scale emerging market with a young and digitally- literate population of 210 mln people,.with the tech ecosystem steadily gaining momentum in recent years. 01 Finja is a digital lending platform with an integrated payments ecosystem focused on the financial wellness of businesses and their employees. 02 Focus Digital Lending & Payments Founded 2016 Key region Pakistan Share of NAV: 1.3% Key facts Fair value USD 7.4 mln Investment USD 2.9 mln Ownership stake 22.0% Year of investment 2016 74
  • 75. Abhi Employee wellness platform catering to the needs of employees between pay cycles From an employer perspective, the product adds no extra cost to their payroll as the fee is borne by the employee. Corporates also benefit from higher employee satisfaction and lower churn. Modernizing the pay cycle is the most fundamental transformation a company can make to its relationship with employees, and salary on demand is a great scale product the cornerstone for a much broader employee financial wellness play. Abhi raised their USD 2 mln seed round in June 2021, led by VEF and with participation from international and local investors including Village Global, Sarmayacar, i2i Ventures, Zayn Capital, and Portman Wills, the co-founder and CTO of Wagestream. Abhi is VEF’s second fintech investment into the early stage scale opportunity market of Pakistan, and our third in the financial wellness space, following similar investments in Brazil and Mexico. 01 Abhi integrates with corporates to offer their employees salary advance products to reduce their financial stress and avoid expensive payday debt. 02 Focus Salary on Demand Founded 2021 Key region Pakistan Share of NAV: 0.2% Key facts Fair value USD 0.9 mln Investment USD 0.9 mln Ownership stake 15.0% Year of investment 2021 75
  • 76. NAV valuation approach Methodology and process VEF formally revalues its portfolio and sets a fresh NAV on a quarterly basis, in tandem with and signed off by its auditors, PwC. While the inputs of our cash and any listed holdings is clear, for all private company holdings, the fair value of each is measured based on either 1) the latest investment round, or 2) using a mark-to-model approach. 1) Companies are measured based on the valuation set in the latest investment round for a period of up to 12 months post the transaction at which point the valuation is considered stale. The investment round itself is considered acceptable if it is of relevant size and led by a professional investor. Even then, the valuation has to be agreed and signed off by the VEF team and its auditor. 2) 12 months post transaction, the valuation of the company is moved to a mark-to-model approach. VEF management sets or signs off on 12-month rolling company forecasts. It then sets the most logical company variable (revenues, AUM, EBITDA) against an average market peer group valuation multiple to arrive at a fair valuation for the holding in local currency, before translating it into hard currency at period end. The process is overseen by the valuation and audit team at PwC and is continuously evaluated by both management and PwC. 76