The document summarizes research finding that wild-type SF3B1, a splicing factor frequently mutated in myelodysplastic syndromes (MDS), is translationally regulated during MDS progression and leukemic transformation. Analysis of human MDS patient samples and a mouse model of MDS revealed that SF3B1 protein levels increase in early MDS but decrease during leukemic progression. Knockdown of Sf3b1 in the mouse model accelerated leukemic transformation, indicating SF3B1 translation controls MDS progression. The study found that oncogenic stress regulates SF3B1 translation in human cells, and this impacts splicing of DNA repair and epigenetic regulators, affecting genome integrity during transformation.
Poster at EMBL: Diagnosis and monitoring of Leptomeningeal Disease using Circ...Ronak Shah
Leptomeningeal metastases (LM) in solid tumors (ST) represent a devastating complication of cancer with a median survival of only 12-14 weeks after diagnosis; however, establishing the diagnosis of LM can be difficult, particularly at early stages before the patient is disabled. The diagnosis is based on CSF cytologic analysis and/or MRI findings. Brain and spine MRIs have been increasingly preferred for the initial evaluation of LM because of their non-invasive nature and convenience to patients. However, MRI findings are negative in 25%-50% of patients, and unequivocal findings may only appear in late-stage disease when the patient is already debilitated. CSF cytologic analysis provides diagnostic confirmation of LM but is associated with a relatively low sensitivity (approximately 50% on the first lumbar puncture) and is highly examiner-dependent. Improved diagnostic tools are required to facilitate early diagnosis. To this end, we explored whether sufficient quantity and quality of DNA can be isolated from CSF for genomic study and whether the CSF pellet or CSF supernatant, would be more suitable for detecting cfDNA. We used an in-house sequencing assay, MSK-IMPACT, to interrogate 341 clinically relevant cancer genes in tumor-derived cfDNA from 53 patients. Results of CSF cfDNA were compared to standard CSF cytopathologic analysis from that same CSF sample and with MRI findings performed at the same time. When possible, we compared CSF cfDNA with DNA from tumor tissue (primary tumor and non-CNS sites) to determine similarities and differences in genetic alterations between these different compartments.
Newer biomarkers,techniques & their inclusion in 2016 WHO classification for leukaemia/lymphomas increases the responsibility of the pathologists, requiring to develop an integrated multidisciplinary approach for reporting.
Chronic myeloid leukemia (CML), also known as chronic myelogenous leukemia, is a type of
cancer that starts in the blood-forming cells of the bone marrow and invades the blood.
Each human cell contains 23 pairs of chromosomes. Most cases of CML start when a "swapping"
of chromosomal material (DNA) occurs between chromosomes 9 and 22 during cell division due
to attack of DNA by radiation or other damage. Part of chromosome 9 goes to 22 and part of 22
goes to 9. This is known as a translocation and gives rise to a chromosome 22 that is shorter than
normal. This new abnormal chromosome is known as the Philadelphia chromosome.
Proteomics Exploration of Chronic Lymphocytic Leukemia_Crimson PublishersCrimsonpublishersCancer
Chronic Lymphocytic Leukemia (CLL) is an adult heme malignancy characterized by the presence of mature-appearing CD5+ B cells in the blood, bone marrow, and secondary lymphoid organs [1]. In the United States, there will be an estimate of 20,720 new cases and 3,930 deaths according to the American Cancer Society statistics. Symptoms include swollen lymph nodes, frequent infections, and fatigue which negatively impacts the quality of life of people affected [1]. CLL is heterogeneous in its progression and clinical outcomes. Factors that contribute to the heterogeneity include the immunoglobulin heavy chain (IGHV) status and chromosomal aberrations [2,3]. There are two subtypes of CLL: Unmutated(U-CLL) and Mutated CLL(M-CLL). 40% and 60% of patients are diagnosed with unmutated and mutated CLL. U-CLL is characterized by the presence of CLL cells that have less than two percent of their IGHV mutated, whereas M-CLL cells have more than two percent mutated [4]. U-CLL is the more aggressive phenotype [2]. These cells have increased responsiveness to antigens that bind the B cell receptor (BCR) versus M-CLL cells [5]. M-CLL is the more indolent phenotype. Increased BCR signaling results in increased cell survival and proliferation [5].
Annals of Mutagenesis is an open access, peer reviewed, scholarly journal dedicated to publish articles covering all areas of Mutagenesis.
The journal aims to promote research communications and provide a forum for doctors, researchers, physicians and healthcare professionals to find most recent advances in all areas of Mutagenesis. Annals of Mutagenesis accepts original research articles, reviews, mini reviews, case reports and rapid communication covering all aspects of mutagenesis.
Annals of Mutagenesis strongly supports the scientific up gradation and fortification in related scientific research community by enhancing access to peer reviewed scientific literary works. Austin Publishing Group brings universally peer reviewed journals under one roof thereby promoting knowledge sharing, mutual promotion of multidisciplinary science.
The epigenetic regulation of DNA-templated processes has been intensely studied over the last 15
years. DNA methylation, histone modification, nucleosome remodeling, and RNA-mediated targeting regulate many biological processes that are fundamental to the genesis of cancer. Here, we
present the basic principles behind these epigenetic pathways and highlight the evidence suggesting that their misregulation can culminate in cancer. This information, along with the promising clinical and preclinical results seen with epigenetic drugs against chromatin regulators, signifies that it
is time to embrace the central role of epigenetics in cancer.
CRISPR-Cas9, a revolutionary gene-editing tool, holds immense potential to reshape medicine, agriculture, and our understanding of life. But like any powerful tool, it comes with ethical considerations.
Unveiling CRISPR: This naturally occurring bacterial defense system (crRNA & Cas9 protein) fights viruses. Scientists repurposed it for precise gene editing (correction, deletion, insertion) by targeting specific DNA sequences.
The Promise: CRISPR offers exciting possibilities:
Gene Therapy: Correcting genetic diseases like cystic fibrosis.
Agriculture: Engineering crops resistant to pests and harsh environments.
Research: Studying gene function to unlock new knowledge.
The Peril: Ethical concerns demand attention:
Off-target Effects: Unintended DNA edits can have unforeseen consequences.
Eugenics: Misusing CRISPR for designer babies raises social and ethical questions.
Equity: High costs could limit access to this potentially life-saving technology.
The Path Forward: Responsible development is crucial:
International Collaboration: Clear guidelines are needed for research and human trials.
Public Education: Open discussions ensure informed decisions about CRISPR.
Prioritize Safety and Ethics: Safety and ethical principles must be paramount.
CRISPR offers a powerful tool for a better future, but responsible development and addressing ethical concerns are essential. By prioritizing safety, fostering open dialogue, and ensuring equitable access, we can harness CRISPR's power for the benefit of all. (2998 characters)
How many patients does case series should have In comparison to case reports.pdfpubrica101
Pubrica’s team of researchers and writers create scientific and medical research articles, which may be important resources for authors and practitioners. Pubrica medical writers assist you in creating and revising the introduction by alerting the reader to gaps in the chosen study subject. Our professionals understand the order in which the hypothesis topic is followed by the broad subject, the issue, and the backdrop.
https://pubrica.com/academy/case-study-or-series/how-many-patients-does-case-series-should-have-in-comparison-to-case-reports/
Antibiotic Stewardship by Anushri Srivastava.pptxAnushriSrivastav
Stewardship is the act of taking good care of something.
Antimicrobial stewardship is a coordinated program that promotes the appropriate use of antimicrobials (including antibiotics), improves patient outcomes, reduces microbial resistance, and decreases the spread of infections caused by multidrug-resistant organisms.
WHO launched the Global Antimicrobial Resistance and Use Surveillance System (GLASS) in 2015 to fill knowledge gaps and inform strategies at all levels.
ACCORDING TO apic.org,
Antimicrobial stewardship is a coordinated program that promotes the appropriate use of antimicrobials (including antibiotics), improves patient outcomes, reduces microbial resistance, and decreases the spread of infections caused by multidrug-resistant organisms.
ACCORDING TO pewtrusts.org,
Antibiotic stewardship refers to efforts in doctors’ offices, hospitals, long term care facilities, and other health care settings to ensure that antibiotics are used only when necessary and appropriate
According to WHO,
Antimicrobial stewardship is a systematic approach to educate and support health care professionals to follow evidence-based guidelines for prescribing and administering antimicrobials
In 1996, John McGowan and Dale Gerding first applied the term antimicrobial stewardship, where they suggested a causal association between antimicrobial agent use and resistance. They also focused on the urgency of large-scale controlled trials of antimicrobial-use regulation employing sophisticated epidemiologic methods, molecular typing, and precise resistance mechanism analysis.
Antimicrobial Stewardship(AMS) refers to the optimal selection, dosing, and duration of antimicrobial treatment resulting in the best clinical outcome with minimal side effects to the patients and minimal impact on subsequent resistance.
According to the 2019 report, in the US, more than 2.8 million antibiotic-resistant infections occur each year, and more than 35000 people die. In addition to this, it also mentioned that 223,900 cases of Clostridoides difficile occurred in 2017, of which 12800 people died. The report did not include viruses or parasites
VISION
Being proactive
Supporting optimal animal and human health
Exploring ways to reduce overall use of antimicrobials
Using the drugs that prevent and treat disease by killing microscopic organisms in a responsible way
GOAL
to prevent the generation and spread of antimicrobial resistance (AMR). Doing so will preserve the effectiveness of these drugs in animals and humans for years to come.
being to preserve human and animal health and the effectiveness of antimicrobial medications.
to implement a multidisciplinary approach in assembling a stewardship team to include an infectious disease physician, a clinical pharmacist with infectious diseases training, infection preventionist, and a close collaboration with the staff in the clinical microbiology laboratory
to prevent antimicrobial overuse, misuse and abuse.
to minimize the developme
CHAPTER 1 SEMESTER V PREVENTIVE-PEDIATRICS.pdfSachin Sharma
This content provides an overview of preventive pediatrics. It defines preventive pediatrics as preventing disease and promoting children's physical, mental, and social well-being to achieve positive health. It discusses antenatal, postnatal, and social preventive pediatrics. It also covers various child health programs like immunization, breastfeeding, ICDS, and the roles of organizations like WHO, UNICEF, and nurses in preventive pediatrics.
Medical Technology Tackles New Health Care Demand - Research Report - March 2...pchutichetpong
M Capital Group (“MCG”) predicts that with, against, despite, and even without the global pandemic, the medical technology (MedTech) industry shows signs of continuous healthy growth, driven by smaller, faster, and cheaper devices, growing demand for home-based applications, technological innovation, strategic acquisitions, investments, and SPAC listings. MCG predicts that this should reflects itself in annual growth of over 6%, well beyond 2028.
According to Chris Mouchabhani, Managing Partner at M Capital Group, “Despite all economic scenarios that one may consider, beyond overall economic shocks, medical technology should remain one of the most promising and robust sectors over the short to medium term and well beyond 2028.”
There is a movement towards home-based care for the elderly, next generation scanning and MRI devices, wearable technology, artificial intelligence incorporation, and online connectivity. Experts also see a focus on predictive, preventive, personalized, participatory, and precision medicine, with rising levels of integration of home care and technological innovation.
The average cost of treatment has been rising across the board, creating additional financial burdens to governments, healthcare providers and insurance companies. According to MCG, cost-per-inpatient-stay in the United States alone rose on average annually by over 13% between 2014 to 2021, leading MedTech to focus research efforts on optimized medical equipment at lower price points, whilst emphasizing portability and ease of use. Namely, 46% of the 1,008 medical technology companies in the 2021 MedTech Innovator (“MTI”) database are focusing on prevention, wellness, detection, or diagnosis, signaling a clear push for preventive care to also tackle costs.
In addition, there has also been a lasting impact on consumer and medical demand for home care, supported by the pandemic. Lockdowns, closure of care facilities, and healthcare systems subjected to capacity pressure, accelerated demand away from traditional inpatient care. Now, outpatient care solutions are driving industry production, with nearly 70% of recent diagnostics start-up companies producing products in areas such as ambulatory clinics, at-home care, and self-administered diagnostics.
The Importance of Community Nursing Care.pdfAD Healthcare
NDIS and Community 24/7 Nursing Care is a specific type of support that may be provided under the NDIS for individuals with complex medical needs who require ongoing nursing care in a community setting, such as their home or a supported accommodation facility.
Navigating Challenges: Mental Health, Legislation, and the Prison System in B...Guillermo Rivera
This conference will delve into the intricate intersections between mental health, legal frameworks, and the prison system in Bolivia. It aims to provide a comprehensive overview of the current challenges faced by mental health professionals working within the legislative and correctional landscapes. Topics of discussion will include the prevalence and impact of mental health issues among the incarcerated population, the effectiveness of existing mental health policies and legislation, and potential reforms to enhance the mental health support system within prisons.
Leading the Way in Nephrology: Dr. David Greene's Work with Stem Cells for Ki...Dr. David Greene Arizona
As we watch Dr. Greene's continued efforts and research in Arizona, it's clear that stem cell therapy holds a promising key to unlocking new doors in the treatment of kidney disease. With each study and trial, we step closer to a world where kidney disease is no longer a life sentence but a treatable condition, thanks to pioneers like Dr. David Greene.
The dimensions of healthcare quality refer to various attributes or aspects that define the standard of healthcare services. These dimensions are used to evaluate, measure, and improve the quality of care provided to patients. A comprehensive understanding of these dimensions ensures that healthcare systems can address various aspects of patient care effectively and holistically. Dimensions of Healthcare Quality and Performance of care include the following; Appropriateness, Availability, Competence, Continuity, Effectiveness, Efficiency, Efficacy, Prevention, Respect and Care, Safety as well as Timeliness.
Telehealth Psychology Building Trust with Clients.pptxThe Harvest Clinic
Telehealth psychology is a digital approach that offers psychological services and mental health care to clients remotely, using technologies like video conferencing, phone calls, text messaging, and mobile apps for communication.
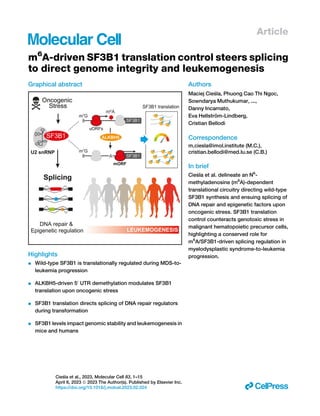
1. Article
m6
A-driven SF3B1 translation control steers splicing
to direct genome integrity and leukemogenesis
Graphical abstract
Highlights
d Wild-type SF3B1 is translationally regulated during MDS-to-
leukemia progression
d ALKBH5-driven 50
UTR demethylation modulates SF3B1
translation upon oncogenic stress
d SF3B1 translation directs splicing of DNA repair regulators
during transformation
d SF3B1 levels impact genomic stability and leukemogenesis in
mice and humans
Authors
Maciej Cie
sla, Phuong Cao Thi Ngoc,
Sowndarya Muthukumar, ...,
Danny Incarnato,
Eva Hellström-Lindberg,
Cristian Bellodi
Correspondence
m.ciesla@imol.institute (M.C.),
cristian.bellodi@med.lu.se (C.B.)
In brief
Cie
sla et al. delineate an N6
-
methyladenosine (m6
A)-dependent
translational circuitry directing wild-type
SF3B1 synthesis and ensuing splicing of
DNA repair and epigenetic factors upon
oncogenic stress. SF3B1 translation
control counteracts genotoxic stress in
malignant hematopoietic precursor cells,
highlighting a conserved role for
m6
A/SF3B1-driven splicing regulation in
myelodysplastic syndrome-to-leukemia
progression.
Cie
sla et al., 2023, Molecular Cell 83, 1–15
April 6, 2023 ª 2023 The Author(s). Published by Elsevier Inc.
https://doi.org/10.1016/j.molcel.2023.02.024 ll
2. Article
m6
A-driven SF3B1 translation control
steers splicing to direct genome integrity
and leukemogenesis
Maciej Cie
sla,1,2,* Phuong Cao Thi Ngoc,1 Sowndarya Muthukumar,1 Gabriele Todisco,3 Magdalena Madej,1 Helena Fritz,1
Marios Dimitriou,3 Danny Incarnato,4 Eva Hellström-Lindberg,3 and Cristian Bellodi1,5,*
1Division of Molecular Hematology, Department of Laboratory Medicine, Lund Stem Cell Center, Faculty of Medicine, Lund University, 22184
Lund, Sweden
2International Institute of Molecular Mechanisms and Machines, Polish Academy of Sciences, Warsaw, Poland
3Center for Hematology and Regenerative Medicine, Department of Medicine, Karolinska Institute, Stockholm, Sweden
4Department of Molecular Genetics, Groningen Biomolecular Sciences and Biotechnology Institute (GBB), University of Groningen,
Groningen, the Netherlands
5Lead contact
*Correspondence: m.ciesla@imol.institute (M.C.), cristian.bellodi@med.lu.se (C.B.)
https://doi.org/10.1016/j.molcel.2023.02.024
SUMMARY
SF3B1 is the most mutated splicing factor (SF) in myelodysplastic syndromes (MDSs), which are clonal he-
matopoietic disorders with variable risk of leukemic transformation. Although tumorigenic SF3B1 mutations
have been extensively characterized, the role of ‘‘non-mutated’’ wild-type SF3B1 in cancer remains largely
unresolved. Here, we identify a conserved epitranscriptomic program that steers SF3B1 levels to counteract
leukemogenesis. Our analysis of human and murine pre-leukemic MDS cells reveals dynamic regulation of
SF3B1 protein abundance, which affects MDS-to-leukemia progression in vivo. Mechanistically, ALKBH5-
driven 50
UTR m6
A demethylation fine-tunes SF3B1 translation directing splicing of central DNA repair and
epigenetic regulators during transformation. This impacts genome stability and leukemia progression in vivo,
supporting an integrative analysis in humans that SF3B1 molecular signatures may predict mutational vari-
ability and poor prognosis. These findings highlight a post-transcriptional gene expression nexus that unveils
unanticipated SF3B1-dependent cancer vulnerabilities.
INTRODUCTION
More than 90% of human protein-coding transcripts undergo
differential inclusion or exclusion of exon and intron cassettes
generating multiple mRNA isoforms to ensure cell-specific
spatiotemporal proteome diversity.1
This evolutionarily essen-
tial process known as alternative splicing (AS) is catalyzed by
a highly dynamic multi-subunit complex, spliceosome, con-
sisting of small non-coding (nc) RNAs (U1, U2, U4, U5, and
U6) and more than a hundred associated splicing factors
(SFs).2
Dysregulation of AS is common in cancer in conjunc-
tion with mutations in prominent SF-encoding genes such as
SF3B1, SRSF2, and U2AF1.3
Notably, genome-wide splicing
defects may occur even in the absence of SF mutations, sug-
gesting that additional regulatory layers may impact splicing in
cancer cells.4
We recently uncovered a translation-based tumorigenic
program that governs SF abundance downstream of major
oncogenic pathways (MYC, RAS, and AKT/mTOR) impinging
on central SF3 complex subunits often altered in cancer.5
A
striking example is SF3B1 (SF 3B subunit 1), a core compo-
nent of the U2 small ribonucleoprotein (snRNP) involved in
pre-mRNA binding and recognition of the intronic branch-
point sequence (BPS) during the earliest steps that define
splicing fidelity.6–8
Accordingly, recurrent point mutations in
the SF3B1 gene are associated with aberrant 30
splice site
(ss) selection and AS defects in cancer cells.9
SF3B1 gene
alterations are common to hematological and solid cancers
and particularly widespread in myelodysplastic syndrome
(MDS).10–12
At the cellular level, SF3B1 mutations are invari-
ably heterozygous and mutually exclusive for other SF genetic
alterations, illustrating a critical dependency for the wild-type
(WT) SF alleles in disease.3,12,13
Additionally, findings that
cancer-associated SF3B1 copy number loss affected AS-
yielding cancer vulnerabilities suggest that perturbations of
SF3B1 may impact cancer cell growth, reducing U2 snRNP
biogenesis and function.14
However, how non-mutated
SF3B1 is molecularly controlled in cancer and whether its dys-
regulation impacts genome-wide splicing and leukemogen-
esis are outstanding questions.
Molecular Cell 83, 1–15, April 6, 2023 ª 2023 The Author(s). Published by Elsevier Inc. 1
This is an open access article under the CC BY license (http://creativecommons.org/licenses/by/4.0/).
ll
OPEN ACCESS
Please cite this article in press as: Cie
sla et al., m6
A-driven SF3B1 translation control steers splicing to direct genome integrity and leukemogenesis,
Molecular Cell (2023), https://doi.org/10.1016/j.molcel.2023.02.024
3. RESULTS
Evolutionary conserved SF3B1 translation control
affects MDS progression to AML
We initially sought to determine how the WT SF3B1 expression
was modulated in a small cohort of MDS patients without SF mu-
tations at different disease stages (Table S1). Strikingly, SF3B1
protein levels were significantly elevated in CD34+
primary
MDS-derived hematopoietic stem and progenitor cells (HSPCs)
compared with age-matched healthy controls and secondary
acute myeloid leukemia (sAML) specimens in the absence of
transcriptional changes (Figure 1A; STAR Methods). Likewise,
longitudinal data analysis using consecutive HSPC samples
from three distinct MDS patients revealed a sharp reduction of
SF3B1 protein, but not mRNA, abundance during progression
(Figure 1B).
To determine whether kinetic modulation of SF3B1 abundance
was involved in the MDS-to-leukemia transition in vivo, we moni-
tored protein levels in hematopoietic stem cells (HSCs) (Lin/
Sca1+/Kit+/CD48/CD150+), from transgenic mice expressing
the NUP98-HOXD13 fusion protein (NHD13) in the hematopoietic
tissue, faithfully recapitulating the major pathological features of
human MDS including transformation to AML (Figures S1A–
S1D).15
Consistent with our findings in humans, we observed a
30%–40% increase in Sf3b1 protein in HSCs derived from
4-month-old NHD13 compared with WT littermates prior to dis-
ease onset (Figure 1C). Conversely, Sf3b1 protein levels declined
at 12 months of age upon leukemic transformation, closely
Figure 1. Evolutionary conserved SF3B1 translation control impacts MDS progression to AML
(A) Graphs show SF3B1 protein (top) and mRNA (bottom) levels measured by intracellular flow cytometry (icFlow) and quantitative real-time PCR, respectively, in
patient-derived CD34+ cells from healthy control (HC, n = 3), myelodysplastic syndrome (MDS, n = 7), and secondary AML (sAML, n = 4). **p 0.01, *p 0.05 (one-
way ANOVA).
(B) Schematic illustrates icFlow SF3B1 protein analysis in CD34+ cells from three MDS patients with matching samples before (low-risk MDS [LR-MDS] - PRE)
and after progression to aggressive high-risk MDS/leukemia (HR-MDS/sAML). Graphs show quantification of SF3B1 mRNA (left) and protein (right) levels in the
matching patient samples. ****p 0.0001, **p 0.01 (t test).
(C) Histogram shows increased Sf3b1 levels in hematopoietic stem cells (HSCs; lineage Sca1+ cKIT+ CD48 CD150+) from MDS-prone (NHD13) mice at 4–5
(MDS) and 12 (leukemic) months of age compared with littermate controls (WT). Graph shows mean Sf3b1 fluorescence intensity (MFI) ± SD measured by
icFlow, n = 7 per group. **p 0.01 (t test).
(D) Schematic of the CFU assay with HSCs from NHD13 mice ± shRNA targeting Sf3b1. Graph shows colony number ± SD at different platings, n = 4. ***p 0.001,
**p 0.01, *p 0.05 (one-way ANOVA, shCTRL vs. shSf3b1). Representative images show changes in morphology assessed by May-Gr€
unwald-Giemsa staining.
Inset shows decreased Sf3b1 protein levels in shSf3b1 compared with shCTRL cells.
(E) Sf3b1 downregulation increases leukemic transformation in vivo. Two hundred sorted NHD13 HSCs (CD45.2) were transduced with two independent shSf3b1 or
shCTRL and transplanted into lethally (900 cGy) irradiated congenic CD45.1/2 animals. Leukemic transformation was monitored over 60 weeks post-transplantation.
(F) Sf3b1 downregulation promotes leukemogenesis in primary NHD13 grafts. Kaplan-Meier curves show leukemia-free survival in shCTRL (n = 8) and shSf3b1-1
(n = 8) or shSf3b1-2 (n = 7) animals. *p 0.05 (Mantel-Cox test). Graph shows reduced Sf3b1 mRNA levels upon shSf3b1 in NHD13-derived bone marrow cells
harvested at the experimental endpoint ± SD, n = 2–4. **p 0.01, *p 0.05 (one-way ANOVA).
(G) Representative FACS analysis of leukemia blasts (CD11b+ cKIT+) from the BM of secondary transplantation of NHD13 shCTRL and shSf3b1-1. Graph shows
percentages of blasts ± SD, n = 4 animals per group. ***p 0.001, **p 0.01 (one-way ANOVA) (G).
See also Figure S1 and Table S1.
ll
OPEN ACCESS Article
2 Molecular Cell 83, 1–15, April 6, 2023
Please cite this article in press as: Cie
sla et al., m6
A-driven SF3B1 translation control steers splicing to direct genome integrity and leukemogenesis,
Molecular Cell (2023), https://doi.org/10.1016/j.molcel.2023.02.024
4. recapitulating the changes observed in MDS-progressing pa-
tients (Figures 1C and S1B). Furthermore, the clonogenic poten-
tial of pre-leukemic MDS NHD13 HSCs was drastically increased
upon shRNA lentiviral-mediated Sf3b1 knockdown (shSf3b1)
compared with shRNA control (shCTRL) (Figures 1D and S1E).
Of note, partial Sf3b1 downmodulation did not affect the differen-
tiation and colony-forming capacity of WT HSCs (Figures S1E and
S1F), highlighting a specific effect toward restoring MDS HSC
function. We observed a similar remarkable increase in clono-
genic potential upon SF3B1 downregulation in patient-derived
MDS HSPCs (Figure S1G).
Based on these results and previous studies illustrating that
malignant HSPC subsets drive MDS evolution in vivo,16,17
we
asked whether hampering SF3B1 upregulation in pre-leukemic
HSC affected transformation in vivo upon serial transplantation.
Thus, we transplanted 200 highly purified NHD13 HSCs infected
with lentiviral shRNAs (shSf3b1) that steadily reduced Sf3b1
levels (50%) over long periods (1 year) into lethally irradiated
congenic 10-week-old recipients (Figure 1E). After an initial
phase characterized by low NHD13-derived chimerism in pe-
ripheral blood (PB), consistent with the dysplastic features and
ineffective hematopoietic outputs from NHD13-derived MDS
HSCs,17
Sf3b1 depletion dramatically accelerated leukemic
transformation (Figure 1F). Indeed, we observed 50% pene-
trance of leukemia in the shSf3b1 group starting from 30 weeks
post-transplantation as revealed by the number of circulating
blasts, splenomegaly, and other macroscopic abnormalities
associated with leukemic transformation (Figure 1F and not
shown). In stark contrast, none of the mice transplanted with
shCTRL-NHD13 HSCs developed overt leukemia as previously
reported.17
By extension, we observed a pronounced increase
in leukemic transformation upon whole bone marrow (WBM)
secondary transplantation of non-leukemic shSf3B1 compared
with shCTRL NHD13 mice (Figures 1G, S1H, and S1I). This effect
occurred despite the overall low bone marrow chimerism
observed in shSf3b1 grafts (6.9% ± 1%) compared with control
(50.5% ± 20.3%) at the beginning of the secondary transplanta-
tion, further illustrating the aggressive malignant phenotype of
shSf3B1 NHD13 grafts. Together, these results strongly suggest
that SF3B1 post-transcriptional regulation may provide an evolu-
tionarily conserved mechanism to offset leukemic transforma-
tion by harnessing MDS-initiating HSC populations.
Oncogenic-driven SF3B1 translation affects splicing of
DNA repair and epigenetic regulators and genome
integrity
Motivated by our recent work illustrating that translation critically
fine-tunes SF abundance and function following oncogenic
stress and evidence that dysregulation of protein synthesis pro-
vides a cancer susceptibility in MDS,18–20
we reasoned that
SF3B1 might be controlled at the translation level to impact
splicing during MDS transformation. Intriguingly, we previously
showed that SF3B1 is post-transcriptionally regulated in primary
human diploid fibroblasts (HDFs) upon MYC activation, a major
oncogenic event associated with an early MDS-to-AML progres-
sion.21
Thus, we used these cells to model the oncogenic stress
response and analyzed SF3B1 translation dynamics by moni-
toring polysomal mRNA fractions before and after transforma-
tion driven by combinations of MYC and RAS oncogenes22
(Fig-
ure 2A). We found that SF3B1 translation rapidly increased
following MYC hyperactivation (24 h) and decreased upon
transformation induced by MYC and RAS co-expression
(Figures 2A and S2A). Importantly, MYC-induced SF3B1 transla-
tional burst was cap-dependent as selective inhibition of eIF4E
prevented accumulation of the protein (Figure S2B).23,24
Further-
more, SF3B1 upregulation enhanced binding to U2 snRNA upon
MYC hyperactivation, suggesting that fine-tuned SF3B1 transla-
tion may provide a critical reservoir of U2 snRNPs to ensure
splicing accuracy upon stress (Figures 2B and S2C). This effect
is consistent with previous findings that SF3B1 suppression im-
pacts U2 snRNP biogenesis, leading to AS splicing defects and
impaired tumor growth in vivo.14
Accordingly, targeting SF3B1
upregulation selectively increased MYC-induced cell death
without affecting control cells (Figure 2C). This reveals an unan-
ticipated dichotomy by which SF3B1 upregulation is needed to
rapidly ensure cellular homeostasis following oncogenic stress,
whereas repression is required to establish the malignant pheno-
type fully.
To delineate whether changes in SF3B1 abundance impacted
splicing fidelity before transformation, we performed paired-end
RNA sequencing directly in MYC-expressing HDF with or without
SF3B1 knockdown (SF3B1-KD) before the effects on cell viability
(Figure 2D). Analysis of triplicate experiments using rMATS25
identified widespread alterations in 10,000 AS events (ASEs) en-
riched for exon skipping (SE) in a subset of 4,130 mRNAs (Fig-
ure 2D; Table S2). Notably, differentially spliced exons in
SF3B1-KD cells shared specific features contributing to alterna-
tive exon usages such as short length, reduced GC content,
increased pyrimidine content between branch point (BP) and
downstream intron 30
ss, and were mostly retained within long
multi-exonic transcripts (Figures S2D–S2H). The qualitative ef-
fects on AS were distinct from those associated with SF3B1 point
mutations in MDS9,26,27
and consistent with SF3B1 pharmacolog-
ical inhibition predominantly inducing SE.28
Strikingly, analysis of
AS and differentially expressed genes (DEGs) revealed a signifi-
cant overlap consisting of 1,320 mRNAs (30%) primarily
involved in pathways associated with the DNA damage response
(DDR) (Figure 2E; Table S3). Interestingly, SF3B1-dependent AS
mRNAs significantly overlapped with SF3B1-bound transcripts
in leukemic cells,29
defining specificity of this SF for distinct mo-
lecular programs (Figure S2I). Indeed, we observed that promi-
nent components of the DDR signaling cascade such as ATM,
ATR, CHEK2, TP53BP1, ATRIP, RIF1, and ATRX were reduced
upon SF3B1 depletion in MYC-expressing cells (Figures 2F,
S2J, and S2K). We reported perturbations in p53 regulators and
multiple Polycomb group (PcG) members, including subunits of
the Polycomb repressor complex 2 (PRC2), such as EZH2,
frequently altered in MDS and AML,30
with essential roles in
genomic integrity and surveillance (Figures 2F, S2J, and S2K).31
Building on these results and evidence that oncogene expression,
including MYC, is associated with increased genotoxic stress and
genomic instability,32,33
we examined whether perturbations of
splicing related to DDR/epigenetic regulations led to genomic in-
stabilities downstream of SF3B1. Accordingly, we found that
SF3B1 depletion impaired DDR resulting in an accumulation of
g-H2AX foci and compromised DNA integrity, as evidenced by
ll
OPEN ACCESS
Article
Molecular Cell 83, 1–15, April 6, 2023 3
Please cite this article in press as: Cie
sla et al., m6
A-driven SF3B1 translation control steers splicing to direct genome integrity and leukemogenesis,
Molecular Cell (2023), https://doi.org/10.1016/j.molcel.2023.02.024
5. an increase in double-stranded breaks generating comet tail
following MYC hyperactivation (Figures 2G and 2H).
To examine the direct implications of these findings in the
context of MDS-to-leukemia transformation, we compared the ef-
fectsofSF3B1downregulationinMYC-overexpressingHDFwitha
recently published SF3B1-dependent splicing dataset in leuke-
mia34
(Figure 3A). Consistent with our results that SF3B1 inhibition
alters SE of DDR-related transcripts leading to perturbed DNA
repair in leukemic cells, there was a remarkable overlap between
the SF3B1-dependent splicing programs in fibroblasts and
leukemic cells. This was highlighted by the common subsets con-
sisting of 1,114 (27%) alternatively spliced mRNAs enriched for
components of the DNA repair pathway (Figure 3A). These results
prompted us to hone in on the genotoxic stress-related pathways
regulated downstream of SF3B1 during MDS progression in vivo.
Indeed, we observed a direct correlation between SF3B1 protein
and splicing of DDR factors in HSPCs from a cohort of 29 MDS pa-
tients with 5q deletion (del5q) and no SF mutations, which were
Figure 2. Oncogenic-driven SF3B1 translation rewires AS of DNA repair and epigenetic regulators
(A) Polysomal analysis of SF3B1 mRNA in HDF undergoing MYC-induced oncogenic stress (24 h) or transformed by MYC and RAS co-expression. The polysome
profile (gray shade) indicates the relative absorbance at 254 nm. Graph shows mean SF3B1 mRNA abundance in each polysomal fraction ± SD, n = 3. Right,
representative western blot analysis of SF3B1 expression in response to MYC and MYC + RAS in human fibroblasts and mRNA expression analysis showing no
difference in SF3B1 transcript levels between CTRL, MYC, and MYC + RAS fibroblasts. *p 0.05 (one-way ANOVA).
(B) U2 snRNA pulldown reveals increased SF3B1 binding upon MYC induction. Graph shows mean SF3B1 bound to U2 snRNA in n = 4 experiments. *p 0.05
(one-way ANOVA).
(C) Representative SF3B1 western blot in HDF transduced with lentiviral shCTRL or shSF3B1 ± MYC. Graph shows mean percentage of apoptotic shSF3B1-
transduced HDF ± SD upon MYC activation (72 h), n = 3. *p 0.05 (one-way ANOVA).
(D) SF3B1 depletion affects MYC-driven ASE. Top: experimental setup employed to capture splicing changes following MYC activation ± shSF3B1. Dot plot
shows percent spliced-in (PSI) values for individual ASEs in MYC (x axis) and MYC + shSF3B1 (y axis) fibroblasts. Significantly increased (red) or decreased (blue)
ASEs in MYC + shSF3B1 are highlighted, n = 3. Bottom: bar graph shows numbers of skipped exons (SEs), mutually exclusive exons (MXEs), alternative 30
splice
sites (A3SSs), alternative 50
splice sites (A5SSs), and retained introns (RIs) in MYC + shSF3B1. ****p 0.0001 (Pearson correlation coefficient).
(E) Venn diagram shows the overlap between ASE and DEG in MYC + shSF3B1 compared with MYC fibroblasts (top). p value = 1.96E65 calculated with Pearson
correlation coefficient indicates a significant overlap between DEG and ASE. Gene ontology (GO) analysis for 1,320 overlapping mRNAs is shown (bottom).
(F) Interaction maps of DDR and PRC2 components alternatively spliced and differentially expressed in MYC + shSF3B1 cells (top). Connecting lines show
interactions from STRINGdb. Representative isoform-specific PCR analysis of ATR exon 9 and EZH2 exon 14 inclusion in MYC and MYC + shSF3B1 fibroblasts.
Corresponding Sashimi plots show differential exon skipping for ATR exon 9 and EZH2 exon 14 inclusion in MYC and MYC + shSF3B1 HDF.
(G) Immunofluorescence analysis shows increased g-H2AX staining in MYC + shSF3B1 HDF compared with CTRL, MYC, and shSF3B1 alone (48 h).
(H) Graph shows olive moment (OM) in CTRL, MYC, shSF3B1, and MYC + shSF3B1 HDF measured by comet assay. ***p 0.001, *p 0.05 (one-way ANOVA).
See also Figure S2 and Tables S2 and S3.
ll
OPEN ACCESS Article
4 Molecular Cell 83, 1–15, April 6, 2023
Please cite this article in press as: Cie
sla et al., m6
A-driven SF3B1 translation control steers splicing to direct genome integrity and leukemogenesis,
Molecular Cell (2023), https://doi.org/10.1016/j.molcel.2023.02.024
6. stratified based on MYC expression (Figure 3B; Tables S1 and S4).
To determine evolutionarily conserved molecular pathways gov-
erned by SF3B1 in MDS, we performed a transcriptomic analysis
inpre-leukemicNHD13 cKIT+
-enriched HSPCsuponSf3b1 deple-
tion (Figures 3C, S3A, and S3B; Table S5). This revealed that AS
patterns broadly associated with SE in mRNAs enriched for DDR
components including Atr, Fmr1, and Smc6, upon Sf3b1 downre-
gulation (72 h) (Figures 3D and S3B). In keeping with recent data
from human T cell acute lymphoblastic leukemia (T-ALL) and
HEK293T cells with SF3B1 KD,34,35
we observed higher g-H2AX
Figure 3. SF3B1 downregulation impacts AS of DDR-related programs and associates with genomic instability upon MDS progression
(A) Venn diagram shows a significant overlap between AS transcripts in SF3B1-depleted MYC-expressing HDF and T-ALL cells,34
namely CUTLL1 (left). Pearson
correlation coefficient p value = 1.3E319. Gene ontology (GO) analysis for 1,114 overlapping mRNAs is shown (right).
(B) Venn diagram shows a significant overlap between AS transcripts in SF3B1-depleted MYC-expressing HDF and del5q MDS patients stratified based on MYC
expression (MYC-HIGH vs. MYC-LOW) (left). Gene ontology (GO) analysis for 639 mRNAs alternatively spliced between MYC-HIGH and -LOW groups is
shown (right).
(C) Schematic depicts the strategy used to delineate Sf3b1-dependent AS changes in NHD13-derived HSPCs (cKIT+) transduced with lentiviral vectors harboring
shCTR or shSf3b1.
(D) Left, waterfall plots show change in percent spliced-in (DPSI) for individual type of splicing events between shCTRL and shSf3b1 NHD13 HSPCs. Inset shows
representative Sf3b1 protein analysis in HSPCs ± shSf3b1. Right, gene ontology (GO) analysis of 198 significantly altered AS transcripts upon Sf3b1 depletion in
these cells.
(E) Representative flow cytometric analysis of NHD13 HSCs shows higher g-H2AX levels in shSf3b1 compared with shCTRL from 60 weeks 1ary
transplantation
grafts. Quantification of g-H2AX mean fluorescence intensity (MFI) ± SD, n = 4. **p 0.01, *p 0.05 (one-way ANOVA).
(F) Analysis of DNA integrity in NHD13 HSCs infected with shSf3b1 or shCTRL isolated from primary recipients. Left, representative images of comet assay. Right,
graph shows Tail Moment in cells from three shCTRL and shSf3b1 mice ± SD. ****p 0.001 (t test).
See also Figure S3 and Tables S4 and S5.
ll
OPEN ACCESS
Article
Molecular Cell 83, 1–15, April 6, 2023 5
Please cite this article in press as: Cie
sla et al., m6
A-driven SF3B1 translation control steers splicing to direct genome integrity and leukemogenesis,
Molecular Cell (2023), https://doi.org/10.1016/j.molcel.2023.02.024
7. and DNA break levels specifically in transplanted Sf3b1-KD pre-
leukemic NHD13 HSPCs compared with shCTRL (Figures 3E,
3F, and S3C). These data suggest that SF3B1 loss favors genomic
instability and may contribute to the selection of malignant
leukemic clones and increased transformation rates in vivo.
SF3B1 defines distinct molecular programs in human
leukemias
Genomic instability is a major cancer hallmark associated with
MYC hyperactivation32,36
and is critically involved in MDS and
AML etiology.37–39
Thus, we sought to establish the clinical impli-
cations of SF3B1 translation control for leukemia evolution in
humans. To this end, we integrated our transcriptomic analysis
in MYC-expressing HDF (Figure 2D) with recently published
splicing datasets in SF3B1-depleted leukemic cells.34
This es-
tablished a unique SF3B1-dependent gene expression signature
(SF3B1-GS) consisting of a high-confidence, common set of 275
transcripts differentially spliced and expressed upon SF3B1
downregulation (Figure 4A; Table S6). Using SF3B1-GS as a
readout for SF3B1 activity, we performed a rank-based scoring
Figure 4. SF3B1-driven molecular signature defines the mutational burden in human AML
(A) A combined splicing analysis of SF3B1-depleted MYC-expressing HDF and T-ALL cells34
was used as a training set to establish the SF3B1-GS, which was
used to interrogate Mills et al.40
and TCGA_LAML datasets (left). Graph shows SF3B1-GS distributions between healthy control, MDS, and AML patients. p values
are shown (Mann-Whitney U test).
(B) Co-analysis of SF3B1-GS and mRNA in MDS and leukemia patients from Mills et al.40
Graph shows correlations between SF3B1-GS and SF3B1 mRNA.
R coefficient of determination and p value are indicated (Pearson correlation coefficient).
(C) Graph shows heterogeneous SF3B1-GS distribution in patients from TCGA-LAML (n = 173).
(D) Heatmap shows fold change in expression of selected DNA damage response and PRC2 components between patients with high (n = 44) and low (n = 44)
SF3B1-GS.
(E) GSEA analysis of TCGA-LAML dataset illustrates the positive correlation of SF3B1-GS with DNA repair-related pathways and negative association with
immune response gene sets.
(F) Waterfall plot shows enriched (red) and depleted (blue) gene mutations in 1st
and 4th
quartile SF3B1-GS TCGA-LAML patients. Bottom histograms illustrate the
number of mutations per individual patient with mean mutation number in LOW and HIGH SF3B1-GS groups. ***p 0.001 (t test).
(G) Kaplan-Meier plot shows reduced overall survival (OS) of SF3B1-GS below (n = 73) compared with above (n = 76) median patient groups from TCGA-LAML.
p = 0.04 (Mantel-Cox test).
See also Figure S4 and Table S6.
ll
OPEN ACCESS Article
6 Molecular Cell 83, 1–15, April 6, 2023
Please cite this article in press as: Cie
sla et al., m6
A-driven SF3B1 translation control steers splicing to direct genome integrity and leukemogenesis,
Molecular Cell (2023), https://doi.org/10.1016/j.molcel.2023.02.024
8. of individual MDS and AML samples without any SF mutations
from published large-scale studies.40,41
Strikingly, we found sig-
nificant differences in the average distribution of SF3B1-GS
enrichment scores across patients with the MDS and AML sub-
groups having the highest and lowest levels, respectively (Fig-
ure 4A). These differences were independent of transcription
and corroborated the dynamic SF3B1 protein changes observed
upon MDS-to-AML transformation in vivo (Figure 4B). To further
investigate whether SF3B1-GS could define molecular and
phenotypic features associated with distinct AML clinical out-
comes, we investigated a publicly available dataset from The
Cancer Genome Atlas (TCGA).41
SF3B1-GS analysis in 173
AML cases patients with clinical follow-ups showed heteroge-
neous enrichment levels independent of SF3B1 transcription
but significantly correlating with MYC molecular signature5
and
was further validated in an independent cohort of 29 del5q
MDS patients (Figures 4C and S4A–S4D). These differences
were indicative of SF3B1 activity as revealed by differences in
the expression of the core DDR pathway components between
the upper (SF3B1-GS high) and lower quartiles (SF3B1-GS
low) (Figure 4D). Gene set enrichment analysis (GSEA) further
highlighted a significant co-segregation between DNA repair
mechanisms such as DNA replication, homologous recombina-
tion, nucleotide excision repair, p53 signaling, and SF3B1-GS
high leukemias. By contrast, immunomodulation and immune
response processes were predominant terms in patients with
low SF3B1 molecular signatures (Figure 4E). Strikingly, we found
that the mutational repertoire was directly associated with
SF3B1 molecular signatures in this cohort of leukemia patients
(Figure 4F) with a significant reduction of the overall mutation
spectrum in SF3B1-GS high specimens (Figure 4F). These find-
ings corroborated evidence that SF3B1 may be critical for main-
taining genome integrity, resulting in fewer genomic alterations
and possibly limited clonal distribution. Accordingly, there was
a slight but significant difference in overall survival (OS) between
leukemic patients below and above median SF3B1-GS, indi-
cating that higher SF3B1-GS scores may predict better clinical
outcomes despite the small sample size (Figure 4G).
m6
A/ALKBH5-based circuit controls SF3B1 50
UTR
translation initiation site choice in oncogenic stress
Translation initiation is the rate-limiting step that critically adapts
the cellular proteome to physiological and stress conditions
such as oncogenic activation.42
This process involves translation
regulatory elements (TREs) such as motifs, RNA structures, and
upstream open reading frames (uORFs) embedded within the
mRNA 50
leader sequence.43
Our data mining, sequence, and
structural probing by RNA ligase-mediated rapid amplification of
coding ends (RLM-RACEs) and dimethyl sulfate mutational
profiling by sequencing (DMS-MaPseq) determined a largely un-
structured and conserved 92-nt long SF3B1 50
UTR characterized
by the presence of two non-canonical uORFs, uORF1, and uORF2
overlapping with the coding sequence (CDS) (Figures 5A, 5B, and
S5A–S5C). A closer examination further identified a putative
RRACH motif possibly directing methylation of the adenosine
(A) at position 88 near the main ORF (mORF) (Figures 5B and
S5A). Motivated by this observation, we re-analyzed publicly
available m6
A-seq datasets44
and revealed a specific peak indic-
ative of an m6
A within the SF3B1 50
UTR sequence overlapping
the predicted RRACH motif (Figures 5C, S5D, and S5E). Previous
studies highlighted a key role for 50
UTR methylation in ribosome
scanning and alternative start codon selection upon nutrient
deprivation.45
Thus, we sought to delineate whether SF3B1 trans-
lation reprogramming involved m6
A-mediated re-initiation events
at uORFs. To this end, we employed monocistronic luciferase re-
porters to assess the activity of the full-length SF3B1 50
UTR WT
and m6
A mutants, harboring key single nucleotide substitutions
within the RRACH motif (A88GMUT
and C89TMUT
), upon MYC hy-
peractivation (Figure 5D). Significantly, this analysis indicated that
the lack of m6
A88 phenocopied MYC-induced SF3B1 upregula-
tion, leading to sustained levels of luciferase translation. Next,
we validated these results using methylated RNA immunoprecip-
itation (me-RIP)-qPCR, which revealed a significant depletion of
m6
A88 in SF3B1 50
UTR WT transcripts immunoprecipitated
following MYC overexpression to comparable levels with those
of SF3B1 50
UTR A88GMUT
(Figure 5E). Similarly, pervasive
SF3B1 translation was achieved by site-directed mutagenesis of
the non-canonical upstream start codons, UUG (uORF1) and
GUG (uORF2) (Figure S5F), which is consistent with previous
data that m6
A favors re-initiation at these translation initiation sites
(TISs).45
Hence, to directly monitor ribosome occupancy at these
upstream initiation codons, we performed a toeprinting assay
using in vitro-transcribed SF3B1 50
UTR WT incubated with cell ly-
sates prepared in the absence (CTRL) or presence of MYC hyper-
activation.46
These experiments delineated a differential accumu-
lation of ribosome footprints from the non-canonical UUG and
GUG start sites to the main AUG upon MYC (Figure 5F). As ex-
pected, mutation of the critical m6
A88 site yielded a substantial
accumulation of ribosomes at the annotated TIS, which molecu-
larly mirrored the shift in occupancy following MYC (Figure 5F).
Combined, these results unambiguously demonstrate a central
role for m6
A in balancing SF3B1 translation initiation during onco-
genic stress.
m6
A is a prevalent mRNA modification in eukaryotes and is
dynamically controlled by the coordinated action of m6
A writer
and eraser complexes, containing the methyltransferase
METTL3 and the demethylases, ALKBH5 and FTO.48
To delve
deeper into the molecular mechanisms governing SF3B1 50
UTR
methylation dynamics, we employed an m6
A-null MS2 reporter
system to immunoprecipitate the SF3B1 50
UTR WT and
A88GMUT
and directly examined the binding of METTL3,
ALKBH5, and FTO at the steady state and upon MYC (Figure 6A).
This unbiased approach delineated MYC-driven selective interac-
tions between the m6
A eraser ALKBH5 and SF3B1 50
UTR, with no
significant differences noticeable for the binding of other m6
A ma-
chinery components METTL3 and FTO (Figure 6B). This is consis-
tent with the analysis of published datasets illustrating that
ALKBH5 downregulation inversely correlated with m6
A methyl-
ation levels near the 50
end of the SF3B1 transcript (Figure S6A).49
Accordingly, the A88G substitution impaired ALKBH5 binding to
SF3B1 50
UTR upon MYC (Figure 6B), which is consistent with
the previous findings that ALKBH5 preferentially binds the CDS
near the main start codon modulating non-canonical TIS selection
upon stress.45
Extensive analysis of the m6
A88 levels by single-
base elongation- and ligation-based qPCR amplification
(SELECT) along with SF3B1 mRNA polysomal association and
ll
OPEN ACCESS
Article
Molecular Cell 83, 1–15, April 6, 2023 7
Please cite this article in press as: Cie
sla et al., m6
A-driven SF3B1 translation control steers splicing to direct genome integrity and leukemogenesis,
Molecular Cell (2023), https://doi.org/10.1016/j.molcel.2023.02.024
9. protein expression following MYC activation, compellingly
demonstrated that KD of ALKBH5, but not METTL3 and FTO,
entirely inhibited MYC-induced SF3B1 translation upregulation
without affecting its transcript abundance (Figures 6C–6E, S6B,
and S6C). To definitely demonstrate the importance of m6
A88
for SF3B1 translation control, we leveraged a programmable
ALKBH5 guided by the catalytic dead Cas9 (ALKBH5-dCas9) to
achieve m6
A88 site-specific demethylation within the endoge-
nous SF3B1 50
UTR.50
We initially validated ALKBH5-dCas9 spec-
ificity targeting a highly methylated site in Malat1 (Figure S6D),
which was consistent with previous studies.50
As expected, trans-
duction of the ALKBH5-dCas9 together with SF3B1-specific
guide RNA (gRNA) and an antisense oligonucleotide providing
the protospacer adjacent motif (PAMer), faithfully recapitulated
SF3B1 protein upregulation observed upon MYC hyperactivation,
in the absence of mRNA changes (Figures 6F–6I and S6E).
Loss of m6
A-mediated SF3B1 translation repression
limits leukemic growth inducing differentiation and
increasing genome stability following genotoxic stress
To investigate the biological implications of the m6
A88-based
SF3B1 regulatory circuit in human leukemia cells, we used the
CRISPR-Cas9-guided mutagenesis with a repair template (Fig-
ure 7A). We introduced the A88G substitution within the non-
mutated endogenous SF3B1 locus of MDS-derived secondary
AML (sAML) cells, MOLM-13, which are exquisitely sensitive to
splicing and m6
A modulation.51,52
Analyses of A88G-edited cell
populations revealed a robust upregulation of SF3B1 translation
accompanied by an increase in myeloid differentiation with
concomitant growth reductions independent from changes in
transcription and survival (Figures 7B–7D and S7A–S7C). Accord-
ingly, SF3B1 50
UTR A88GMUT
cells exhibited a clonogenic defect
upon serial replating in colony-forming unit (CFU) assays, which
was not simply caused by a progressive loss of edited clones
(Figures 7E, S7D, and S7E). Similar clonogenic changes were
recapitulated by ALKBH5-targeted m6
A88 demethylation in
isogenic MOLM-13 cells, validating mechanistic evidence that
SF3B1 translations contribute to phenotype alterations in
A88GMUT
cells (Figure S7F). Next, we asked whether m6
A-depen-
dent SF3B1 regulation impacts leukemogenesis in vivo and
transplanted SF3B1 50
UTR WT and A88GMUT
MOLM-13 cells
into sub-lethally irradiated immunodeficient mice. Notably,
m6
A88-deficient cells exhibited a slight but significant delay in
leukemia development associated with a substantial reduction
Figure 5. m6
A-based circuit controls SF3B1 50
UTR alternative translation initiation choice during oncogenic stress
(A and B) UCSC genome browser tracks depicting evolutionary conservation within the genomic region corresponding to the SF3B1 50
UTR (A). Schematic
highlights the conserved uORFs and RRACH motif (B).
(C) m6
A-RIP-seq analysis from Dominissini et al.44
indicates a prominent m6
A peak in the region corresponding to the predicted RRACH motif within SF3B1 50
UTR.
(D) Schematic depicts the monocistronic translational reporter employed to measure the activity of the 50
UTR SF3B1 in primary fibroblasts following MYC
expression (24 h). Graph shows fold change (FC) mean FLuc activity normalized to the FLuc RNA expression ± SD, n = 3–6. **p 0.01, *p 0.05 (one-way ANOVA).
(E) m6
A-RIP-qPCR analysis of 50
UTR WT and A88GMUT
SF3B1 50
UTR reporters. Left, schematic shows experimental setup employed to determine SF3B1 50
UTR m6
A88 levels. Right, graph shows mean SF3B1 50
UTR Fluc ‘‘m6
A-low’’ mRNA reporter47
± SD in CTRL and MYC-overexpressing HDF, n = 3–6. **p 0.01,
*p 0.05 (one-way ANOVA).
(F) Schematic shows toeprinting assay used to assess ribosome occupancy at main (AUG) and alternative (UUG, UGU) TISs. mRNA composed of full-length
human SF3B1 50
UTR linked with FLuc was employed as the toeprint assay template. Left, representative autoradiogram of the complementary DNA products
from the toeprint assay using cytoplasmic lysate from CTRL and MYC-overexpressing HDF. Bands corresponding to ribosome pausing at the upstream UUG,
GUG, and main AUG are indicated. Right, toeprinting assay with rabbit reticulocyte lysates (RRLs) and SF3B1 50
UTR WT/A88GMUT
linked with Fluc serving as a
template. Representative autoradiogram showing different ORFs selection in WT and A88GMUT
reporters. Graph shows average ribosome occupancy at different
ORFs ± SD in HDF transfected with SF3B1 50
UTR WT and A88GMUT
luciferase reporters, n = 3. **p 0.01, *p 0.05 (one-way ANOVA).
See also Figure S5.
ll
OPEN ACCESS Article
8 Molecular Cell 83, 1–15, April 6, 2023
Please cite this article in press as: Cie
sla et al., m6
A-driven SF3B1 translation control steers splicing to direct genome integrity and leukemogenesis,
Molecular Cell (2023), https://doi.org/10.1016/j.molcel.2023.02.024
10. of circulating blasts and, to a lesser extent, human engraftment
(Figure 7F). In line with previous observations, splicing analysis
in SF3B1 50
UTR A88GMUT
MOLM-13 cells uncovered a
conserved sensitivity of mRNAs enriched for components of
DDR machinery to SF3B1 protein levels (Figures 7G, 7H, S7G,
and S7H; Tables S7 and S8). Pathway analysis of transcriptional
profiles in A88GMUT
cells was consistent with gene expression
in hematopoietic lineages, cytokine signaling, leukocyte migra-
tion, and p53, distinct from steroid unsaturated fatty acid biosyn-
thesis, TGF-b, and AML observed in controls (Figure S7I). To
establish whether changes in SF3B1 levels and gene expression
patterns in the A88GMUT
cells impacted the sensitivity to geno-
toxic stress, we examined DNA damage and viability following
topoisomerase II poisoning by etoposide treatment, a clinically
used chemotherapeutic agent in AML.53
Strikingly, we found
that SF3B1 50
UTR mutant cells were significantly more resistant
to etoposide-induced cell death (Figure 7I) and displayed a reduc-
tion in DNA damage and p53 accumulation compared with con-
trols (Figures 7J and 7K). Collectively, these results highlight the
importance of SF3B1 translation control for DNA repair and the
growth of leukemic cells.
DISCUSSION
This study unveils an epitranscriptomic-driven translation control
nexus centered on SF3B1 that selectively orchestrates splicing
of DDR components to counteract genomic instability and malig-
nant transformation. Our results highlight SF3B1 translation as a
dynamic and evolutionarily conserved means to direct splicing-
dependent genomic integrity with important implications
for cell fitness during leukemia development in mice and hu-
mans. Critically, we delineate that a 50
UTR m6
A modification le-
verages SF3B1 expression, dictating translation initiation at
inhibitory uORFs upon oncogenic stress, which involves
ALKBH5-mediated binding and demethylation. Our findings
that dysregulation of this m6
A/SF3B1 molecular axis fuels
genomic instability and leukemogenesis in vivo delineate an
unanticipated role for SF3B1 translation control in tumorigenesis
distinct from the disease-associated properties of SF3B1 muta-
tions9,26,54
(Figure 7L).
Accumulating evidence indicates that SF abundance is tightly
controlled post-transcriptionally following oncogenic stress,
underscoring the importance of translation control for fine-tuning
Figure 6. ALKBH5 demethylates m6
A88 modulating SF3B1 translation rates upon oncogenic stress
(A and B) m6
A88 modulates ALKBH5 binding to the SF3B1 5ʹ UTR in MYC-expressing HDF. Schematic shows the MS2 stem-loops/MS2 coat protein (MCP)
system employed to assess the binding of METTL3, FTO, and ALKBH5 to the SF3B1 5ʹ UTR WT and A88GMUT
constructs (A). Protein analysis of ALKBH5, FTO,
and METTL3 in MS2 pulldown (B). Graph shows quantification of mean ALKBH5 association with SF3B1 5ʹ UTR WT and A88GMUT
in HDF ± MYC ± SD, n = 4 (B).
**p 0.01 (one-way ANOVA).
(C) SELECT of SF3B1 5ʹ UTR m6
A88 levels. Graph shows relative m6
A-to-A ratio in CTRL, MYC, and MYC + siALKBH5 HDF ± SD, n = 3. **p 0.01 (one-
way ANOVA).
(D) Polysomal analysis of SF3B1 mRNA in HDF undergoing MYC-induced oncogenic stress (24 h) in response to ALKBH5 knockdown (KD). The polysome profile
(gray shade) indicates the relative absorbance at 254 nm. Graph shows mean SF3B1 mRNA abundance in each polysomal fraction ± SD, n = 3 in CTRL, MYC, and
MYC + ALKBH5-KD fibroblasts.
(E) SF3B1 protein analysis in CTRL, MYC, and MYC + siALKBH5 cells. Graphs show quantification of SF3B1 protein and mRNA levels ± SD, n = 4–7. **p 0.01
(one-way ANOVA).
(F) Schematic shows programmable ALKBH5-dCas9 fusion protein for regulated m6
A88 demethylation within the SF3B1 5ʹ UTR.
(G) Graph shows relative m6
A-to-A ratio in HEK293T cells co-transduced with ALKBH5-dCas9, sgRNA ± PAMer oligonucleotide ± SD, n = 3. *p 0.05 (t test).
(H and I) Representative SF3B1 protein analysis in HEK293T following ALKBH5-dCas9 targeted demethylation of m6
A88. Graph shows mean SF3B1 protein
(H) and mRNA (I) levels ± SD, n = 3. NS, non-statistically significant, and ***p 0.001 (t test).
See also Figure S6.
ll
OPEN ACCESS
Article
Molecular Cell 83, 1–15, April 6, 2023 9
Please cite this article in press as: Cie
sla et al., m6
A-driven SF3B1 translation control steers splicing to direct genome integrity and leukemogenesis,
Molecular Cell (2023), https://doi.org/10.1016/j.molcel.2023.02.024
11. Figure 7. Loss of m6
A-mediated SF3B1 translation control limits leukemic growth, inducing differentiation and increasing genome stability
following genotoxic stress
(A) CRISPR-Cas9 editing with repair template to introduce A88G substitution in the SF3B1 50
UTR of MDS-derived leukemic MOLM-13 cells. Sanger sequencing
illustrates accurate A88G editing.
(B) Left, May-Gr€
unwald-Giemsa staining of SF3B1 50
UTR WT and A88GMUT
MOLM-13 cells. Right, protein analysis and graph showing quantification ± SD, n = 4
of mRNA levels illustrate increased SF3B1 protein, but not mRNA levels in 50
UTR A88GMUT
MOLM-13 cells.
(C) Representative FACS analysis shows CD14 expression in SF3B1 50
UTR WT and A88GMUT
MOLM-13 ± SD, n = 4. *p 0.05 (t test). Graph shows mean
percentage of CD33high
CD11bhigh
MOLM-13 cells ± SD, n = 4. ***p 0.001 (t test).
(D) Graph shows cell number at indicated time points ± SD, n = 4. ***p 0.001, **p 0.01, *p 0.05 (one-way ANOVA).
(E) Serial replating of SF3B1 50
UTR WT and A88GMUT
MOLM-13 cells. Graph shows the number of colonies following each replating ± SD, n = 3. ****p 0.0001,
***p 0.001 (one-way ANOVA). Representative images of methylcellulose plates show decreased clonogenic capacity of 50
UTR SF3B1 A88GMUT
cells.
(F) Loss of SF3B1 50
UTR m6
A88 delays leukemogenesis in vivo. Leukemia-free survival of sub-lethally irradiated NSG mice translated with 500.000 MOLM-13
cells harboring SF3B1 50
UTR WT and A88GMUT
, respectively, n = 10 per group. p = 0.0282 (Mantel-Cox test). Graphs show decreased leukemic burden with
lower MOLM-13-derived human CD45 chimerism in the A88GMUT
group. ***p 0.001, *p 0.05 (t test).
(G) Waterfall plots show change in percent spliced-in (DPSI) for individual type of splicing events between WT and A88GMUT
MOLM-13 cells.
(H) Gene ontology (GO) analysis of 854 significantly altered AS transcripts in A88GMUT
MOLM-13 cells.
(I) Graph shows mean cell death of WT and A88GMUT
MOLM-13 cells ± SD in a dose-response to etoposide (24 h), n = 4. Inset depicts half-maximal effective
concentration (EC50) ± SD, n = 4. *p 0.05 (t test).
(J) Representative SF3B1 and p53 protein analysis in WT and A88GMUT
MOLM-13 at the steady state and after treatment with 50 nM etoposide (4 h).
(K) Graph shows olive tail moment from WT and A88GMUT
MOLM-13 cells at steady state and after treatment with 50 nM etoposide (etopo) (4 h). ****p 0.0001,
*p 0.05 (one-way ANOVA).
(L) Working model. ALKBH5-mediated demethylation of m6
A88 directs SF3B1 translation following oncogenic stress (e.g., MYC). SF3B1 upregulation enables
unique splicing programs that ensure accurate expression of DDR and epigenetic regulators. This SF3B1-driven molecular circuit may counteract genome
instability during the earliest and most critical steps of MDS transformation to overt leukemia.
See also Figure S7 and Tables S7 and S8.
ll
OPEN ACCESS Article
10 Molecular Cell 83, 1–15, April 6, 2023
Please cite this article in press as: Cie
sla et al., m6
A-driven SF3B1 translation control steers splicing to direct genome integrity and leukemogenesis,
Molecular Cell (2023), https://doi.org/10.1016/j.molcel.2023.02.024
12. core spliceosomal sub-modules and their distinct splicing regu-
latory potential.5,55
These included central components of the
SF3 complex, such as SF3B1 and SF3A3, frequently altered in
cancer. However, an outstanding question is how translation
plasticity is molecularly achieved to hijack splicing and promote
tumorigenesis. For example, we recently identified that a
conserved RNA stem-loop (SL) controls SF3A3 mRNA transla-
tion upon MYC hyperactivation in breast cancer cells,5
consis-
tent with translation specificity driven by 50
UTR-embedded
RNA structures upon oncogenic stress.43
Interestingly, previous
studies reported widespread differences in 50
UTR TIS selection
in MYC-expressing cancer cells.56
Our findings define additional
translation regulatory layers and unravel an epitranscriptomic-
based mechanism that converges on a 50
UTR m6
A site to steer
SF3B1 protein levels during leukemogenesis. Importantly, we
highlight a specific dependency for the RNA demethylase
ALKBH5, supporting evidence that alternative translation initia-
tion events at inhibitory uORFs are modulated by 50
UTR m6
A
levels during stress conditions45
and contribute to tumorigen-
esis.46,57
These observations may be relevant in the context of
m6
A regulating the stability and translation of mRNAs involved
in acquiring stem cell properties that support leukemic stem
cell self-renewal.58
It is plausible that aberrant m6
A88 levels
may hamper SF3B1 accumulation below a critical threshold,
leading to distinct cancer-promoting splicing alterations within
pre-leukemic MDS-initiating HSCs. Several components of
the m6
A machinery, including METTL3, ALKBH5, FTO, and
YTHDF2, are commonly dysregulated in leukemia.49,52,58,59
Spe-
cifically, ALKBH5 overexpression in AML was shown to impact
leukemic stem cell self-renewal and differentiation by affecting
the stability of specific mRNAs such as TACC3 and AXL.49,60
By extension, our results suggest that ALKBH5 may delay HSC
leukemic transformation in MDS, at least in part, enhancing
SF3B1 translation and splicing fidelity in the absence of SF mu-
tations. Still, the effects on DDR-related splicing programs could
promote the selection of chemo-resistant malignant leukemic
clones and, possibly, contribute to leukemia relapse. As such,
future work will be required to determine how cancer-associated
epitranscriptomic perturbations impact spliceosome composi-
tion and function, contributing to leukemogenesis and the
ensuing therapeutic implications.
Genomic instability is a central cancer hallmark often associ-
ated with oncogene-induced DNA damage,36
which is mainly
uncoupled from loss-of-function mutations in DNA repair genes
but instead results from replication stress at the early stages of
transformation.32
Nevertheless, the post-transcriptional mecha-
nisms contributing to DNA damage during the initial steps of
cancer development remain incompletely understood. Our
work illuminates a hitherto unanticipated translational program
centered on SF3B1 that impacts genomic integrity through se-
lective splicing of multiple DDR and chromatin remodeling com-
ponents following oncogenic stress. Notably, previous studies
indicate that SFs may directly impact the DNA repair process
and that splicing dysfunctions increase DNA-RNA hybrids and
R-loops formation, particularly with SF mutations common in
MDS, including SF3B1.34,35,61–63
However, whether dysregula-
tion of non-mutated SF3B1 actively contributes to genome insta-
bility and leukemogenesis in MDS was not previously assessed.
Findings that SF3B1 mutations are heterozygous and mutually
exclusive for other SF mutations suggest a remarkable depen-
dency on the WT allele for survival and non-redundant effects
on splicing in cancer cells.5,13,64
Our data further illustrate that
SF3B1 translation control undergoes dynamic regulation during
leukemic transformation and provides important mechanistic ev-
idence for how perturbation of core spliceosome components
critically contributes to MDS etiology in the absence of direct ge-
netic alterations. Furthermore, this may shift the paradigm for the
post-transcriptional programs that dictate clonal selection dur-
ing MDS progression. Indeed, a model of non-linear clonal evo-
lution of MDS-initiating stem cells has been recently proposed,
with the hierarchical acquisition of mutations driving transforma-
tion to AML.65
Our integrative analysis of the human MDS/AML
gene expression dataset suggests that low SF3B1 levels may
provide a source of genomic instability, favoring the acquisition
of multiple mutations with a drift for selecting high-risk aggres-
sive MDS HSC clones. Likewise, it is tempting to speculate
that impairment of SF3B1 translation may contribute, at least
in part, to the different clinical outcomes in MDS and CLL with
SF3B1 mutations.11,66
In sum, our work unveils a translation-
driven oncogenic nexus centered on the core splice factor
SF3B1 that critically impacts genome integrity and leukemogen-
esis in human MDS.
Limitations of the study
This study highlights 50
UTR site-specific methylation as a prom-
inent mechanism to steer translation and control non-mutated
SF3B1 protein abundance during oncogenic stress in vitro and
in vivo. Although we find that ALKBH5-mediated demethylation
of A88 within SF3B1 50
UTR is required for increasing translation
initiation rates upon MYC hyperactivation, we could not deter-
mine the exact modification stoichiometry at this position. Addi-
tional research using quantitative methods with single-base res-
olution will be needed to establish m6
A88 stoichiometry within
the SF3B1 mRNA pool of normal and malignant cells.67–70
Our
work shows that m6
A88 demethylation is critically needed for
SF3B1 cap-dependent translation upon MYC hyperactivation.
This is consistent with recent evidence that m6
A near TIS in-
duces ribosome pausing modulating translation upon oncogenic
stress.71
Nonetheless, future studies will be required to molecu-
larly dissect how m6
A88 repressive function impact SF3B1
translation initiation during transformation and determine
whether additional m6
A-independent mechanisms modulate
the SF3B1 levels and function in cancer cells. Given that m6
A
levels are dynamic across different HSPC populations,72
further
analysis will be necessary to resolve clonal RNA methylation pat-
terns directing SF3B1 expression and splicing programs during
leukemogenesis upon dysregulation of the m6
A epitranscrip-
tomic machinery.73
STAR+METHODS
Detailed methods are provided in the online version of this paper
and include the following:
d KEY RESOURCES TABLE
d RESOURCE AVAILABILITY
ll
OPEN ACCESS
Article
Molecular Cell 83, 1–15, April 6, 2023 11
Please cite this article in press as: Cie
sla et al., m6
A-driven SF3B1 translation control steers splicing to direct genome integrity and leukemogenesis,
Molecular Cell (2023), https://doi.org/10.1016/j.molcel.2023.02.024
13. B Lead Contact
B Materials availability
B Data and code availability
d EXPERIMENTAL MODEL AND SUBJECT DETAILS
B Patients and samples
B Mouse strains
B Cell culture
d METHOD DETAILS
B Transplantation of MDS HSCs
B Xenotransplantation
B FACS sorting and intra-cellular (ic) Flow analysis
B Polysome fractionation
B SELECT for detection of m6
A
B Site-specific demethylation by ALKBH5-dCas9
B U2 snRNP pulldown
B Western blotting
B Colony forming unit (CFU) assay
B Morphological analysis
B SF3B1 5’UTR RNA pulldown
B Apoptosis Analysis
B RNA-sequencing
B Comet Assay
B Immunofluorescence analysis of g-H2A.X accumu-
lation
B 5’ RNA Ligation Mediated Rapid Amplification of cDNA
Ends (5’RLM RACE)
B Toeprinting Assay
B m6
A-RIP-qPCR
B siRNA and shRNA gene knockdown
B CRISPR/Cas9-mediated SF3B1 5’UTR editing
B Proliferation assay
B Isoform-specific reverse transcription PCR
B Luciferase assay
B Targeted DMS probing of SF3B1 5’UTR
d QUANTIFICATION AND STATISTICAL ANALYSIS
B Gene Ontology and Gene Set Enrichment Analysis
B RNA-seq and splicing analysis
B SF3B1 gene set signature analysis
B Analysis of DMS probing data
SUPPLEMENTAL INFORMATION
Supplemental information can be found online at https://doi.org/10.1016/j.
molcel.2023.02.024.
ACKNOWLEDGMENTS
We thank all the members of the Bellodi laboratory for helpful comments and
A. Hsieh for critical reading. We thank the Lund University Bioimaging Center,
Lund Stem Cell Center FACS, Imaging, and Vector core facilities, and the Pro-
teomics Core Facility of IMol PAS for technical support. We are indebted to D.
Bryder and A. Doyle for their advice on transplantation studies, S. Horner for
the generous ‘‘m6
A-low’’ reporter gift, F. Aguilo, Y. Xu, and D. Ruggero for
sharing protocols. We are grateful to patients, clinicians, and hospital staff
participating in the MDS studies for their contribution. This work was sup-
ported by Swedish Foundations’ Starting Grant (SFSG) (C.B.), StemTherapy
(C.B.), Swedish Research Council (Vetenskapsrådet) (C.B. and E.H.-L.), Swed-
ish Cancer Society (Cancerfonden) (C.B. and E.H.-L.), Foundation for Polish
Science (FNP) and National Science Center in Poland (NCN) (M.C.), Knut
and Alice Wallenberg Foundation (E.H.-L.), Stockholm Cancer Society
(E.H.-L.), and Dr. Åke Olsson Foundation for Hematological Research (M.D.).
C.B. is a Ragnar Söderberg Fellow in Medicine and Cancerfonden Young
Investigator. M.C. and S.M. are Cancerfonden Postdoctoral Fellows.
AUTHOR CONTRIBUTIONS
Conceptualization, C.B. and M.C.; methodology, M.C., S.M., M.M., D.I., and
C.B.; investigation, M.C., S.M., M.M., H.F., and D.I.; resources, E.H.-L.,
M.D.; software, P.C.T.N. and D.I.; formal analysis, P.C.T.N., M.C., S.M.,
G.T., D.I., M.D., E.H.-L., and C.B.; data curation, P.C.T.N. and G.T.; writing –
original draft, C.B. and M.C.; writing – review editing, C.B., and M.C.; super-
vision, C.B.; project administration, C.B.; funding acquisition, C.B.
DECLARATION OF INTERESTS
C.B. and S.M. are founders and members of the scientific advisory board of
SACRA Therapeutics.
Received: April 6, 2022
Revised: January 7, 2023
Accepted: February 20, 2023
Published: March 20, 2023
REFERENCES
1. Kalsotra, A., and Cooper, T.A. (2011). Functional consequences of devel-
opmentally regulated alternative splicing. Nat. Rev. Genet. 12, 715–729.
https://doi.org/10.1038/nrg3052.
2. Will, C.L., and L€
uhrmann, R. (2011). Spliceosome structure and function.
Cold Spring Harb. Perspect. Biol. 3, a003707. https://doi.org/10.1101/
cshperspect.a003707.
3. Chen, S., Benbarche, S., and Abdel-Wahab, O. (2021). Splicing factor mu-
tations in hematologic malignancies. Blood 138, 599–612. https://doi.org/
10.1182/blood.2019004260.
4. Dvinge, H., and Bradley, R.K. (2015). Widespread intron retention diver-
sifies most cancer transcriptomes. Genome Med. 7, 45. https://doi.org/
10.1186/s13073-015-0168-9.
5. Cie
sla, M., Ngoc, P.C.T., Cordero, E., Martinez, Á.S., Morsing, M.,
Muthukumar, S., Beneventi, G., Madej, M., Munita, R., Jönsson, T.,
et al. (2021). Oncogenic translation directs spliceosome dynamics
revealing an integral role for SF3A3 in breast cancer. Mol. Cell 81. 1453–
1468.e12. https://doi.org/10.1016/j.molcel.2021.01.034.
6. Kr€
amer, A. (1996). The structure and function of proteins involved in
mammalian pre-mRNA splicing. Annu. Rev. Biochem. 65, 367–409.
https://doi.org/10.1146/annurev.bi.65.070196.002055.
7. Gozani, O., Potashkin, J., and Reed, R. (1998). A potential role for U2AF-
SAP 155 interactions in recruiting U2 snRNP to the branch site. Mol. Cell.
Biol. 18, 4752–4760. https://doi.org/10.1128/MCB.18.8.4752.
8. Wahl, M.C., Will, C.L., and L€
uhrmann, R. (2009). The spliceosome: design
principles of a dynamic RNP machine. Cell 136, 701–718. https://doi.org/
10.1016/j.cell.2009.02.009.
9. Darman, R.B., Seiler, M., Agrawal, A.A., Lim, K.H., Peng, S., Aird, D.,
Bailey, S.L., Bhavsar, E.B., Chan, B., Colla, S., et al. (2015). Cancer-asso-
ciated SF3B1 hotspot mutations induce cryptic 30
splice site selection
through use of a different branch point. Cell Rep. 13, 1033–1045.
https://doi.org/10.1016/j.celrep.2015.09.053.
10. Papaemmanuil, E., Cazzola, M., Boultwood, J., Malcovati, L., Vyas, P.,
Bowen, D., Pellagatti, A., Wainscoat, J.S., Hellstrom-Lindberg, E.,
Gambacorti-Passerini, C., et al. (2011). Somatic SF3B1 mutation in mye-
lodysplasia with ring sideroblasts. N. Engl. J. Med. 365, 1384–1395.
https://doi.org/10.1056/NEJMoa1103283.
11. Wan, Y., and Wu, C.J. (2013). SF3B1 mutations in chronic lymphocytic leu-
kemia. Blood 121, 4627–4634. https://doi.org/10.1182/blood-2013-02-
427641.
ll
OPEN ACCESS Article
12 Molecular Cell 83, 1–15, April 6, 2023
Please cite this article in press as: Cie
sla et al., m6
A-driven SF3B1 translation control steers splicing to direct genome integrity and leukemogenesis,
Molecular Cell (2023), https://doi.org/10.1016/j.molcel.2023.02.024
14. 12. Yoshida, K., and Ogawa, S. (2014). Splicing factor mutations and cancer.
Wiley Interdiscip. Rev. RNA 5, 445–459. https://doi.org/10.1002/
wrna.1222.
13. Lee, S.C., North, K., Kim, E., Jang, E., Obeng, E., Lu, S.X., Liu, B.,
Inoue, D., Yoshimi, A., Ki, M., et al. (2018). Synthetic lethal and
convergent biological effects of cancer-associated spliceosomal gene
mutations. Cancer Cell 34. 225–241.e8. https://doi.org/10.1016/j.ccell.
2018.07.003.
14. Paolella, B.R., Gibson, W.J., Urbanski, L.M., Alberta, J.A., Zack, T.I.,
Bandopadhayay, P., Nichols, C.A., Agarwalla, P.K., Brown, M.S.,
Lamothe, R., et al. (2017). Copy-number and gene dependency analysis
reveals partial copy loss of wild-type SF3B1 as a novel cancer vulnera-
bility. eLife 6, e23268. https://doi.org/10.7554/eLife.23268.
15. Lin, Y.W., Slape, C., Zhang, Z., and Aplan, P.D. (2005). NUP98-HOXD13
transgenic mice develop a highly penetrant, severe myelodysplastic syn-
drome that progresses to acute leukemia. Blood 106, 287–295. https://
doi.org/10.1182/blood-2004-12-4794.
16. Pang, W.W., Pluvinage, J.V., Price, E.A., Sridhar, K., Arber, D.A.,
Greenberg, P.L., Schrier, S.L., Park, C.Y., and Weissman, I.L. (2013).
Hematopoietic stem cell and progenitor cell mechanisms in myelodys-
plastic syndromes. Proc. Natl. Acad. Sci. USA 110, 3011–3016. https://
doi.org/10.1073/pnas.1222861110.
17. Chung, Y.J., Choi, C.W., Slape, C., Fry, T., and Aplan, P.D. (2008).
Transplantation of a myelodysplastic syndrome by a long-term repopulat-
ing hematopoietic cell. Proc. Natl. Acad. Sci. USA 105, 14088–14093.
https://doi.org/10.1073/pnas.0804507105.
18. Guzzi, N., Cie
sla, M., Ngoc, P.C.T., Lang, S., Arora, S., Dimitriou, M.,
Pimková, K., Sommarin, M.N.E., Munita, R., Lubas, M., et al. (2018).
Pseudouridylation of tRNA-derived fragments steers translational control
in stem cells. Cell 173. 1204–1216.e26. https://doi.org/10.1016/j.cell.
2018.03.008.
19. Guzzi, N., Muthukumar, S., Cie
sla, M., Todisco, G., Ngoc, P.C.T., Madej,
M., Munita, R., Fazio, S., Ekström, S., Mortera-Blanco, T., et al. (2022).
Pseudouridine-modified tRNA fragments repress aberrant protein synthe-
sis and predict leukaemic progression in myelodysplastic syndrome. Nat.
Cell Biol. 24, 299–306. https://doi.org/10.1038/s41556-022-00852-9.
20. Stevens, B.M., Khan, N., D’Alessandro, A., Nemkov, T., Winters, A., Jones,
C.L., Zhang, W., Pollyea, D.A., and Jordan, C.T. (2018). Characterization
and targeting of malignant stem cells in patients with advanced myelodys-
plastic syndromes. Nat. Commun. 9, 3694. https://doi.org/10.1038/
s41467-018-05984-x.
21. Gajzer, D., Logothetis, C.N., Sallman, D.A., Calon, G., Babu, A., Chan, O.,
Vincelette, N.D., Volpe, V.O., Al Ali, N.H., Basra, P., et al. (2021). MYC over-
expression is associated with an early disease progression from MDS to
AML. Leuk. Res. 111, 106733. https://doi.org/10.1016/j.leukres.2021.
106733.
22. Land, H., Chen, A.C., Morgenstern, J.P., Parada, L.F., and Weinberg, R.A.
(1986). Behavior of myc and ras oncogenes in transformation of rat embryo
fibroblasts. Mol. Cell. Biol. 6, 1917–1925. https://doi.org/10.1128/mcb.6.
6.1917-1925.1986.
23. Hsieh, A.C., Costa, M., Zollo, O., Davis, C., Feldman, M.E., Testa, J.R.,
Meyuhas, O., Shokat, K.M., and Ruggero, D. (2010). Genetic dissection
of the oncogenic mTOR pathway reveals druggable addiction to transla-
tional control via 4EBP-eIF4E. Cancer Cell 17, 249–261. https://doi.org/
10.1016/j.ccr.2010.01.021.
24. Pourdehnad, M., Truitt, M.L., Siddiqi, I.N., Ducker, G.S., Shokat, K.M., and
Ruggero, D. (2013). Myc and mTOR converge on a common node in pro-
tein synthesis control that confers synthetic lethality in Myc-driven can-
cers. Proc. Natl. Acad. Sci. USA 110, 11988–11993. https://doi.org/10.
1073/pnas.1310230110.
25. Shen, S., Park, J.W., Lu, Z.X., Lin, L., Henry, M.D., Wu, Y.N., Zhou, Q., and
Xing, Y. (2014). rMATS: robust and flexible detection of differential alterna-
tive splicing from replicate RNA-Seq data. Proc. Natl. Acad. Sci. USA 111,
E5593–E5601. https://doi.org/10.1073/pnas.1419161111.
26. Pellagatti, A., Armstrong, R.N., Steeples, V., Sharma, E., Repapi, E., Singh,
S., Sanchi, A., Radujkovic, A., Horn, P., Dolatshad, H., et al. (2018). Impact
of spliceosome mutations on RNA splicing in myelodysplasia: dysregu-
lated genes/pathways and clinical associations. Blood 132, 1225–1240.
https://doi.org/10.1182/blood-2018-04-843771.
27. Obeng, E.A., Chappell, R.J., Seiler, M., Chen, M.C., Campagna, D.R.,
Schmidt, P.J., Schneider, R.K., Lord, A.M., Wang, L., Gambe, R.G.,
et al. (2016). Physiologic expression of Sf3b1(K700E) causes impaired
erythropoiesis, aberrant splicing, and sensitivity to therapeutic spliceo-
some modulation. Cancer Cell 30, 404–417. https://doi.org/10.1016/j.
ccell.2016.08.006.
28. Wu, G., Fan, L., Edmonson, M.N., Shaw, T., Boggs, K., Easton, J., Rusch,
M.C., Webb, T.R., Zhang, J., and Potter, P.M. (2018). Inhibition of SF3B1
by molecules targeting the spliceosome results in massive aberrant exon
skipping. RNA 24, 1056–1066. https://doi.org/10.1261/rna.065383.117.
29. ENCODE Project Consortium (2012). An integrated encyclopedia of DNA
elements in the human genome. Nature 489, 57–74. https://doi.org/10.
1038/nature11247.
30. Sashida, G., Harada, H., Matsui, H., Oshima, M., Yui, M., Harada, Y.,
Tanaka, S., Mochizuki-Kashio, M., Wang, C., Saraya, A., et al. (2014).
Ezh2 loss promotes development of myelodysplastic syndrome but atten-
uates its predisposition to leukaemic transformation. Nat. Commun. 5,
4177. https://doi.org/10.1038/ncomms5177.
31. Wu, Z., Lee, S.T., Qiao, Y., Li, Z., Lee, P.L., Lee, Y.J., Jiang, X., Tan, J., Aau,
M., Lim, C.Z., and Yu, Q. (2011). Polycomb protein EZH2 regulates cancer
cell fate decision in response to DNA damage. Cell Death Differ. 18, 1771–
1779. https://doi.org/10.1038/cdd.2011.48.
32. Vafa, O., Wade, M., Kern, S., Beeche, M., Pandita, T.K., Hampton, G.M.,
and Wahl, G.M. (2002). c-Myc can induce DNA damage, increase reactive
oxygen species, and mitigate p53 function: a mechanism for oncogene-
induced genetic instability. Mol. Cell 9, 1031–1044. https://doi.org/10.
1016/s1097-2765(02)00520-8.
33. Pilié, P.G., Tang, C., Mills, G.B., and Yap, T.A. (2019). State-of-the-art stra-
tegies for targeting the DNA damage response in cancer. Nat. Rev. Clin.
Oncol. 16, 81–104. https://doi.org/10.1038/s41571-018-0114-z.
34. Han, C., Khodadadi-Jamayran, A., Lorch, A.H., Jin, Q., Serafin, V., Zhu, P.,
Politanska, Y., Sun, L., Gutierrez-Diaz, B.T., Pryzhkova, M.V., et al. (2022).
SF3B1 homeostasis is critical for survival and therapeutic response in
T cell leukemia. Sci. Adv. 8, eabj8357. https://doi.org/10.1126/sciadv.
abj8357.
35. Lappin, K.M., Barros, E.M., Jhujh, S.S., Irwin, G.W., McMillan, H.,
Liberante, F.G., Latimer, C., La Bonte, M.J., Mills, K.I., Harkin, D.P.,
et al. (2022). Cancer-associated SF3B1 mutations confer a BRCA-like
cellular phenotype and synthetic lethality to PARP inhibitors. Cancer
Res. 82, 819–830. https://doi.org/10.1158/0008-5472.CAN-21-1843.
36. Hanahan, D., and Weinberg, R.A. (2011). Hallmarks of cancer: the next
generation. Cell 144, 646–674. https://doi.org/10.1016/j.cell.2011.02.013.
37. Boehrer, S., Adès, L., Tajeddine, N., Hofmann, W.K., Kriener, S., Bug, G.,
Ottmann, O.G., Ruthardt, M., Galluzzi, L., Fouassier, C., et al. (2009).
Suppression of the DNA damage response in acute myeloid leukemia
versus myelodysplastic syndrome. Oncogene 28, 2205–2218. https://
doi.org/10.1038/onc.2009.69.
38. Takagi, M. (2017). DNA damage response and hematological malignancy.
Int. J. Hematol. 106, 345–356. https://doi.org/10.1007/s12185-017-
2226-0.
39. Esposito, M.T., and So, C.W. (2014). DNA damage accumulation and
repair defects in acute myeloid leukemia: implications for pathogenesis,
disease progression, and chemotherapy resistance. Chromosoma 123,
545–561. https://doi.org/10.1007/s00412-014-0482-9.
40. Mills, K.I., Kohlmann, A., Williams, P.M., Wieczorek, L., Liu, W.M., Li, R.,
Wei, W., Bowen, D.T., Loeffler, H., Hernandez, J.M., et al. (2009).
Microarray-based classifiers and prognosis models identify subgroups
with distinct clinical outcomes and high risk of AML transformation of
ll
OPEN ACCESS
Article
Molecular Cell 83, 1–15, April 6, 2023 13
Please cite this article in press as: Cie
sla et al., m6
A-driven SF3B1 translation control steers splicing to direct genome integrity and leukemogenesis,
Molecular Cell (2023), https://doi.org/10.1016/j.molcel.2023.02.024
15. myelodysplastic syndrome. Blood 114, 1063–1072. https://doi.org/10.
1182/blood-2008-10-187203.
41. Cancer Genome Atlas Research Network, Weinstein, J.N., Collisson,
E.A., Mills, G.B., Shaw, K.R., Ozenberger, B.A., Ellrott, K., Shmulevich,
I., Sander, C., and Stuart, J.M. (2013). The Cancer Genome Atlas
Pan-Cancer analysis project. Nat. Genet. 45, 1113–1120. https://doi.
org/10.1038/ng.2764.
42. Robichaud, N., Sonenberg, N., Ruggero, D., and Schneider, R.J. (2019).
Translational control in cancer. Cold Spring Harb. Perspect. Biol. 11.
https://doi.org/10.1101/cshperspect.a032896.
43. Schuster, S.L., and Hsieh, A.C. (2019). The untranslated regions of mRNAs
in cancer. Trends Cancer 5, 245–262. https://doi.org/10.1016/j.trecan.
2019.02.011.
44. Dominissini, D., Moshitch-Moshkovitz, S., Schwartz, S., Salmon-Divon,
M., Ungar, L., Osenberg, S., Cesarkas, K., Jacob-Hirsch, J., Amariglio,
N., Kupiec, M., et al. (2012). Topology of the human and mouse m6A
RNA methylomes revealed by m6A-seq. Nature 485, 201–206. https://
doi.org/10.1038/nature11112.
45. Zhou, J., Wan, J., Shu, X.E., Mao, Y., Liu, X.M., Yuan, X., Zhang, X., Hess,
M.E., Br€
uning, J.C., and Qian, S.B. (2018). N(6)-methyladenosine guides
mRNA alternative translation during integrated stress response. Mol.
Cell 69, 636–647.e7. https://doi.org/10.1016/j.molcel.2018.01.019.
46. Xu, Y., Poggio, M., Jin, H.Y., Shi, Z., Forester, C.M., Wang, Y., Stumpf,
C.R., Xue, L., Devericks, E., So, L., et al. (2019). Translation control of
the immune checkpoint in cancer and its therapeutic targeting. Nat.
Med. 25, 301–311. https://doi.org/10.1038/s41591-018-0321-2.
47. Gokhale, N.S., McIntyre, A.B.R., Mattocks, M.D., Holley, C.L., Lazear,
H.M., Mason, C.E., and Horner, S.M. (2020). Altered m(6)A modification
of specific cellular transcripts affects Flaviviridae infection. Mol. Cell 77.
542–555.e8. https://doi.org/10.1016/j.molcel.2019.11.007.
48. Zaccara, S., Ries, R.J., and Jaffrey, S.R. (2019). Reading, writing and
erasing mRNA methylation. Nat. Rev. Mol. Cell Biol. 20, 608–624.
https://doi.org/10.1038/s41580-019-0168-5.
49. Shen, C., Sheng, Y., Zhu, A.C., Robinson, S., Jiang, X., Dong, L., Chen, H.,
Su, R., Yin, Z., Li, W., et al. (2020). RNA demethylase ALKBH5 selectively
promotes tumorigenesis and cancer stem cell self-renewal in acute
myeloid leukemia. Cell Stem Cell 27. 64–80.e9. https://doi.org/10.1016/j.
stem.2020.04.009.
50. Liu, X.M., Zhou, J., Mao, Y., Ji, Q., and Qian, S.B. (2019). Programmable
RNA N(6)-methyladenosine editing by CRISPR-Cas9 conjugates. Nat.
Chem. Biol. 15, 865–871. https://doi.org/10.1038/s41589-019-0327-1.
51. Crews, L.A., Balaian, L., Delos Santos, N.P., Leu, H.S., Court, A.C.,
Lazzari, E., Sadarangani, A., Zipeto, M.A., La Clair, J.J., Villa, R., et al.
(2016). RNA splicing modulation selectively impairs leukemia stem cell
maintenance in secondary human AML. Cell Stem Cell 19, 599–612.
https://doi.org/10.1016/j.stem.2016.08.003.
52. Vu, L.P., Pickering, B.F., Cheng, Y., Zaccara, S., Nguyen, D., Minuesa, G.,
Chou, T., Chow, A., Saletore, Y., MacKay, M., et al. (2017). The N(6)-meth-
yladenosine (m(6)A)-forming enzyme METTL3 controls myeloid differenti-
ation of normal hematopoietic and leukemia cells. Nat. Med. 23, 1369–
1376. https://doi.org/10.1038/nm.4416.
53. Ho, A.D., Brado, B., Haas, R., and Hunstein, W. (1991). Etoposide in acute
leukemia. Past experience and future perspectives. Cancer 67 (Suppl 1),
281–284. https://doi.org/10.1002/1097-0142(19910101)67:1+281::aid-
cncr28206713123.0.co;2-h.
54. Shiozawa, Y., Malcovati, L., Gallı̀, A., Sato-Otsubo, A., Kataoka, K., Sato,
Y., Watatani, Y., Suzuki, H., Yoshizato, T., Yoshida, K., et al. (2018).
Aberrant splicing and defective mRNA production induced by somatic
spliceosome mutations in myelodysplasia. Nat. Commun. 9, 3649.
https://doi.org/10.1038/s41467-018-06063-x.
55. Papasaikas, P., Tejedor, J.R., Vigevani, L., and Valcárcel, J. (2015).
Functional splicing network reveals extensive regulatory potential of the
core spliceosomal machinery. Mol. Cell 57, 7–22. https://doi.org/10.
1016/j.molcel.2014.10.030.
56. Singh, K., Lin, J., Zhong, Y., Bur
cul, A., Mohan, P., Jiang, M., Sun, L.,
Yong-Gonzalez, V., Viale, A., Cross, J.R., et al. (2019). c-MYC regulates
mRNA translation efficiency and start-site selection in lymphoma.
J. Exp. Med. 216, 1509–1524. https://doi.org/10.1084/jem.20181726.
57. Sendoel, A., Dunn, J.G., Rodriguez, E.H., Naik, S., Gomez, N.C., Hurwitz,
B., Levorse, J., Dill, B.D., Schramek, D., Molina, H., et al. (2017).
Translation from unconventional 50
start sites drives tumour initiation.
Nature 541, 494–499. https://doi.org/10.1038/nature21036.
58. Paris, J., Morgan, M., Campos, J., Spencer, G.J., Shmakova, A., Ivanova,
I., Mapperley, C., Lawson, H., Wotherspoon, D.A., Sepulveda, C., et al.
(2019). Targeting the RNA m(6)A reader YTHDF2 selectively compromises
cancer stem cells in acute myeloid leukemia. Cell Stem Cell 25. 137–
148.e6. https://doi.org/10.1016/j.stem.2019.03.021.
59. Li, Z., Weng, H., Su, R., Weng, X., Zuo, Z., Li, C., Huang, H., Nachtergaele,
S., Dong, L., Hu, C., et al. (2017). FTO plays an oncogenic role in acute
myeloid leukemia as a N(6)-methyladenosine RNA demethylase. Cancer
Cell 31, 127–141. https://doi.org/10.1016/j.ccell.2016.11.017.
60. Wang, J., Li, Y., Wang, P., Han, G., Zhang, T., Chang, J., Yin, R., Shan, Y.,
Wen, J., Xie, X., et al. (2020). Leukemogenic chromatin alterations promote
AML leukemia stem cells via a KDM4C-ALKBH5-AXL signaling axis. Cell
Stem Cell 27. 81–97.e8. https://doi.org/10.1016/j.stem.2020.04.001.
61. Singh, S., Ahmed, D., Dolatshad, H., Tatwavedi, D., Schulze, U., Sanchi,
A., Ryley, S., Dhir, A., Carpenter, L., Watt, S.M., et al. (2020). SF3B1 mu-
tations induce R-loop accumulation and DNA damage in MDS and leuke-
mia cells with therapeutic implications. Leukemia 34, 2525–2530. https://
doi.org/10.1038/s41375-020-0753-9.
62. Li, X., and Manley, J.L. (2005). Inactivation of the SR protein splicing factor
ASF/SF2 results in genomic instability. Cell 122, 365–378. https://doi.org/
10.1016/j.cell.2005.06.008.
63. Savage, K.I., Gorski, J.J., Barros, E.M., Irwin, G.W., Manti, L., Powell, A.J.,
Pellagatti, A., Lukashchuk, N., McCance, D.J., McCluggage, W.G., et al.
(2014). Identification of a BRCA1-mRNA splicing complex required for effi-
cient DNA repair and maintenance of genomic stability. Mol. Cell 54,
445–459. https://doi.org/10.1016/j.molcel.2014.03.021.
64. Bonnal, S., Vigevani, L., and Valcárcel, J. (2012). The spliceosome as a
target of novel antitumour drugs. Nat. Rev. Drug Discov. 11, 847–859.
https://doi.org/10.1038/nrd3823.
65. Chen, H., Liu, H., and Qing, G. (2018). Targeting oncogenic Myc as a strat-
egy for cancer treatment. Signal Transduct. Target. Ther. 3, 5. https://doi.
org/10.1038/s41392-018-0008-7.
66. Bernard, E., Tuechler, H., Greenberg, P.L., Hasserjian, R.P., Arango
Ossa, J.E., Nannya, Y., Devlin, S.M., Creignou, M., Pinel, P.,
Monnier, L., et al. (2022). Molecular international prognostic scoring
system for myelodysplastic syndromes. NEJM Evid. 1. https://doi.
org/10.1056/EVIDoa2200008.
67. Hu, L., Liu, S., Peng, Y., Ge, R., Su, R., Senevirathne, C., Harada, B.T., Dai,
Q., Wei, J., Zhang, L., et al. (2022). m(6)A RNA modifications are measured
at single-base resolution across the mammalian transcriptome. Nat.
Biotechnol. 40, 1210–1219. https://doi.org/10.1038/s41587-022-01243-z.
68. Liu, C., Sun, H., Yi, Y., Shen, W., Li, K., Xiao, Y., Li, F., Li, Y., Hou, Y., Lu, B.,
et al. (2022). Absolute quantification of single-base m6A methylation in the
mammalian transcriptome using GLORI. Nat. Biotechnol. https://doi.org/
10.1038/s41587-022-01487-9.
69. Hendra, C., Pratanwanich, P.N., Wan, Y.K., Goh, W.S.S., Thiery, A., and
Göke, J. (2022). Detection of m6A from direct RNA sequencing using a
multiple instance learning framework. Nat. Methods 19, 1590–1598.
https://doi.org/10.1038/s41592-022-01666-1.
70. Xiao, Y.L., Liu, S., Ge, R., Wu, Y., He, C., Chen, M., and Tang, W. (2023).
Transcriptome-wide profiling and quantification of N(6)-methyladenosine
by enzyme-assisted adenosine deamination. Nat. Biotechnol. https://
doi.org/10.1038/s41587-022-01587-6.
ll
OPEN ACCESS Article
14 Molecular Cell 83, 1–15, April 6, 2023
Please cite this article in press as: Cie
sla et al., m6
A-driven SF3B1 translation control steers splicing to direct genome integrity and leukemogenesis,
Molecular Cell (2023), https://doi.org/10.1016/j.molcel.2023.02.024
16. 71. Dong, H.J., Zhang, R., Kuang, Y., and Wang, X.J. (2021). Selective regula-
tion in ribosome biogenesis and protein production for efficient viral trans-
lation. Arch. Microbiol. 203, 1021–1032. https://doi.org/10.1007/s00203-
020-02094-5.
72. Yin, R., Chang, J., Li, Y., Gao, Z., Qiu, Q., Wang, Q., Han, G., Chai, J., Feng,
M., Wang, P., et al. (2022). Differential m(6)A RNA landscapes across he-
matopoiesis reveal a role for IGF2BP2 in preserving hematopoietic stem
cell function. Cell Stem Cell 29. 149–159.e7. https://doi.org/10.1016/j.
stem.2021.09.014.
73. Orsolic, I., Carrier, A., and Esteller, M. (2023). Genetic and epigenetic de-
fects of the RNA modification machinery in cancer. Trends Genet. 39,
74–88. https://doi.org/10.1016/j.tig.2022.10.004.
74. Bellodi, C., Kopmar, N., and Ruggero, D. (2010). Deregulation of onco-
gene-induced senescence and p53 translational control in X-linked dys-
keratosis congenita. EMBO J. 29, 1865–1876. https://doi.org/10.1038/
emboj.2010.83.
75. Team, R. Core. (2017). R: a language and environment for statistical
computing. (R Foundation for Statistical Computing, Vienna).
76. Dobin, A., Davis, C.A., Schlesinger, F., Drenkow, J., Zaleski, C., Jha, S.,
Batut, P., Chaisson, M., and Gingeras, T.R. (2013). STAR: ultrafast univer-
sal RNA-seq aligner. Bioinformatics 29, 15–21. https://doi.org/10.1093/
bioinformatics/bts635.
77. Love, M.I., Huber, W., and Anders, S. (2014). Moderated estimation of fold
change and dispersion for RNA-seq data with DESeq2. Genome Biol. 15,
550. https://doi.org/10.1186/s13059-014-0550-8.
78. Danecek, P., Bonfield, J.K., Liddle, J., Marshall, J., Ohan, V., Pollard, M.O.,
Whitwham, A., Keane, T., McCarthy, S.A., Davies, R.M., and Li, H. (2021).
Twelve years of SAMtools and BCFtools. GigaScience 10, giab008.
https://doi.org/10.1093/gigascience/giab008.
79. Foroutan, M., Bhuva, D.D., Lyu, R., Horan, K., Cursons, J., and Davis,
M.J. (2018). Single sample scoring of molecular phenotypes. BMC
Bioinformatics 19, 404. https://doi.org/10.1186/s12859-018-2435-4.
80. Subramanian, A., Tamayo, P., Mootha, V.K., Mukherjee, S., Ebert, B.L.,
Gillette, M.A., Paulovich, A., Pomeroy, S.L., Golub, T.R., Lander, E.S.,
and Mesirov, J.P. (2005). Gene set enrichment analysis: a knowledge-
based approach for interpreting genome-wide expression profiles. Proc.
Natl. Acad. Sci. USA 102, 15545–15550. https://doi.org/10.1073/pnas.
0506580102.
81. Langmead, B., and Salzberg, S.L. (2012). Fast gapped-read alignment
with Bowtie 2. Nat. Methods 9, 357–359. https://doi.org/10.1038/
nmeth.1923.
82. Incarnato, D., Morandi, E., Simon, L.M., and Oliviero, S. (2018). RNA
Framework: an all-in-one toolkit for the analysis of RNA structures and
post-transcriptional modifications. Nucleic Acids Res. 46, e97. https://
doi.org/10.1093/nar/gky486.
83. Gohr, A., and Irimia, M. (2019). Matt: Unix tools for alternative splicing anal-
ysis. Bioinformatics 35, 130–132. https://doi.org/10.1093/bioinformatics/
bty606.
84. Schneider, C.A., Rasband, W.S., and Eliceiri, K.W. (2012). NIH Image to
ImageJ: 25 years of image analysis. Nat. Methods 9, 671–675. https://
doi.org/10.1038/nmeth.2089.
85. Arber, D.A., Orazi, A., Hasserjian, R., Thiele, J., Borowitz, M.J., Le Beau,
M.M., Bloomfield, C.D., Cazzola, M., and Vardiman, J.W. (2016). The
2016 revision to the World Health Organization classification of myeloid
neoplasms and acute leukemia. Blood 127, 2391–2405. https://doi.org/
10.1182/blood-2016-03-643544.
86. Greenberg, P.L., Tuechler, H., Schanz, J., Sanz, G., Garcia-Manero, G.,
Solé, F., Bennett, J.M., Bowen, D., Fenaux, P., Dreyfus, F., et al. (2012).
Revised international prognostic scoring system for myelodysplastic syn-
dromes. Blood 120, 2454–2465. https://doi.org/10.1182/blood-2012-03-
420489.
87. Scharenberg, C., Giai, V., Pellagatti, A., Saft, L., Dimitriou, M., Jansson,
M., J€
adersten, M., Grandien, A., Douagi, I., Neuberg, D.S., et al. (2017).
Progression in patients with low- and intermediate-1-risk del(5q) myelo-
dysplastic syndromes is predicted by a limited subset of mutations.
Haematologica 102, 498–508. https://doi.org/10.3324/haematol.2016.
152025.
88. Papaemmanuil, E., Gerstung, M., Malcovati, L., Tauro, S., Gundem, G.,
Van Loo, P., Yoon, C.J., Ellis, P., Wedge, D.C., Pellagatti, A., et al.
(2013). Clinical and biological implications of driver mutations in myelodys-
plastic syndromes. Blood 122, 3616–3627. quiz 3699. https://doi.org/10.
1182/blood-2013-08-518886.
89. Chu, C., Quinn, J., and Chang, H.Y. (2012). Chromatin isolation by RNA
purification (ChIRP). J. Vis. Exp. 3912.
90. Schmidt, K., Joyce, C.E., Buquicchio, F., Brown, A., Ritz, J., Distel, R.J.,
Yoon, C.H., and Novina, C.D. (2016). The lncRNA SLNCR1 mediates mel-
anoma invasion through a conserved SRA1-like region. Cell Rep. 15,
2025–2037. https://doi.org/10.1016/j.celrep.2016.04.018.
91. Kozak, M. (1998). Primer extension analysis of eukaryotic ribosome-
mRNA complexes. Nucleic Acids Res. 26, 4853–4859. https://doi.org/
10.1093/nar/26.21.4853.
92. Engel, M., Eggert, C., Kaplick, P.M., Eder, M., Röh, S., Tietze, L.,
Namendorf, C., Arloth, J., Weber, P., Rex-Haffner, M., et al. (2018). The
role of m(6)A/m-RNA methylation in stress response regulation. Neuron
99. 389–403.e9. https://doi.org/10.1016/j.neuron.2018.07.009.
93. Jacobi, A.M., Rettig, G.R., Turk, R., Collingwood, M.A., Zeiner, S.A.,
Quadros, R.M., Harms, D.W., Bonthuis, P.J., Gregg, C., Ohtsuka, M.,
et al. (2017). Simplified CRISPR tools for efficient genome editing and
streamlined protocols for their delivery into mammalian cells and mouse
zygotes. Methods 121–122, 16–28. https://doi.org/10.1016/j.ymeth.
2017.03.021.
94. Simon, L.M., Morandi, E., Luganini, A., Gribaudo, G., Martinez-Sobrido, L.,
Turner, D.H., Oliviero, S., and Incarnato, D. (2019). In vivo analysis of influ-
enza A mRNA secondary structures identifies critical regulatory motifs.
Nucleic Acids Res. 47, 7003–7017. https://doi.org/10.1093/nar/gkz318.
95. Liberzon, A., Birger, C., Thorvaldsdóttir, H., Ghandi, M., Mesirov, J.P., and
Tamayo, P. (2015). The Molecular Signatures Database (MSigDB) hallmark
gene set collection. Cell Syst. 1, 417–425. https://doi.org/10.1016/j.cels.
2015.12.004.
96. Zubradt, M., Gupta, P., Persad, S., Lambowitz, A.M., Weissman, J.S., and
Rouskin, S. (2017). DMS-MaPseq for genome-wide or targeted RNA struc-
ture probing in vivo. Nat. Methods 14, 75–82. https://doi.org/10.1038/
nmeth.4057.
ll
OPEN ACCESS
Article
Molecular Cell 83, 1–15, April 6, 2023 15
Please cite this article in press as: Cie
sla et al., m6
A-driven SF3B1 translation control steers splicing to direct genome integrity and leukemogenesis,
Molecular Cell (2023), https://doi.org/10.1016/j.molcel.2023.02.024
19. Continued
REAGENT or RESOURCE SOURCE IDENTIFIER
RPMI-1640 Thermo Fisher Scientific CAT#61870010
Giemsa Stain, Modified Solution Sigma-Aldrich CAT#32884
May-Gr€
unwald Stain Sigma-Aldrich CAT# MG1L
StemSpan SFEM Stemcell Technologies CAT#09600
CD117 MicroBeads, mouse Miltenyi CAT#131091224
Recombinant human IL6 Peprotech CAT#200-06
Recombinant murine TPO Peprotech CAT#315-14
Recombinant murine SCF Peprotech CAT#250-03
Recombinant murine IL3 Peprotech CAT#213-13
Doxycycline hyclate Sigma-Aldrich CAT# D9891
TRIzol Reagent Thermo Fisher Scientific CAT#15596026
RNA 6000 Nano Bioanalyzer kit Agilent Technologies CAT# 5067-1511
High Sensitivity DNA Bioanalyzer kit Agilent Technologies CAT# 5067-4626
Polybrene Santa Cruz Biotechnology CAT# sc-134220
UltraPure Formamide Thermo Fisher Scientific CAT# 15515026
Dynabeads MyONE Streptavidin C1 Invitrogen CAT# 65001
RNAse A Sigma-Aldrich CAT#R4875
RNaseOUT Recombinant Ribonuclease Inhibitor Thermo Fisher Scientific CAT#10777019
ProLong Gold Antifade Mountant Thermo Fisher Scientific CAT# P36934
SsoAdvanced Universal SYBR Green Supermix BioRad CAT#1725274
TGIRT-III RT enzyme InGex CAT#TGIRT50
TaKaRa Taq DNA Polymerase TaKaRa CAT#R0001A
NEBNext Ultra II DNA Library Prep kit NEB CAT#E7645S
Gentle Cell Dissociation Reagent Stemcell Technologies CAT# 07174
ROCK Inhibitor (Y-27632) BD Biosciences CAT#562822
4–20% Mini-PROTEAN TGX Precast Protein Gels BioRad CAT#4561093
Cycloheximide Sigma-Aldrich CAT#C104450
actinomycinD Sigma-Aldrich CAT#A1410
HygromycinB Thermo Fisher Scientific CAT#10687-010
Etoposide Sigma-Aldrich CAT# ET1383
Propidium Iodide Sigma-Aldrich CAT#P4170
DAPI (4’,6-diamidino-2-Phenylindole, dihydrochloride) Thermo Fisher Scientific CAT# D1306
Formaldehyde solution Sigma-Aldrich CAT# 10751395
ON-TARGETplus Human SF3B1 SMART pool siRNA Dharmacon CAT#L-020061-01-0005
ON-TARGETplus Human ALKBH5 SMART pool siRNA Dharmacon CAT#L-004281-01-0005
ON-TARGETplus Human METTL3 SMART pool siRNA Dharmacon CAT#L-005170-02-0005
ON-TARGETplus Human FTO SMART pool siRNA Dharmacon CAT#L-004159-01-0005
ON-TARGETplus Non-targeting siRNA Dharmacon CAT#D-001810-01-0005
Critical commercial assays
Ribo-Zero Gold rRNA Removal Kit (Human/Mouse/Rat) Illumina CAT# MRZG126
TruSeq Stranded Total RNA LT Sample Prep Illumina CAT# RS-122-2201
NextSeq 500/550 High Output v2 kit (300 cycles) Illumina CAT# FC-160-2004
NextSeq 500/550 High Output v2.5 kit (75 cycles) Illumina CAT# 20024906
Direct-zol RNA MicroPrep Plus Zymo Research CAT# R2062
RNA Clean Concentrator-5 Zymo Research CAT# R1014
Quick Start Bradford Protein Assay Kit BioRad CAT#5000201
PEG Virus Precipitation Kit BioVision CAT# K904-50
High-Capacity cDNA Reverse Transcription Kit Thermo Fisher Scientific CAT#4368814
(Continued on next page)
ll
OPEN ACCESS Article
e3 Molecular Cell 83, 1–15.e1–e11, April 6, 2023
Please cite this article in press as: Cie
sla et al., m6
A-driven SF3B1 translation control steers splicing to direct genome integrity and leukemogenesis,
Molecular Cell (2023), https://doi.org/10.1016/j.molcel.2023.02.024
20. Continued
REAGENT or RESOURCE SOURCE IDENTIFIER
Dual-Luciferase Reporter Assay System Promega CAT# E1970
mMESSAGE mMACHINE T7 Transcription Kit Ambion CAT# AM1344
Tobacco Acid Phosphatase Thermo Fisher Scientific CAT# AM1700M
Magna RIP kit MERCK CAT# 17-700
Transcription Factor Buffer Set BD Biosciences CAT#562574
Alt-R S. p. CRISPR-Cas9 guide RNA kit Integrated DNA
Technologies
CAT#1081060
CometSlide RD Systems CAT#4250-200-03
b-mercaptoethanol Gibco CAT#31350010
SE Cell Line 4D-NucleofectorTM
X Kit L Lonza CAT#V4XC-1012
FirstChoice RLM-RACE Kit Invitrogen CAT#AM1700
MethoCult H4434 Classic Stemcell Technologies CAT#04434
MethoCult GF M3434 Stemcell Technologies CAT#03434
Deposited data
Raw and analyzed data: ASE-seq human fibroblasts This paper GEO: GSE189585
Raw and analyzed data: DMS probing This paper GEO: GSE147504
Raw and analyzed data: NHD13 cKIT+ RNA-seq This paper GEO: GSE198464
Raw and analyzed data: MOLM13 RNA-seq This paper GEO: GSE189584
Raw data Mendeley Dataset This paper https://data.mendeley.com/datasets/ftfvj7ct7f
Experimental models: Cell lines
WI-38 hT TRE-MYC This paper N/A
WI-38 hT TRE-MYC This paper N/A
WI-38 hT TRE-MYC SF3B1 5’UTR WT MS2 This paper N/A
WI-38 hT TRE-MYC SF3B1 5’UTR A88G MS2 This paper N/A
MOLM-13 DSMZ RRID: CVCL_2119
MOLM-13 SF3B1 5’UTR A88GMUT This paper N/A
HEK293T ATCC RRID: CVCL_0045
Phoenix Ampho ATCC RRID: CVCL_H716
Experimental models: Organisms/strains
Mouse: C57BL/6-Tg(Vav1-NUP98/HOXD13)
G2Apla/J (NHD13)
Jackson Laboratories CAT#010505
Mouse: NOD/SCID/g Jackson Laboratories CAT#005557
Mouse: C57/Bl6/SvJ Lund University N/A
Oligonucleotides
Oligonucleotides for qPCR analysis and genome
editing in Table S9
This paper N/A
Recombinant DNA
pLCV.2 TRE_c-MYC EF1a_rtTA_P2A_PuroCrRED This paper N/A
pLKO.1 TRC U6_shCTR hPGK_eGFP This paper N/A
pLKO.1 TRC U6_shSF3B1 (hsa) hPGK_eGFP This paper N/A
pLKO.1 TRC U6_shSF3B1 (mms) hPGK_eGFP This paper N/A
Monocistronic SF3B1 5’UTR WT This paper N/A
Monocistronic SF3B1 5’UTR WT ‘m6A-low’ This paper N/A
Monocistronic SF3B1 5’UTR A88GMUT
This paper N/A
Monocistronic SF3B1 5’UTR A88GMUT
‘m6A-low’ This paper N/A
Monocistronic SF3B1 5’UTR C89T MUT
This paper N/A
Monocistronic SF3B1 5’UTR uORF1MUT
This paper N/A
Monocistronic SF3B1 5’UTR uORF2MUT
This paper N/A
(Continued on next page)
ll
OPEN ACCESS
Article
Molecular Cell 83, 1–15.e1–e11, April 6, 2023 e4
Please cite this article in press as: Cie
sla et al., m6
A-driven SF3B1 translation control steers splicing to direct genome integrity and leukemogenesis,
Molecular Cell (2023), https://doi.org/10.1016/j.molcel.2023.02.024
21. RESOURCE AVAILABILITY
Lead Contact
Further information and requests for resources should be directed to and will be fulfilled by the Lead Contact, Cristian Bellodi (cristian.
bellodi@med.lu.se).
Continued
REAGENT or RESOURCE SOURCE IDENTIFIER
pBABE HRasV12
Bellodi et al.74
N/A
pBABE SF3B1 5’UTR WT-Fluc-3xMS2 Hygro This paper N/A
pBABE SF3B1 5’UTR A88GMUT
-Fluc-3xMS2 Hygro This paper N/A
pcDNA3.1 (-) + FLAG-NLS-MS2-GFP Addgene #86827
psPAX2 Addgene #12260
pMD2.G Addgene #12259
ALKBH5-dCas9 Addgene #134783
TetO-FLAG-4EBP1MUT Hsieh et al.23
N/A
Software and algorithms
R R Core Team75
https://www.R-project.org/
SnapGene GSL Biotech LLC https://www.snapgene.com/
Prism 7 software Pad Software, Inc. N/A
FACSDIVA BD Biosciences N/A
Image J N/A https://imagej.nih.gov/ij/
STAR v2.5.2b Dobin et al.76
https://code.google.com/archive/p/rna-star/
DESeq2 Love et al.77
https://bioconductor.org/packages/release/
bioc/html/DESeq2.html
rMAT v4.0.2 Shen et al.25
http://rnaseq-mats.sourceforge.net
Samtools v0.9.1 Danacek et al.78
https://salmon.readthedocs.io/en/latest/
salmon.html#references
Singscore Foroutan et al.79
https://www.bioconductor.org/packages/
release/bioc/html/singscore.html
GSEA v4.0.1 Subramanian et al.80
https://www.gsea-msigdb.org/gsea/index.jsp
bowtie2 Langmead et al.81
https://github.com/pzhaojohnson/RNA2Drawer/
blob/master/README.md
RNA Framework suite Incarnato et al.82
http://www.rnaframework.com
VastDB Center for Genomic
Regulation, University
of Toronto
http://vastdb.crg.eu/wiki/Main_Page
MATT Gohr and Irimia83
N/A
ImageJ Schneider et al.84
https://imagej.nih.gov/ij/
Cutadapt v3.4 N/A https://journal.embnet.org/index.php/embnet
journal/article/view/200 and https://github.
com/marcelm/cutadapt
Other
BioComp gradient station BioComp N/A
AriaIII cell sorter BD N/A
BD LSR Fortessa BD N/A
BD LSRII BD N/A
GloMax Explorer luminometer Promega N/A
Nikon Eclipse 2000 light microscope Nikon N/A
Zeiss 780 Confocal Laser Scanning Microscope Nikon N/A
NextSeq 500 sequencer Illumina N/A
UV Stratalinker 1800 Stratagene N/A
ll
OPEN ACCESS Article
e5 Molecular Cell 83, 1–15.e1–e11, April 6, 2023
Please cite this article in press as: Cie
sla et al., m6
A-driven SF3B1 translation control steers splicing to direct genome integrity and leukemogenesis,
Molecular Cell (2023), https://doi.org/10.1016/j.molcel.2023.02.024