
Download to read offline


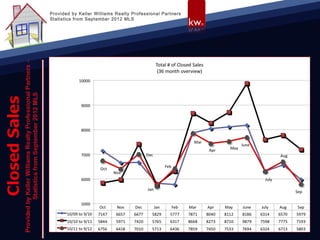

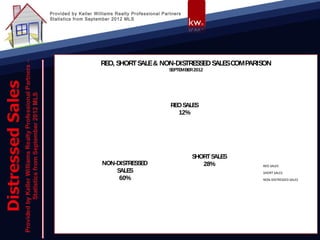

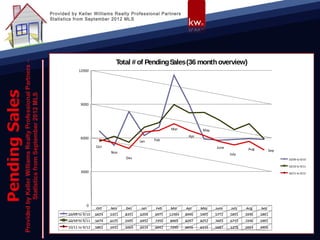

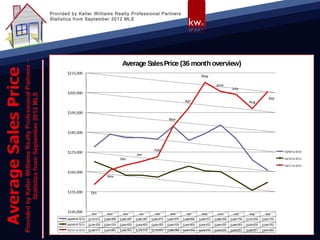

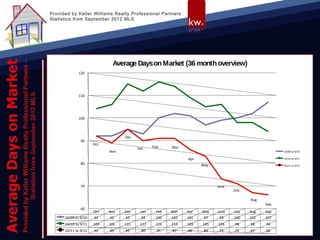

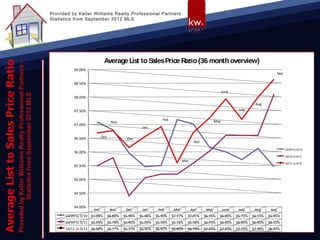

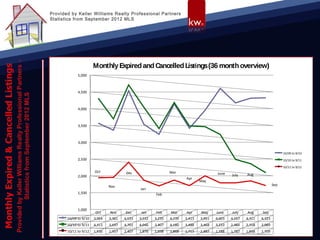


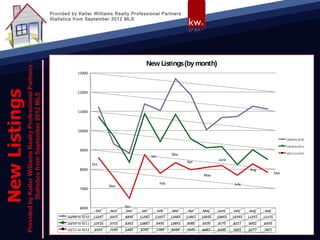

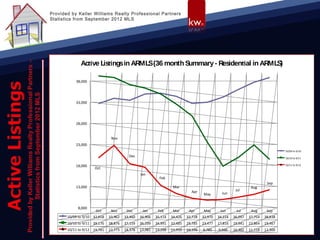

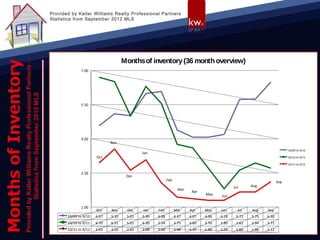


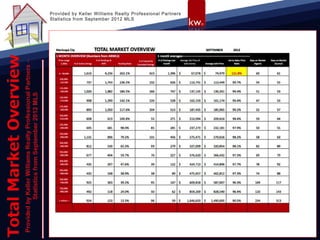


The document provides a comprehensive review of real estate statistics from Keller Williams Realty Professional Partners for September 2012, highlighting details such as sales prices, pending sales trends, market days, and inventory levels over a 36-month period. Key metrics include an average sales price of $215,000, a decline in active listings, and various percentages for different types of sales such as REO and short sales. The information is essential for understanding market trends and making informed real estate decisions.


