More Related Content
Similar to Condos only metrics
Similar to Condos only metrics (17)
Condos only metrics
- 1. Blake Taylor Taylor Real Estate
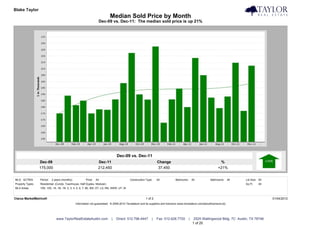
Median Sold Price by Month
Dec-09 vs. Dec-11: The median sold price is up 21%
Dec-09 vs. Dec-11
Dec-09 Dec-11 Change %
175,000 212,450 37,450 +21%
MLS: ACTRIS Period: 2 years (monthly) Price: All Construction Type: All Bedrooms: All Bathrooms: All Lot Size: All
Property Types: Residential: (Condo, Townhouse, Half Duplex, Modular) Sq Ft: All
MLS Areas: 10N, 10S, 1A, 1B, 1N, 2, 3, 4, 5, 6, 7, 8E, 8W, DT, LS, RN, SWW, UT, W
Clarus MarketMetrics® 1 of 2 01/04/2012
Information not guaranteed. © 2009-2010 Terradatum and its suppliers and licensors (www.terradatum.com/about/licensors.td).
www.TaylorRealEstateAustin.com | Direct: 512.796.4447 | Fax: 512.628.7720 | 2525 Wallingwood Bldg. 7C Austin, TX 78746
1 of 20
- 2. Blake Taylor Taylor Real Estate
Median Sold Price by Month
Dec-09 vs. Dec-11: The median sold price is up 21%
Time Period Median Price # Units Average DOM
Dec-11 212,450 104 89
Nov-11 176,950 80 104
Oct-11 214,750 110 73
Sep-11 188,250 118 91
Aug-11 179,185 158 98
Jul-11 187,410 165 79
Jun-11 205,000 161 75
May-11 218,500 140 74
Apr-11 180,000 123 67
Mar-11 194,500 108 115
Feb-11 186,000 78 105
Jan-11 167,750 68 103
Dec-10 227,500 99 84
Nov-10 185,864 66 109
Oct-10 189,950 74 94
Sep-10 222,395 78 93
Aug-10 198,750 130 78
Jul-10 186,000 101 83
Jun-10 177,900 159 76
May-10 178,250 156 80
Apr-10 175,000 137 80
Mar-10 185,000 140 78
Feb-10 181,450 76 90
Jan-10 189,000 68 98
Dec-09 175,000 91 75
Clarus MarketMetrics® 2 of 2 01/04/2012
Information not guaranteed. © 2009-2010 Terradatum and its suppliers and licensors (www.terradatum.com/about/licensors.td).
www.TaylorRealEstateAustin.com | Direct: 512.796.4447 | Fax: 512.628.7720 | 2525 Wallingwood Bldg. 7C Austin, TX 78746
2 of 20
- 3. Blake Taylor Taylor Real Estate
Median For Sale vs. Median Sold
Dec-09 vs. Dec-11: The median price of for sale properties is down 2% and the median price of sold properties is up 21%
Dec-09 vs. Dec-11 Dec-09 vs. Dec-11
Dec-09 Dec-11 Change % Dec-09 Dec-11 Change %
239,000 234,900 -4,100 -2% 175,000 212,450 37,450 +21%
MLS: ACTRIS Period: 2 years (monthly) Price: All Construction Type: All Bedrooms: All Bathrooms: All Lot Size: All
Property Types: Residential: (Condo, Townhouse, Half Duplex, Modular) Sq Ft: All
MLS Areas: 10N, 10S, 1A, 1B, 1N, 2, 3, 4, 5, 6, 7, 8E, 8W, DT, LS, RN, SWW, UT, W
Clarus MarketMetrics® 1 of 2 01/04/2012
Information not guaranteed. © 2009-2010 Terradatum and its suppliers and licensors (www.terradatum.com/about/licensors.td).
www.TaylorRealEstateAustin.com | Direct: 512.796.4447 | Fax: 512.628.7720 | 2525 Wallingwood Bldg. 7C Austin, TX 78746
3 of 20
- 4. Blake Taylor Taylor Real Estate
Median For Sale vs. Median Sold
Dec-09 vs. Dec-11: The median price of for sale properties is down 2% and the median price of sold properties is up 21%
For Sale # Properties Sold # Properties Price
Time Period Median For Sale Median Sold Difference
Dec-11 234,900 710 212,450 104 -22,450
Nov-11 237,800 753 176,950 80 -60,850
Oct-11 230,000 802 214,750 110 -15,250
Sep-11 231,725 844 188,250 118 -43,475
Aug-11 219,900 1,018 179,185 158 -40,715
Jul-11 215,000 1,139 187,410 165 -27,590
Jun-11 212,000 1,167 205,000 161 -7,000
May-11 212,500 1,195 218,500 140 6,000
Apr-11 204,694 1,154 180,000 123 -24,694
Mar-11 199,999 1,133 194,500 108 -5,499
Feb-11 214,066 1,003 186,000 78 -28,066
Jan-11 211,000 982 167,750 68 -43,250
Dec-10 209,900 990 227,500 99 17,600
Nov-10 209,800 1,096 185,864 66 -23,937
Oct-10 204,875 1,150 189,950 74 -14,925
Sep-10 209,997 1,217 222,395 78 12,398
Aug-10 203,900 1,355 198,750 130 -5,150
Jul-10 205,000 1,448 186,000 101 -19,000
Jun-10 208,900 1,463 177,900 159 -31,000
May-10 215,000 1,392 178,250 156 -36,750
Apr-10 215,000 1,505 175,000 137 -40,000
Mar-10 219,900 1,444 185,000 140 -34,900
Feb-10 225,000 1,277 181,450 76 -43,550
Jan-10 229,000 1,224 189,000 68 -40,000
Dec-09 239,000 1,182 175,000 91 -64,000
Clarus MarketMetrics® 2 of 2 01/04/2012
Information not guaranteed. © 2009-2010 Terradatum and its suppliers and licensors (www.terradatum.com/about/licensors.td).
www.TaylorRealEstateAustin.com | Direct: 512.796.4447 | Fax: 512.628.7720 | 2525 Wallingwood Bldg. 7C Austin, TX 78746
4 of 20
- 5. Blake Taylor Taylor Real Estate
Sold Properties by Month
Dec-09 vs. Dec-11: The number of Sold properties is up 14%
Dec-09 vs. Dec-11
Dec-09 Dec-11 Change %
91 104 13 +14%
MLS: ACTRIS Period: 2 years (monthly) Price: All Construction Type: All Bedrooms: All Bathrooms: All Lot Size: All
Property Types: Residential: (Condo, Townhouse, Half Duplex, Modular) Sq Ft: All
MLS Areas: 10N, 10S, 1A, 1B, 1N, 2, 3, 4, 5, 6, 7, 8E, 8W, DT, LS, RN, SWW, UT, W
Clarus MarketMetrics® 1 of 2 01/04/2012
Information not guaranteed. © 2009-2010 Terradatum and its suppliers and licensors (www.terradatum.com/about/licensors.td).
www.TaylorRealEstateAustin.com | Direct: 512.796.4447 | Fax: 512.628.7720 | 2525 Wallingwood Bldg. 7C Austin, TX 78746
5 of 20
- 6. Blake Taylor Taylor Real Estate
Sold Properties by Month
Dec-09 vs. Dec-11: The number of Sold properties is up 14%
Full Market Bank Properties Non-Bank Properties
Time Period # Properties Median Price Average DOM # Properties % Bank Median Price # Properties % Non-Bank Median Price
Dec-11 104 212,450 89 12 11.5 162,500 92 88.5 231,000
Nov-11 80 176,950 104 5 6.2 140,900 75 93.8 180,000
Oct-11 110 214,750 73 10 9.1 153,750 100 90.9 226,342
Sep-11 118 188,250 91 7 5.9 94,936 111 94.1 195,500
Aug-11 158 179,185 98 9 5.7 188,395 149 94.3 178,370
Jul-11 165 187,410 79 14 8.5 131,375 151 91.5 190,000
Jun-11 161 205,000 75 14 8.7 192,500 147 91.3 215,000
May-11 140 218,500 74 8 5.7 103,500 132 94.3 231,982
Apr-11 123 180,000 67 17 13.8 140,000 106 86.2 190,000
Mar-11 108 194,500 115 16 14.8 150,250 92 85.2 217,500
Feb-11 78 186,000 105 9 11.5 130,600 69 88.5 210,000
Jan-11 68 167,750 103 16 23.5 133,000 52 76.5 178,500
Dec-10 99 227,500 84 12 12.1 166,100 87 87.9 230,000
Nov-10 66 185,864 109 7 10.6 140,000 59 89.4 192,500
Oct-10 74 189,950 94 3 4.0 152,000 71 96.0 190,000
Sep-10 78 222,395 93 8 10.3 109,938 70 89.7 233,000
Aug-10 130 198,750 78 13 10.0 197,000 117 90.0 205,000
Jul-10 101 186,000 83 8 7.9 179,000 93 92.1 186,000
Jun-10 159 177,900 76 13 8.2 159,900 146 91.8 179,250
May-10 156 178,250 80 16 10.3 181,000 140 89.7 178,250
Apr-10 137 175,000 80 11 8.0 172,533 126 92.0 175,500
Mar-10 140 185,000 78 15 10.7 161,900 125 89.3 194,500
Feb-10 76 181,450 90 7 9.2 106,000 69 90.8 196,000
Jan-10 68 189,000 98 4 5.9 166,838 64 94.1 190,000
Dec-09 91 175,000 75 7 7.7 109,000 84 92.3 180,000
Clarus MarketMetrics® 2 of 2 01/04/2012
Information not guaranteed. © 2009-2010 Terradatum and its suppliers and licensors (www.terradatum.com/about/licensors.td).
www.TaylorRealEstateAustin.com | Direct: 512.796.4447 | Fax: 512.628.7720 | 2525 Wallingwood Bldg. 7C Austin, TX 78746
6 of 20
- 7. Blake Taylor Taylor Real Estate
Under Contract Properties by Month
Dec-09 vs. Dec-11: The number of Under Contract properties is up 27%
Dec-09 vs. Dec-11
Dec-09 Dec-11 Change %
75 95 20 +27%
MLS: ACTRIS Period: 2 years (monthly) Price: All Construction Type: All Bedrooms: All Bathrooms: All Lot Size: All
Property Types: Residential: (Condo, Townhouse, Half Duplex, Modular) Sq Ft: All
MLS Areas: 10N, 10S, 1A, 1B, 1N, 2, 3, 4, 5, 6, 7, 8E, 8W, DT, LS, RN, SWW, UT, W
Clarus MarketMetrics® 1 of 2 01/04/2012
Information not guaranteed. © 2009-2010 Terradatum and its suppliers and licensors (www.terradatum.com/about/licensors.td).
www.TaylorRealEstateAustin.com | Direct: 512.796.4447 | Fax: 512.628.7720 | 2525 Wallingwood Bldg. 7C Austin, TX 78746
7 of 20
- 8. Blake Taylor Taylor Real Estate
Under Contract Properties by Month
Dec-09 vs. Dec-11: The number of Under Contract properties is up 27%
Full Market Bank Properties Non-Bank Properties
Time Period # Properties Median Price Average DOM # Properties % Bank Median Price # Properties % Non-Bank Median Price
Dec-11 95 239,900 99 7 7.4 162,900 88 92.6 244,900
Nov-11 89 234,000 81 9 10.1 150,000 80 89.9 250,000
Oct-11 90 192,495 103 6 6.7 162,250 84 93.3 195,445
Sep-11 100 233,450 94 7 7.0 179,900 93 93.0 239,900
Aug-11 151 185,000 76 15 9.9 94,000 136 90.1 192,950
Jul-11 168 179,700 93 5 3.0 174,900 163 97.0 179,900
Jun-11 139 197,900 80 6 4.3 162,450 133 95.7 199,000
May-11 168 199,500 78 19 11.3 152,500 149 88.7 214,900
Apr-11 129 205,000 65 11 8.5 175,000 118 91.5 209,950
Mar-11 143 193,300 82 17 11.9 163,000 126 88.1 199,450
Feb-11 101 199,500 107 16 15.8 145,450 85 84.2 229,900
Jan-11 85 193,300 97 11 12.9 129,485 74 87.1 197,650
Dec-10 78 181,250 96 13 16.7 149,900 65 83.3 189,000
Nov-10 70 216,954 88 9 12.9 131,600 61 87.1 232,000
Oct-10 78 194,450 98 9 11.5 154,900 69 88.5 199,900
Sep-10 74 209,450 118 6 8.1 164,900 68 91.9 237,250
Aug-10 93 209,900 70 13 14.0 179,220 80 86.0 216,900
Jul-10 112 199,450 88 8 7.1 115,450 104 92.9 199,900
Jun-10 111 199,900 83 6 5.4 180,200 105 94.6 204,700
May-10 97 199,000 74 8 8.2 176,000 89 91.8 205,000
Apr-10 209 187,500 77 18 8.6 186,050 191 91.4 188,900
Mar-10 161 199,000 80 16 9.9 239,900 145 90.1 195,000
Feb-10 110 175,500 80 11 10.0 144,900 99 90.0 192,900
Jan-10 101 188,000 92 11 10.9 129,900 90 89.1 199,000
Dec-09 75 180,000 89 6 8.0 156,200 69 92.0 187,500
Clarus MarketMetrics® 2 of 2 01/04/2012
Information not guaranteed. © 2009-2010 Terradatum and its suppliers and licensors (www.terradatum.com/about/licensors.td).
www.TaylorRealEstateAustin.com | Direct: 512.796.4447 | Fax: 512.628.7720 | 2525 Wallingwood Bldg. 7C Austin, TX 78746
8 of 20
- 9. Blake Taylor Taylor Real Estate
New Properties by Month
Dec-09 vs. Dec-11: The number of New properties is down 7%
Dec-09 vs. Dec-11
Dec-09 Dec-11 Change %
149 138 -11 -7%
MLS: ACTRIS Period: 2 years (monthly) Price: All Construction Type: All Bedrooms: All Bathrooms: All Lot Size: All
Property Types: Residential: (Condo, Townhouse, Half Duplex, Modular) Sq Ft: All
MLS Areas: 10N, 10S, 1A, 1B, 1N, 2, 3, 4, 5, 6, 7, 8E, 8W, DT, LS, RN, SWW, UT, W
Clarus MarketMetrics® 1 of 2 01/04/2012
Information not guaranteed. © 2009-2010 Terradatum and its suppliers and licensors (www.terradatum.com/about/licensors.td).
www.TaylorRealEstateAustin.com | Direct: 512.796.4447 | Fax: 512.628.7720 | 2525 Wallingwood Bldg. 7C Austin, TX 78746
9 of 20
- 10. Blake Taylor Taylor Real Estate
New Properties by Month
Dec-09 vs. Dec-11: The number of New properties is down 7%
Full Market Bank Properties Non-Bank Properties
Time Period # Properties Median Price # Properties % Bank Median Price # Properties % Non-Bank Median Price
Dec-11 138 235,050 7 5.1 147,500 131 94.9 240,000
Nov-11 126 259,975 3 2.4 145,900 123 97.6 260,050
Oct-11 172 215,700 15 8.7 162,900 157 91.3 230,000
Sep-11 128 192,200 5 3.9 160,900 123 96.1 199,999
Aug-11 182 216,750 10 5.5 105,950 172 94.5 219,950
Jul-11 232 202,500 11 4.7 104,900 221 95.3 209,000
Jun-11 249 202,000 12 4.8 193,450 237 95.2 202,000
May-11 255 249,900 7 2.8 182,000 248 97.2 249,900
Apr-11 270 199,900 17 6.3 125,000 253 93.7 210,000
Mar-11 325 198,500 17 5.2 174,000 308 94.8 199,500
Feb-11 214 202,000 13 6.1 177,000 201 93.9 204,000
Jan-11 226 215,000 17 7.5 152,500 209 92.5 229,164
Dec-10 126 216,950 13 10.3 120,000 113 89.7 220,000
Nov-10 159 225,000 13 8.2 109,900 146 91.8 230,950
Oct-10 182 179,262 8 4.4 134,900 174 95.6 190,950
Sep-10 162 195,200 15 9.3 134,900 147 90.7 204,950
Aug-10 207 183,000 15 7.2 155,000 192 92.8 188,500
Jul-10 264 193,900 16 6.1 154,900 248 93.9 199,000
Jun-10 316 189,600 16 5.1 147,500 300 94.9 189,900
May-10 229 225,000 16 7.0 229,000 213 93.0 225,000
Apr-10 355 194,500 17 4.8 143,000 338 95.2 196,900
Mar-10 360 195,000 18 5.0 164,675 342 95.0 198,750
Feb-10 292 208,950 21 7.2 187,000 271 92.8 209,995
Jan-10 310 199,900 22 7.1 159,450 288 92.9 200,725
Dec-09 149 199,500 18 12.1 192,500 131 87.9 199,500
Clarus MarketMetrics® 2 of 2 01/04/2012
Information not guaranteed. © 2009-2010 Terradatum and its suppliers and licensors (www.terradatum.com/about/licensors.td).
www.TaylorRealEstateAustin.com | Direct: 512.796.4447 | Fax: 512.628.7720 | 2525 Wallingwood Bldg. 7C Austin, TX 78746
10 of 20
- 11. Blake Taylor Taylor Real Estate
For Sale Properties by Month
Dec-09 vs. Dec-11: The number of For Sale properties is down 40%
Dec-09 vs. Dec-11
Dec-09 Dec-11 Change %
1,182 710 -472 -40%
MLS: ACTRIS Period: 2 years (monthly) Price: All Construction Type: All Bedrooms: All Bathrooms: All Lot Size: All
Property Types: Residential: (Condo, Townhouse, Half Duplex, Modular) Sq Ft: All
MLS Areas: 10N, 10S, 1A, 1B, 1N, 2, 3, 4, 5, 6, 7, 8E, 8W, DT, LS, RN, SWW, UT, W
Clarus MarketMetrics® 1 of 2 01/04/2012
Information not guaranteed. © 2009-2010 Terradatum and its suppliers and licensors (www.terradatum.com/about/licensors.td).
www.TaylorRealEstateAustin.com | Direct: 512.796.4447 | Fax: 512.628.7720 | 2525 Wallingwood Bldg. 7C Austin, TX 78746
11 of 20
- 12. Blake Taylor Taylor Real Estate
For Sale Properties by Month
Dec-09 vs. Dec-11: The number of For Sale properties is down 40%
Full Market Bank Properties Non-Bank Properties
Time Period # Properties Median Price Average DOM # Properties % Bank Median Price # Properties % Non-Bank Median Price
Dec-11 710 234,900 127 31 4.4 185,000 679 95.6 238,900
Nov-11 753 237,800 124 35 4.7 162,900 718 95.3 244,950
Oct-11 802 230,000 121 39 4.9 164,900 763 95.1 235,000
Sep-11 844 231,725 123 36 4.3 164,950 808 95.7 234,994
Aug-11 1,018 219,900 115 49 4.8 147,500 969 95.2 225,000
Jul-11 1,139 215,000 111 45 4.0 164,900 1,094 96.0 219,900
Jun-11 1,167 212,000 109 42 3.6 169,950 1,125 96.4 214,900
May-11 1,195 212,500 108 50 4.2 162,400 1,145 95.8 214,900
Apr-11 1,154 204,694 104 59 5.1 154,900 1,095 94.9 209,000
Mar-11 1,133 199,999 108 64 5.7 169,500 1,069 94.3 205,000
Feb-11 1,003 214,066 125 66 6.6 155,450 937 93.4 219,500
Jan-11 982 211,000 137 67 6.8 149,900 915 93.2 219,900
Dec-10 990 209,900 149 67 6.8 149,900 923 93.2 215,000
Nov-10 1,096 209,800 140 69 6.3 151,000 1,027 93.7 215,000
Oct-10 1,150 204,875 136 70 6.1 154,400 1,080 93.9 209,948
Sep-10 1,217 209,997 133 72 5.9 154,900 1,145 94.1 215,000
Aug-10 1,355 203,900 124 77 5.7 159,900 1,278 94.3 208,950
Jul-10 1,448 205,000 117 72 5.0 156,450 1,376 95.0 209,900
Jun-10 1,463 208,900 113 67 4.6 164,000 1,396 95.4 209,948
May-10 1,392 215,000 116 63 4.5 179,900 1,329 95.5 215,000
Apr-10 1,505 215,000 118 73 4.8 165,000 1,432 95.2 219,000
Mar-10 1,444 219,900 121 77 5.3 187,000 1,367 94.7 224,900
Feb-10 1,277 225,000 126 74 5.8 180,000 1,203 94.2 229,900
Jan-10 1,224 229,000 138 67 5.5 165,900 1,157 94.5 234,995
Dec-09 1,182 239,000 152 58 4.9 165,900 1,124 95.1 242,950
Clarus MarketMetrics® 2 of 2 01/04/2012
Information not guaranteed. © 2009-2010 Terradatum and its suppliers and licensors (www.terradatum.com/about/licensors.td).
www.TaylorRealEstateAustin.com | Direct: 512.796.4447 | Fax: 512.628.7720 | 2525 Wallingwood Bldg. 7C Austin, TX 78746
12 of 20
- 13. Blake Taylor Taylor Real Estate
Expired Properties by Month
Dec-09 vs. Dec-11: The number of Expired properties is down 47%
Dec-09 vs. Dec-11
Dec-09 Dec-11 Change %
193 102 -91 -47%
MLS: ACTRIS Period: 2 years (monthly) Price: All Construction Type: All Bedrooms: All Bathrooms: All Lot Size: All
Property Types: Residential: (Condo, Townhouse, Half Duplex, Modular) Sq Ft: All
MLS Areas: 10N, 10S, 1A, 1B, 1N, 2, 3, 4, 5, 6, 7, 8E, 8W, DT, LS, RN, SWW, UT, W
Clarus MarketMetrics® 1 of 2 01/04/2012
Information not guaranteed. © 2009-2010 Terradatum and its suppliers and licensors (www.terradatum.com/about/licensors.td).
www.TaylorRealEstateAustin.com | Direct: 512.796.4447 | Fax: 512.628.7720 | 2525 Wallingwood Bldg. 7C Austin, TX 78746
13 of 20
- 14. Blake Taylor Taylor Real Estate
Expired Properties by Month
Dec-09 vs. Dec-11: The number of Expired properties is down 47%
Full Market Bank Properties Non-Bank Properties
Time Period # Properties Median Price Average DOM # Properties % Bank Median Price # Properties % Non-Bank Median Price
Dec-11 102 217,000 150 3 2.9 165,000 99 97.1 219,000
Nov-11 92 257,000 131 2 2.2 82,250 90 97.8 258,975
Oct-11 85 249,900 145 1 1.2 169,900 84 98.8 249,900
Sep-11 114 204,950 146 5 4.4 145,000 109 95.6 209,900
Aug-11 151 200,000 139 3 2.0 100,000 148 98.0 200,000
Jul-11 135 245,000 120 1 0.7 439,000 134 99.3 244,555
Jun-11 121 192,900 134 2 1.6 426,700 119 98.3 189,900
May-11 109 210,000 132 1 0.9 305,000 108 99.1 209,950
Apr-11 85 262,000 127 5 5.9 150,000 80 94.1 277,400
Mar-11 106 207,450 162 5 4.7 179,900 101 95.3 209,900
Feb-11 94 235,000 180 3 3.2 153,000 91 96.8 235,000
Jan-11 108 222,450 200 3 2.8 199,900 105 97.2 225,000
Dec-10 156 219,500 172 4 2.6 204,250 152 97.4 219,500
Nov-10 162 215,000 146 6 3.7 279,700 156 96.3 212,000
Oct-10 135 204,800 155 5 3.7 144,900 130 96.3 209,450
Sep-10 175 209,900 139 4 2.3 142,825 171 97.7 210,000
Aug-10 207 179,000 134 7 3.4 144,900 200 96.6 179,650
Jul-10 188 207,450 127 2 1.1 131,950 186 98.9 208,500
Jun-10 168 199,000 131 5 3.0 163,900 163 97.0 199,800
May-10 148 209,950 147 4 2.7 149,900 144 97.3 212,500
Apr-10 133 275,000 210 8 6.0 129,900 125 94.0 283,000
Mar-10 133 230,000 138 5 3.8 158,000 128 96.2 230,000
Feb-10 83 229,000 133 4 4.8 174,900 79 95.2 238,490
Jan-10 138 254,250 168 3 2.2 174,900 135 97.8 260,000
Dec-09 193 254,900 159 7 3.6 165,900 186 96.4 265,000
Clarus MarketMetrics® 2 of 2 01/04/2012
Information not guaranteed. © 2009-2010 Terradatum and its suppliers and licensors (www.terradatum.com/about/licensors.td).
www.TaylorRealEstateAustin.com | Direct: 512.796.4447 | Fax: 512.628.7720 | 2525 Wallingwood Bldg. 7C Austin, TX 78746
14 of 20
- 15. Blake Taylor Taylor Real Estate
Supply & Demand by Month
Dec-09 vs. Dec-11: The number of for sale properties is down 40% and the number of sold properties is up 14%
Dec-09 vs. Dec-11 Dec-09 vs. Dec-11
Dec-09 Dec-11 Change % Dec-09 Dec-11 Change %
1,182 710 -472 -40% 91 104 13 +14%
MLS: ACTRIS Period: 2 years (monthly) Price: All Construction Type: All Bedrooms: All Bathrooms: All Lot Size: All
Property Types: Residential: (Condo, Townhouse, Half Duplex, Modular) Sq Ft: All
MLS Areas: 10N, 10S, 1A, 1B, 1N, 2, 3, 4, 5, 6, 7, 8E, 8W, DT, LS, RN, SWW, UT, W
Clarus MarketMetrics® 1 of 2 01/04/2012
Information not guaranteed. © 2009-2010 Terradatum and its suppliers and licensors (www.terradatum.com/about/licensors.td).
www.TaylorRealEstateAustin.com | Direct: 512.796.4447 | Fax: 512.628.7720 | 2525 Wallingwood Bldg. 7C Austin, TX 78746
15 of 20
- 16. Blake Taylor Taylor Real Estate
Supply & Demand by Month
Dec-09 vs. Dec-11: The number of for sale properties is down 40% and the number of sold properties is up 14%
# Properties Average DOM # Properties Average DOM
Time Period For Sale For Sale Sold Sold
Dec-11 710 127 104 89
Nov-11 753 124 80 104
Oct-11 802 121 110 73
Sep-11 844 123 118 91
Aug-11 1,018 115 158 98
Jul-11 1,139 111 165 79
Jun-11 1,167 109 161 75
May-11 1,195 108 140 74
Apr-11 1,154 104 123 67
Mar-11 1,133 108 108 115
Feb-11 1,003 125 78 105
Jan-11 982 137 68 103
Dec-10 990 149 99 84
Nov-10 1,096 140 66 109
Oct-10 1,150 136 74 94
Sep-10 1,217 133 78 93
Aug-10 1,355 124 130 78
Jul-10 1,448 117 101 83
Jun-10 1,463 113 159 76
May-10 1,392 116 156 80
Apr-10 1,505 118 137 80
Mar-10 1,444 121 140 78
Feb-10 1,277 126 76 90
Jan-10 1,224 138 68 98
Dec-09 1,182 152 91 75
Clarus MarketMetrics® 2 of 2 01/04/2012
Information not guaranteed. © 2009-2010 Terradatum and its suppliers and licensors (www.terradatum.com/about/licensors.td).
www.TaylorRealEstateAustin.com | Direct: 512.796.4447 | Fax: 512.628.7720 | 2525 Wallingwood Bldg. 7C Austin, TX 78746
16 of 20
- 17. Blake Taylor Taylor Real Estate
The Average Days on Market by Month
Dec-09 vs. Dec-11: The average days on market is up 12%
Dec-09 vs. Dec-11
Dec-09 Dec-11 Change %
89 99 10 +12%
MLS: ACTRIS Period: 2 years (monthly) Price: All Construction Type: All Bedrooms: All Bathrooms: All Lot Size: All
Property Types: Residential: (Condo, Townhouse, Half Duplex, Modular) Sq Ft: All
MLS Areas: 10N, 10S, 1A, 1B, 1N, 2, 3, 4, 5, 6, 7, 8E, 8W, DT, LS, RN, SWW, UT, W
Clarus MarketMetrics® 1 of 2 01/04/2012
Information not guaranteed. © 2009-2010 Terradatum and its suppliers and licensors (www.terradatum.com/about/licensors.td).
www.TaylorRealEstateAustin.com | Direct: 512.796.4447 | Fax: 512.628.7720 | 2525 Wallingwood Bldg. 7C Austin, TX 78746
17 of 20
- 18. Blake Taylor Taylor Real Estate
The Average Days on Market by Month
Dec-09 vs. Dec-11: The average days on market is up 12%
Time Period Average DOM # UC Units
Dec-11 99 95
Nov-11 81 89
Oct-11 103 90
Sep-11 94 100
Aug-11 76 151
Jul-11 93 168
Jun-11 80 139
May-11 78 168
Apr-11 65 129
Mar-11 82 143
Feb-11 107 101
Jan-11 97 85
Dec-10 96 78
Nov-10 88 70
Oct-10 98 78
Sep-10 118 74
Aug-10 70 93
Jul-10 88 112
Jun-10 83 111
May-10 74 97
Apr-10 77 209
Mar-10 80 161
Feb-10 80 110
Jan-10 92 101
Dec-09 89 75
Clarus MarketMetrics® 2 of 2 01/04/2012
Information not guaranteed. © 2009-2010 Terradatum and its suppliers and licensors (www.terradatum.com/about/licensors.td).
www.TaylorRealEstateAustin.com | Direct: 512.796.4447 | Fax: 512.628.7720 | 2525 Wallingwood Bldg. 7C Austin, TX 78746
18 of 20
- 19. Blake Taylor Taylor Real Estate
Months Supply of Inventory
Dec-09 vs. Dec-11: The average months supply of inventory is down 56%
Dec-09 vs. Dec-11
Dec-09 Dec-11 Change %
12.2 5.4 -6.8 -56%
MLS: ACTRIS Period: 2 years (monthly) Price: All Construction Type: All Bedrooms: All Bathrooms: All Lot Size: All
Property Types: Residential: (Condo, Townhouse, Half Duplex, Modular) Sq Ft: All
MLS Areas: 10N, 10S, 1A, 1B, 1N, 2, 3, 4, 5, 6, 7, 8E, 8W, DT, LS, RN, SWW, UT, W
Clarus MarketMetrics® 1 of 2 01/04/2012
Information not guaranteed. © 2009-2010 Terradatum and its suppliers and licensors (www.terradatum.com/about/licensors.td).
www.TaylorRealEstateAustin.com | Direct: 512.796.4447 | Fax: 512.628.7720 | 2525 Wallingwood Bldg. 7C Austin, TX 78746
19 of 20
- 20. Blake Taylor Taylor Real Estate
Months Supply of Inventory
Dec-09 vs. Dec-11: The average months supply of inventory is down 56%
# Units For Sale # UC Units UC Average
Time Period Last Day of Month During Month MSI DOM
Dec-11 513 95 5.4 99
Nov-11 572 89 6.4 81
Oct-11 627 90 7.0 103
Sep-11 630 100 6.3 94
Aug-11 716 151 4.7 76
Jul-11 836 168 5.0 93
Jun-11 907 139 6.5 80
May-11 918 168 5.5 78
Apr-11 940 129 7.3 65
Mar-11 884 143 6.2 82
Feb-11 808 101 8.0 107
Jan-11 789 85 9.3 97
Dec-10 756 78 9.7 96
Nov-10 864 70 12.3 88
Oct-10 937 78 12.0 98
Sep-10 968 74 13.1 118
Aug-10 1,055 93 11.3 70
Jul-10 1,148 112 10.2 88
Jun-10 1,184 111 10.7 83
May-10 1,147 97 11.8 74
Apr-10 1,163 209 5.6 77
Mar-10 1,150 161 7.1 80
Feb-10 1,084 110 9.9 80
Jan-10 985 101 9.8 92
Dec-09 914 75 12.2 89
Clarus MarketMetrics® 2 of 2 01/04/2012
Information not guaranteed. © 2009-2010 Terradatum and its suppliers and licensors (www.terradatum.com/about/licensors.td).
www.TaylorRealEstateAustin.com | Direct: 512.796.4447 | Fax: 512.628.7720 | 2525 Wallingwood Bldg. 7C Austin, TX 78746
20 of 20