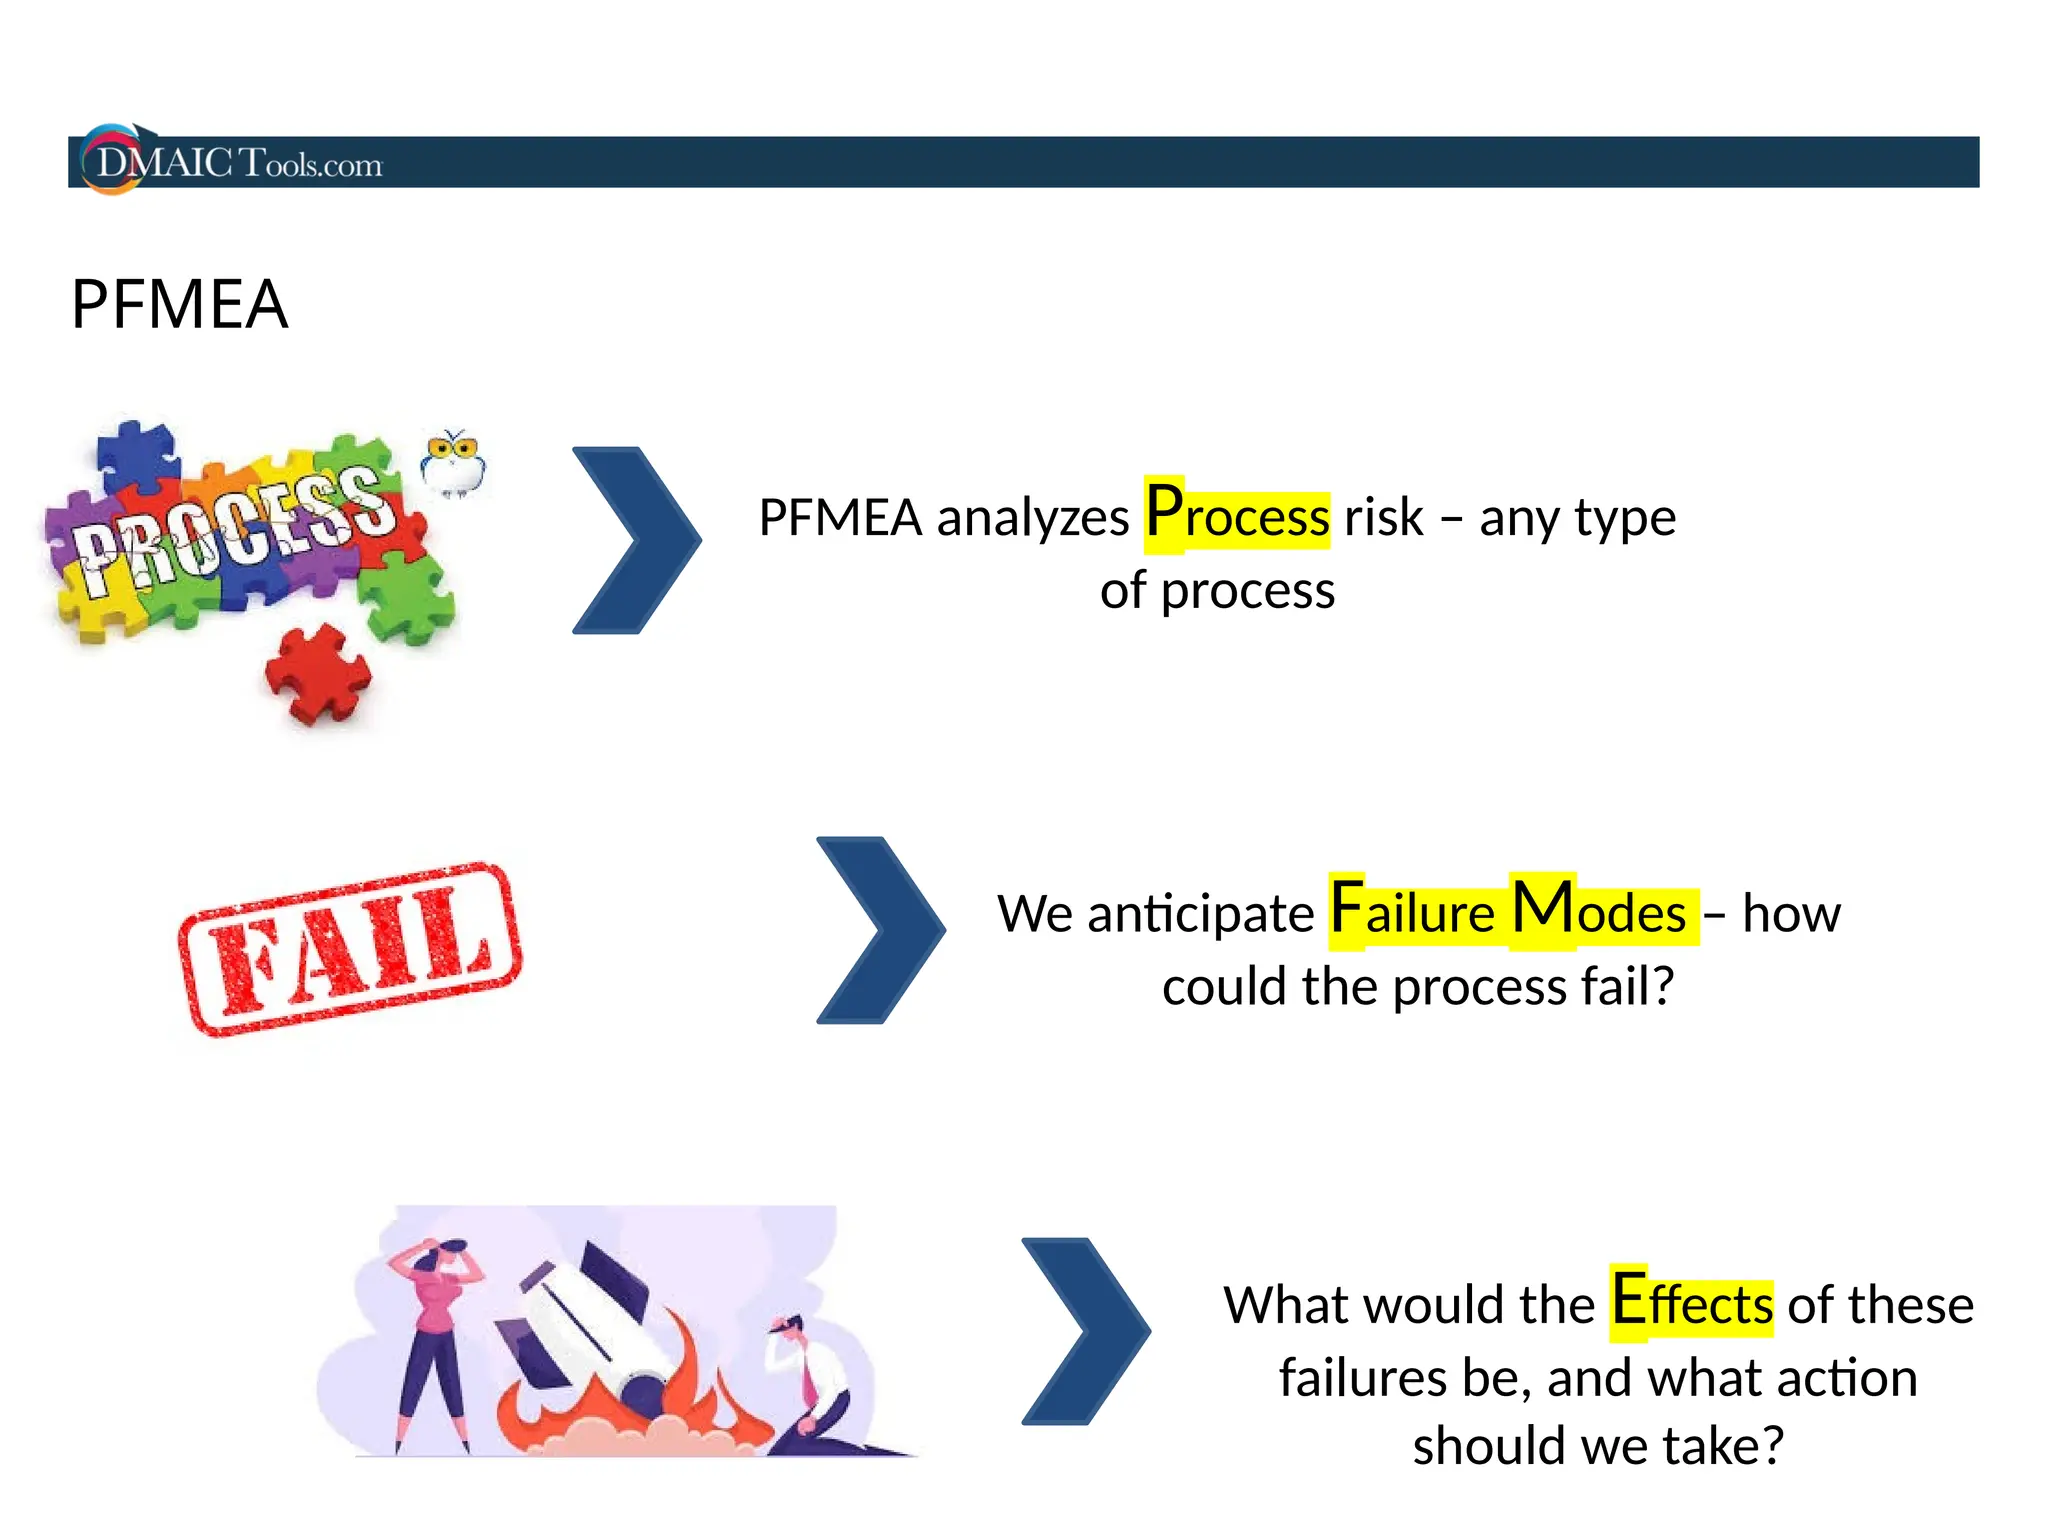
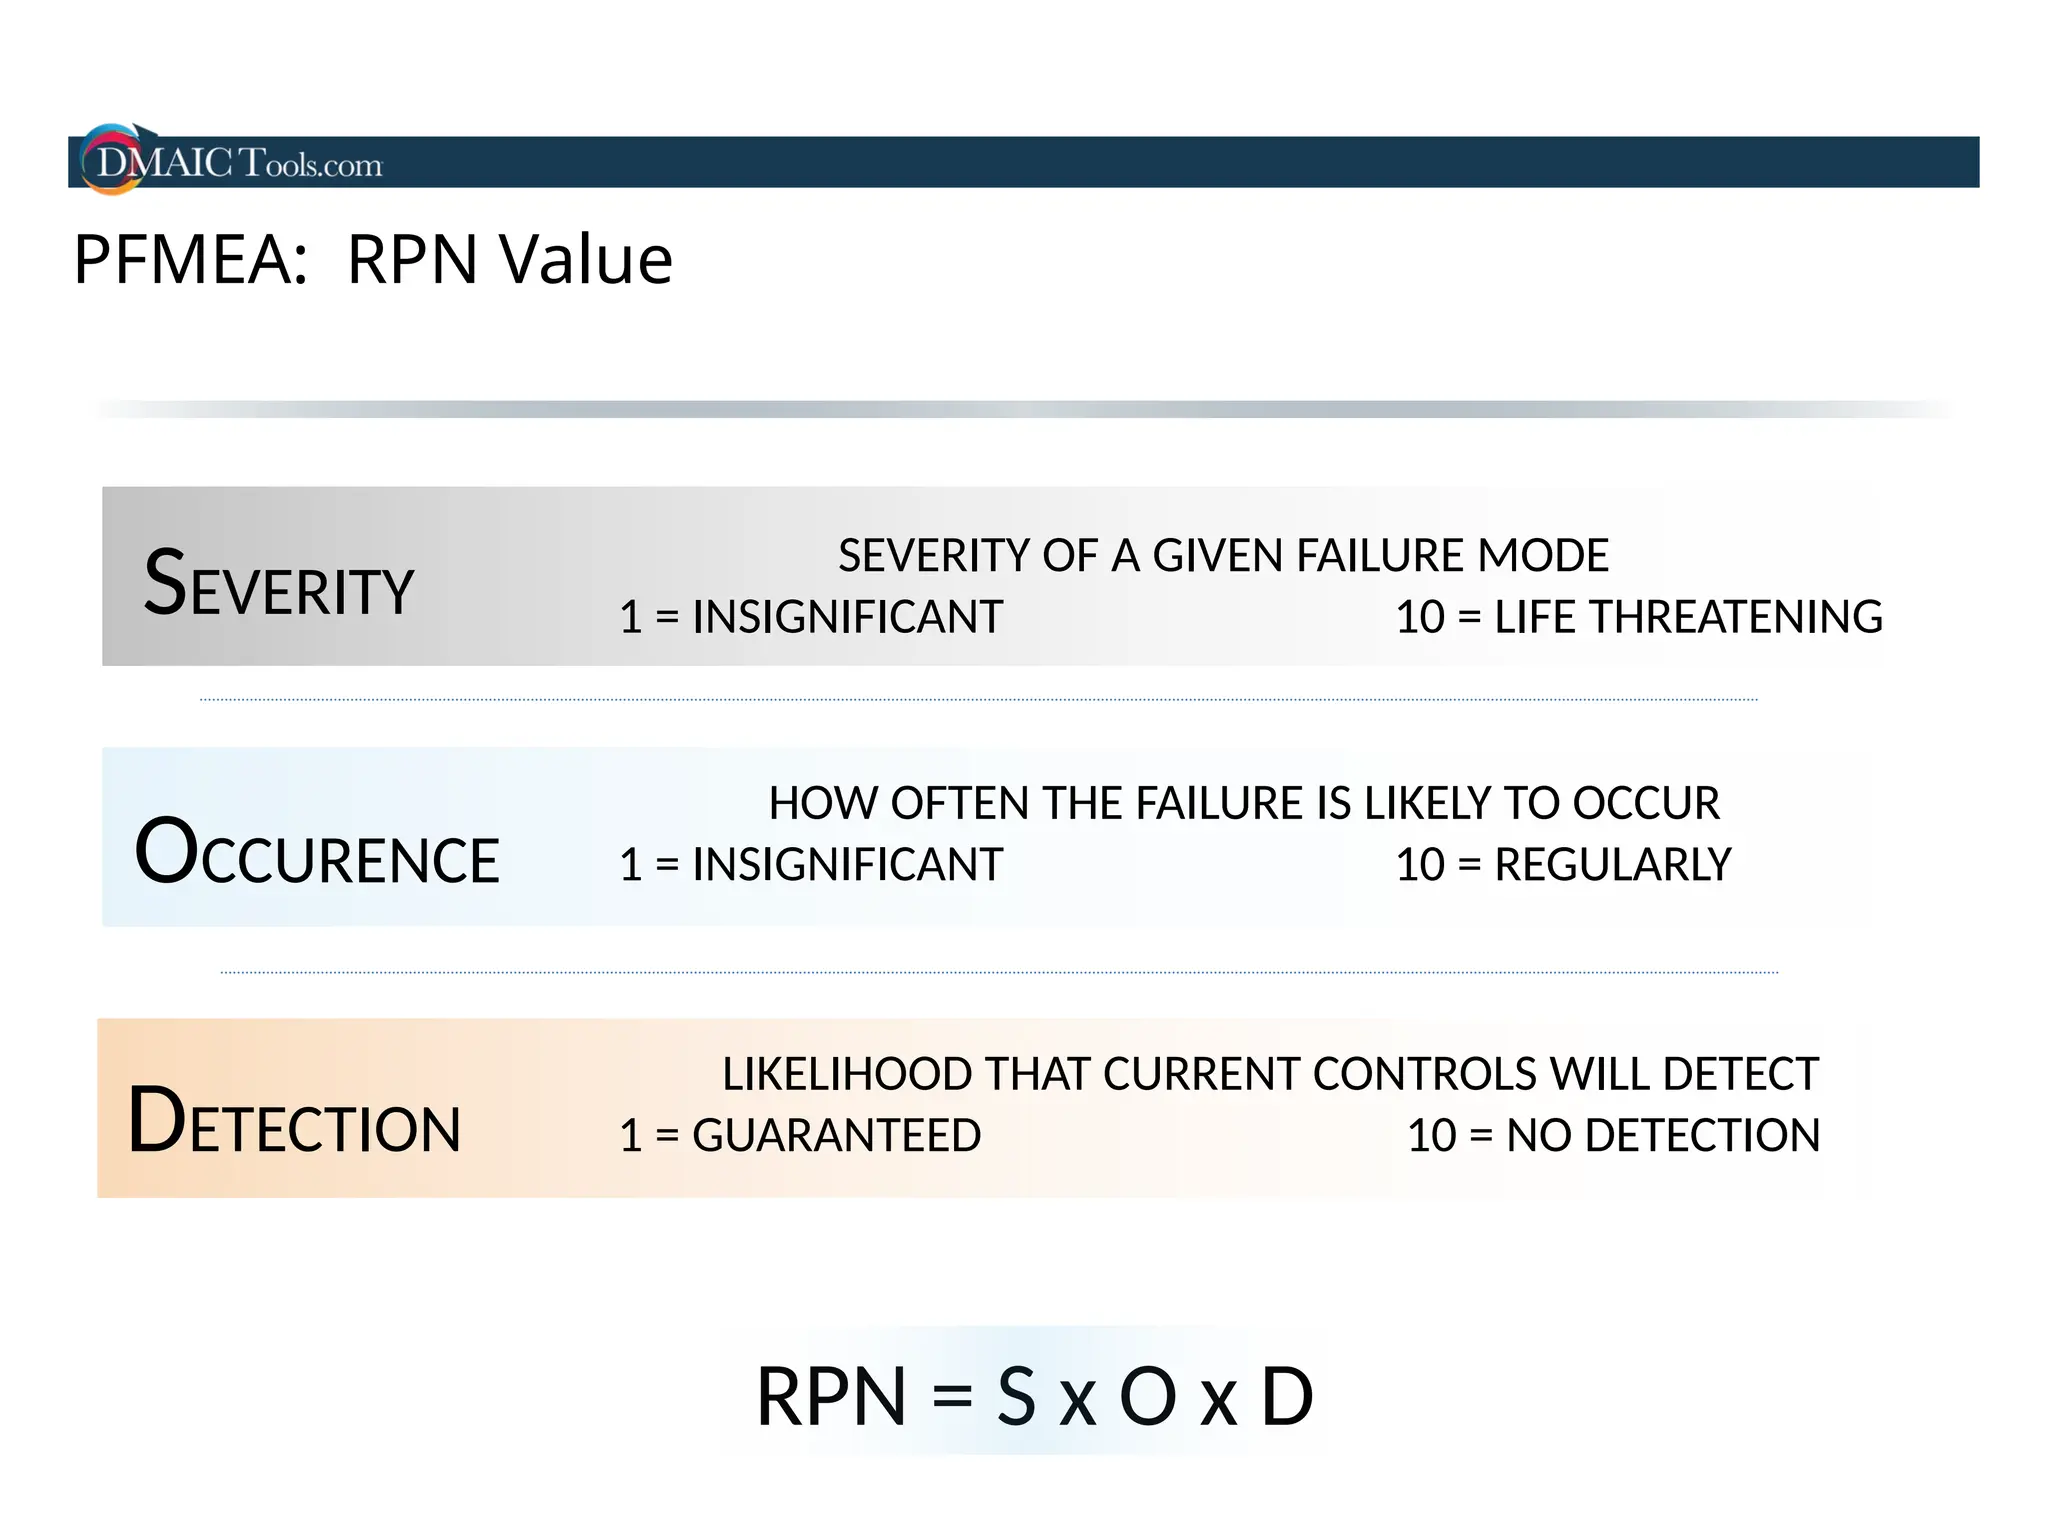
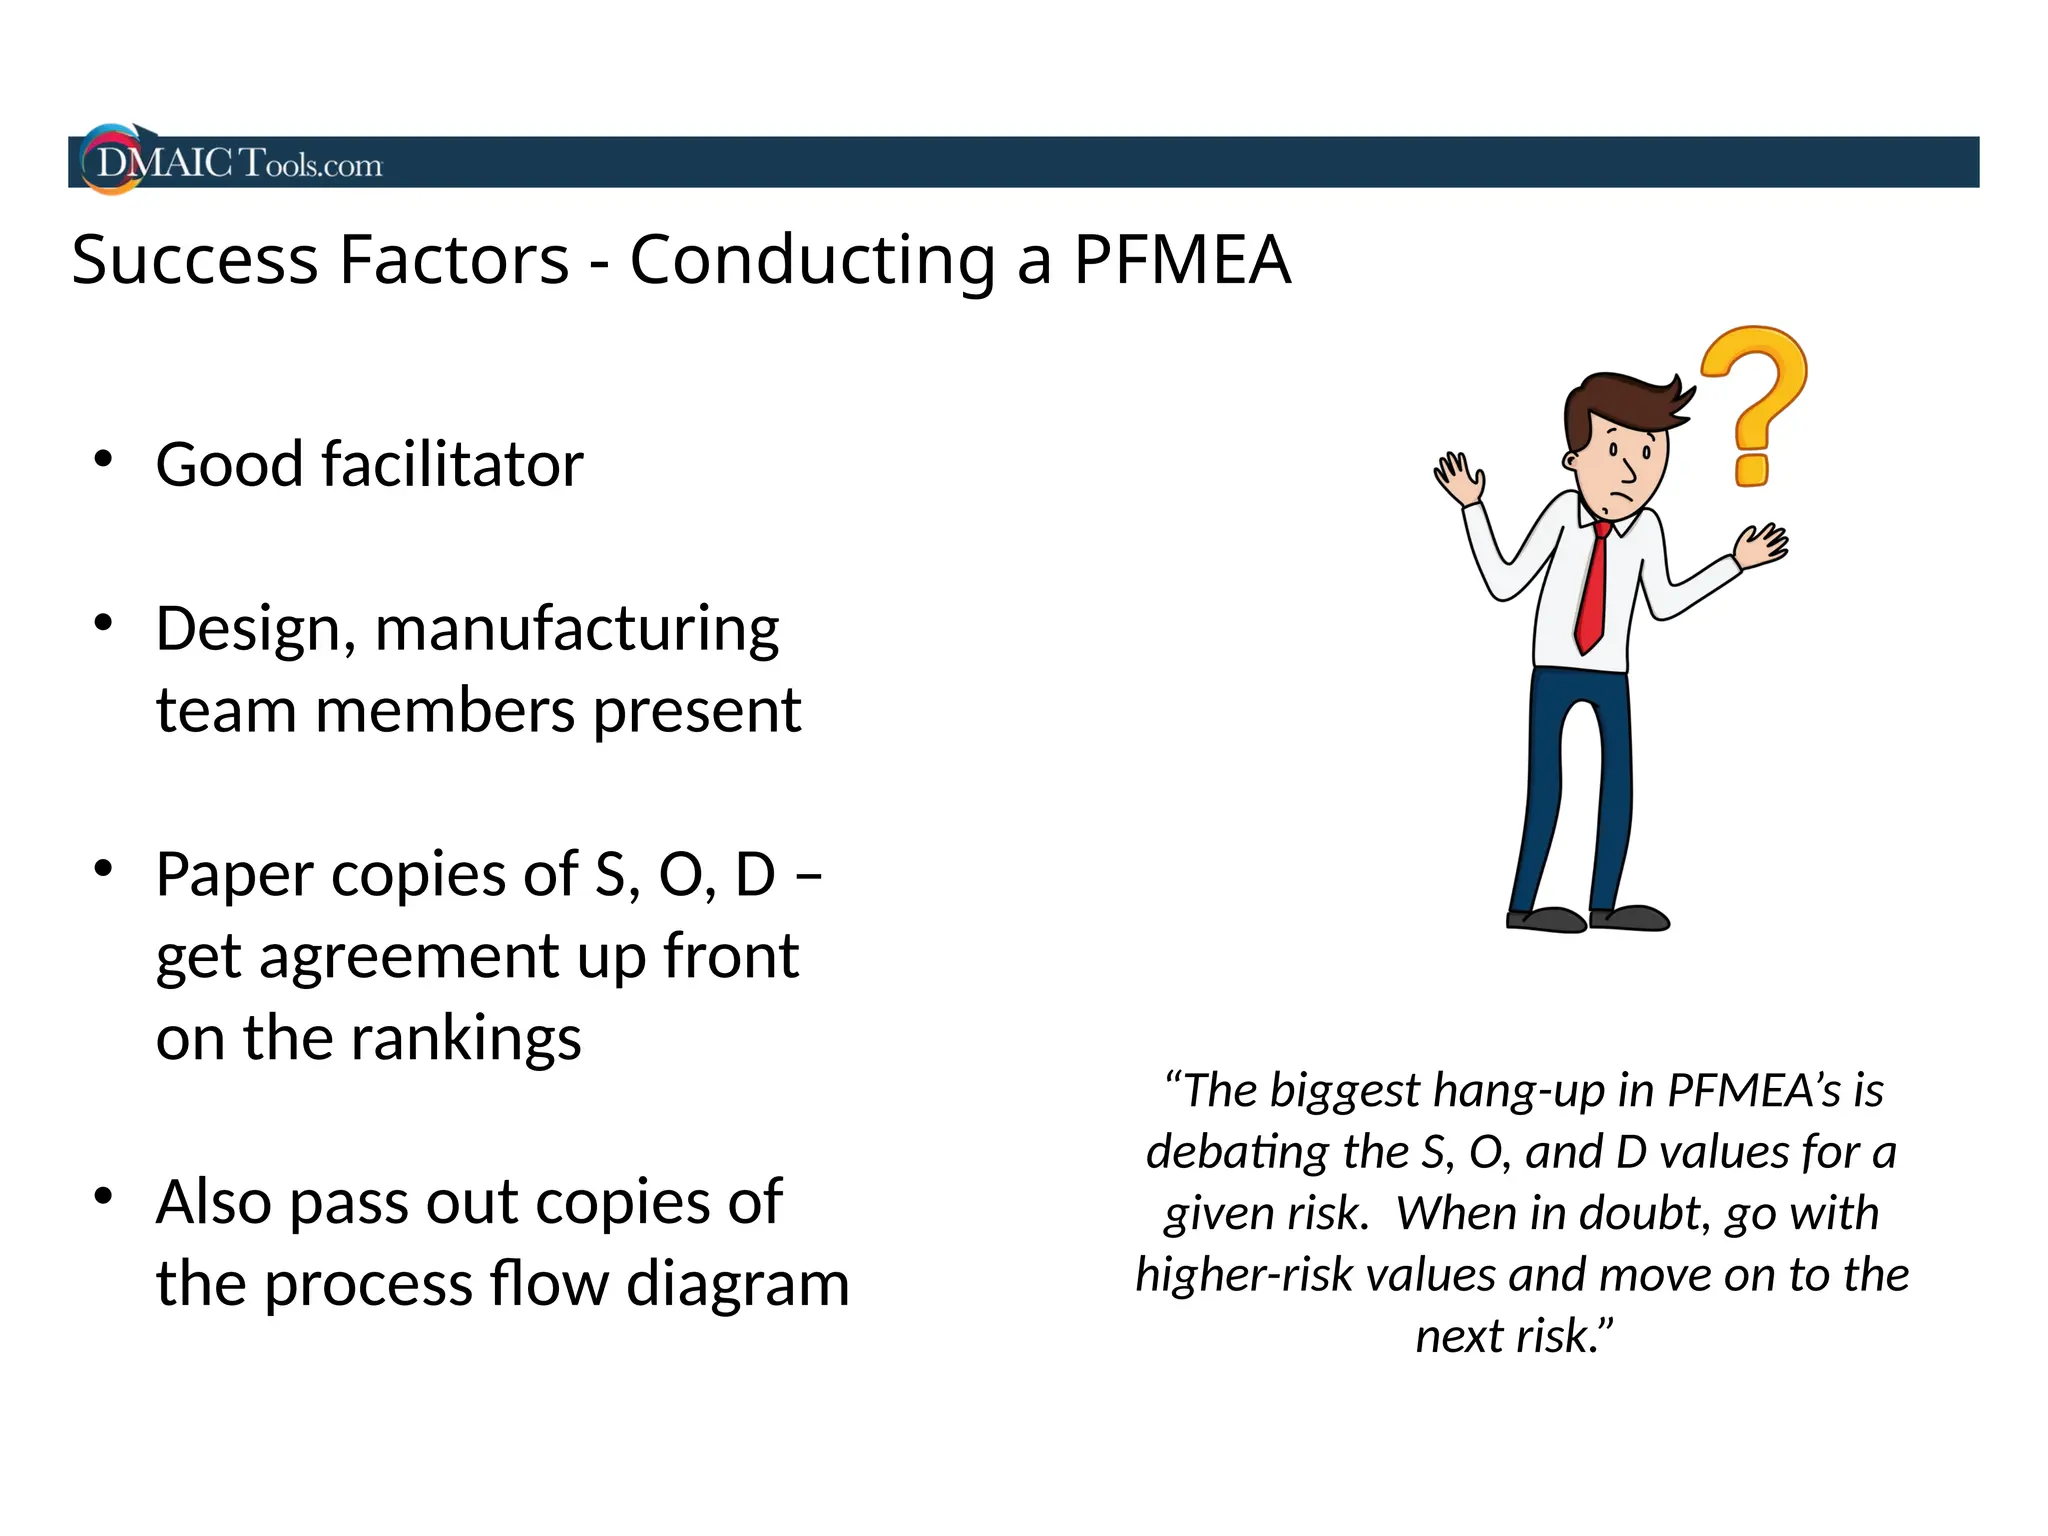
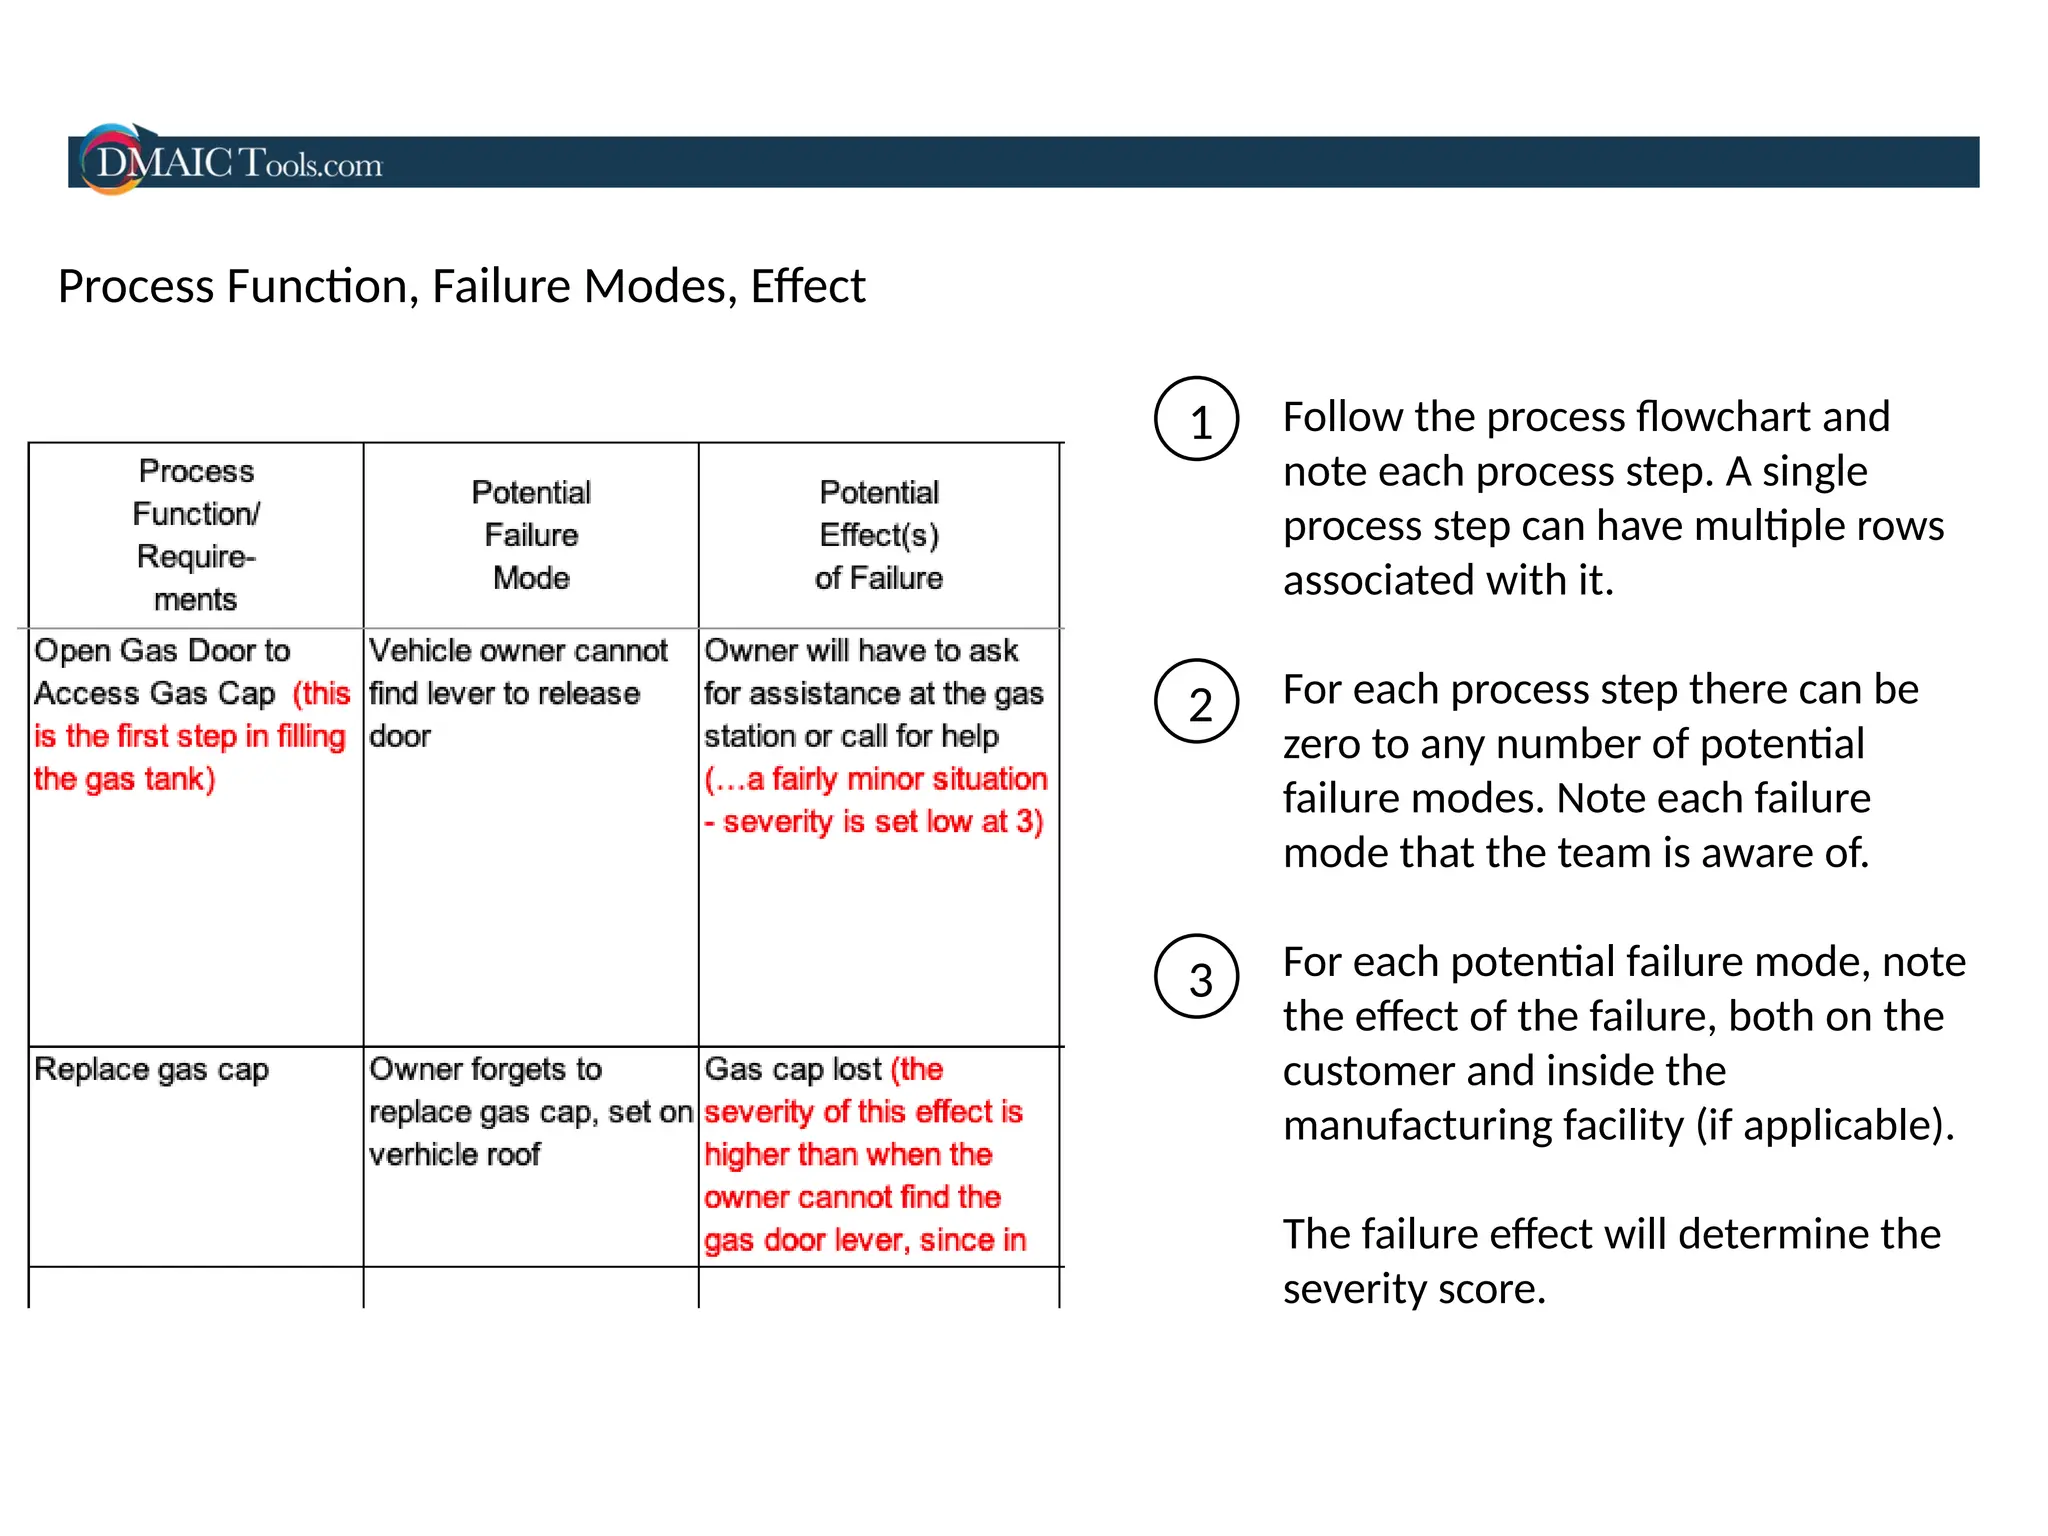
PFMEA Training for Industry
Image Source: Dassault Systems
World class industrial robots, printers,
and machinery
DMAICTools.com
PFMEA
PFMEA analyzes Process risk – any type
of process
We anticipate Failure Modes – how
could the process fail?
What would the Effects of these
failures be, and what action
should we take?
PFMEA is a risk assessment tool that calculates a Risk Priority
Number (RPN) to prioritize risk levels
The Risk Calculation
RPN = Severity x Occurrence x Detection
PFMEA: RPN Value
RPN = S x O x D
SEVERITY
OCCURENCE
DETECTION
SEVERITY OF A GIVEN FAILURE MODE
1 = INSIGNIFICANT 10 = LIFE THREATENING
HOW OFTEN THE FAILURE IS LIKELY TO OCCUR
1 = INSIGNIFICANT 10 = REGULARLY
LIKELIHOOD THAT CURRENT CONTROLS WILL DETECT
1 = GUARANTEED 10 = NO DETECTION
Common Risk Rankings
SEVERITY OCCURENCE DETECTION
RANK
1
3
2
5
4
7
6
8
9
10
None
Hazardous, without
warning
Hazardous, with
warning
Very high
High
Moderate
Low
> 100 per 1,000
Certain
Very low
Minor
Very minor
50 per 1,000
20 per 1,000
10 per 1,000
5 per 1,000
2 per 1,000
1 per 1,000
.5 per 1,000
> .01 per 1,000
.1 per 1,000 Almost certain
High
Moderately High
Moderate
Moderately high
High
Absolutely impossible
Very remote
Remote
High RPN Example
Process Step: Screw the ground wire to the chassis
Potential Failure Mode: Screw not tightened to specified torque
Effect: Shock hazard if screw backs out over time
Loose
Severity: 10 (hazardous without warning)
Occurrence: 7 (10 per 1,000) manual operation
Detection: 6 (low) random audit
RPN = 10 x 7 x 7 = 700: High Risk
High RPN Example – Same Severity, Better Control
Process Step: Screw the ground wire to the chassis
Potential Failure Mode: Screw not tightened to specified torque
Effect: Shock hazard if screw backs out over time
Loose
Severity: 10 (hazardous without warning)
Occurrence: 2 (.1 per 1,000)
- automatic screwdriver with torque control
Detection: 2 (almost certain)
- built-in torque feedback, line will stop if < limit
RPN = 10 x 2 x 2 = 40: Low Risk
Success Factors - Conducting a PFMEA
• Good facilitator
• Design, manufacturing
team members present
• Paper copies of S, O, D –
get agreement up front
on the rankings
• Also pass out copies of
the process flow diagram
“The biggest hang-up in PFMEA’s is
debating the S, O, and D values for a
given risk. When in doubt, go with
higher-risk values and move on to the
next risk.”
Completing the PFMEA Template
Process Function, Failure Modes, Effect
Follow the process flowchart and
note each process step. A single
process step can have multiple rows
associated with it.
For each process step there can be
zero to any number of potential
failure modes. Note each failure
mode that the team is aware of.
For each potential failure mode, note
the effect of the failure, both on the
customer and inside the
manufacturing facility (if applicable).
The failure effect will determine the
severity score.
1
2
3
Severity, Potential Causes, and Occurrence Score
Note the severity of the
effect, using
pre-determined guidelines.
Note the causes of failure,
and the associated
likelihood of occurrence,
also a 1-10 scale using pre-
determined guidelines.
4
Detection Score and RPN Calculation
Assign a detection score on a
1-10 scale, then the
spreadsheet will do the math
and update the Risk Priority
Number (RPN).
If the RPN is too high, discuss
countermeasures.
5
Actions Take and Updated RPN Score
Based on the
recommended actions,
note which actions were
implemented, along with
the updated Severity,
Occurrence, and
Detection values.
6
Wrap-Up – Measuring the Quality of a PFMEA
1. The team has done something about the high RPN’s: countermeasures
and updated RPN values are documented.
2. The steps in the PFMEA are matched up with a detailed process flow
diagram.
3. A control plan exists that mirrors the process controls referenced in the
PFMEA.

PFMEA Industrial Training Presentation.pptx

  • 1.
    PFMEA Training forIndustry Image Source: Dassault Systems World class industrial robots, printers, and machinery DMAICTools.com
  • 2.
    PFMEA PFMEA analyzes Processrisk – any type of process We anticipate Failure Modes – how could the process fail? What would the Effects of these failures be, and what action should we take?
  • 3.
    PFMEA is arisk assessment tool that calculates a Risk Priority Number (RPN) to prioritize risk levels The Risk Calculation RPN = Severity x Occurrence x Detection
  • 4.
    PFMEA: RPN Value RPN= S x O x D SEVERITY OCCURENCE DETECTION SEVERITY OF A GIVEN FAILURE MODE 1 = INSIGNIFICANT 10 = LIFE THREATENING HOW OFTEN THE FAILURE IS LIKELY TO OCCUR 1 = INSIGNIFICANT 10 = REGULARLY LIKELIHOOD THAT CURRENT CONTROLS WILL DETECT 1 = GUARANTEED 10 = NO DETECTION
  • 5.
    Common Risk Rankings SEVERITYOCCURENCE DETECTION RANK 1 3 2 5 4 7 6 8 9 10 None Hazardous, without warning Hazardous, with warning Very high High Moderate Low > 100 per 1,000 Certain Very low Minor Very minor 50 per 1,000 20 per 1,000 10 per 1,000 5 per 1,000 2 per 1,000 1 per 1,000 .5 per 1,000 > .01 per 1,000 .1 per 1,000 Almost certain High Moderately High Moderate Moderately high High Absolutely impossible Very remote Remote
  • 6.
    High RPN Example ProcessStep: Screw the ground wire to the chassis Potential Failure Mode: Screw not tightened to specified torque Effect: Shock hazard if screw backs out over time Loose Severity: 10 (hazardous without warning) Occurrence: 7 (10 per 1,000) manual operation Detection: 6 (low) random audit RPN = 10 x 7 x 7 = 700: High Risk
  • 7.
    High RPN Example– Same Severity, Better Control Process Step: Screw the ground wire to the chassis Potential Failure Mode: Screw not tightened to specified torque Effect: Shock hazard if screw backs out over time Loose Severity: 10 (hazardous without warning) Occurrence: 2 (.1 per 1,000) - automatic screwdriver with torque control Detection: 2 (almost certain) - built-in torque feedback, line will stop if < limit RPN = 10 x 2 x 2 = 40: Low Risk
  • 8.
    Success Factors -Conducting a PFMEA • Good facilitator • Design, manufacturing team members present • Paper copies of S, O, D – get agreement up front on the rankings • Also pass out copies of the process flow diagram “The biggest hang-up in PFMEA’s is debating the S, O, and D values for a given risk. When in doubt, go with higher-risk values and move on to the next risk.”
  • 9.
  • 10.
    Process Function, FailureModes, Effect Follow the process flowchart and note each process step. A single process step can have multiple rows associated with it. For each process step there can be zero to any number of potential failure modes. Note each failure mode that the team is aware of. For each potential failure mode, note the effect of the failure, both on the customer and inside the manufacturing facility (if applicable). The failure effect will determine the severity score. 1 2 3
  • 11.
    Severity, Potential Causes,and Occurrence Score Note the severity of the effect, using pre-determined guidelines. Note the causes of failure, and the associated likelihood of occurrence, also a 1-10 scale using pre- determined guidelines. 4
  • 12.
    Detection Score andRPN Calculation Assign a detection score on a 1-10 scale, then the spreadsheet will do the math and update the Risk Priority Number (RPN). If the RPN is too high, discuss countermeasures. 5
  • 13.
    Actions Take andUpdated RPN Score Based on the recommended actions, note which actions were implemented, along with the updated Severity, Occurrence, and Detection values. 6
  • 14.
    Wrap-Up – Measuringthe Quality of a PFMEA 1. The team has done something about the high RPN’s: countermeasures and updated RPN values are documented. 2. The steps in the PFMEA are matched up with a detailed process flow diagram. 3. A control plan exists that mirrors the process controls referenced in the PFMEA.