SlideShare a Scribd company logo
~ ) Pergamon J o u n t a l q f l n t e r n a t i o n a l Monca' a n
d Finance Vol. 16. No. 6, pp. 865 878, 1997 © 19t~7 Elsevier
Science Ltd. All rights rcservcd
Printed in G r e a t Britain
P I I : S0261-5606(97)00032-6 0 2 6 1 - 5 6 0 6 / 9 7 $17.00 +
0.00
Burgernomics: the economics of the Big
Mac standard*
L I L I A N O N G +
Department of Accounting and Finance, The University of
Western
Australia, Nedlands, WA 6907, Australia
In the course of PPP research, much o f the debate over the
validity has
been over the choice o f an a p p r o p r i a t e ' b a s k e t ' for
making purchasing
power comparisons. The different compositions of goods and
services in
these baskets across countries have resulted in arguments
against their
usefulness for PPP purposes. This problem is a u g m e n t e d
by the existence
o f productivity differentials in t r a d e d and non-traded
goods across coun-
tries. T h e r e f o r e we consider the use o f the Big Mac as
the international
monetary s t a n d a r d as being a more palatable alternative: It
is p r o d u c e d
locally in over 80 countries a r o u n d the world, with only
minor changes in
recipe and thus has the flavour of ' t h e perfect universal
commodity'. O u r
results indicate that the Big Mac Index is surprisingly accurate
in tracking
exchange rates over the long-term, which is consistent with
previous PPP
research findings. W e subsequently enhance our PPP
comparisons by
taking into account the productivity differentials between
countries and
excluding n o n - t r a d e d goods from the Big Mac Index to
derive the No-Frills
Index. ( J E L F31). © 1997 Elsevier Science Ltd. All rights
reserved.
'Suppose a man climbs five f e e t up a sea wall, then climbs
down 12 feet.
Whether he drowns o r not depends u p o n how high above
sea-level he was
when he started. T h e same p r o b l e m arises in deciding
whether currencies
are under- or o v e r - v a l u e d . . . ' The Economist, 26
August 1995 (p. 70)
The purchasing power parity (PPP) doctrine is perhaps o n e o f
the oldest and
most widely researched areas in international finance. The
origins o f PPP
theory can be traced back to Spanish scholars o f the sixteenth
century,
although the intellectual origins o f the doctrine are credited to
Wheatley's and
*This p a p e r is a revised version o f a section o f my PhD
thesis at the University o f W e s t e r n
Australia, jointly supervised by Professor H. Y. Izan and
Professor K. W. Clements. I ' d also
like to thank G e o f f Kingston, P e t e r Forsyth, M a r d i
Dungey, James R. Lothian, the
participants at the 1995 PhD Conference in Economics and
Business and an anonymous
referee for their helpful comments; and the Australian Agency
for I n t e r n a t i o n a l D e v e l o p -
ment ( A u s A I D ) , and the D e p a r t m e n t of Accounting
and Finance, The University o f
Western Australia for their financial support. All remaining
errors in this p a p e r are mine.
*Corresponding author. Tel.: + 6 1 08 93803625; fax: +61 08
93801047; e-mail:
[email protected]
865
Burgemomics: the economics of the Big Mac standard: Li Lian
Ong
Ricardo's w o r k in the n i n e t e e n t h century. ~ PPP t h e o
r y as we know it today,
however, is attributed to Gustav Cassel's writings during the
1920s. This
interest has intensified over the last two decades with t h e
collapse o f t h e
B r e t t o n W o o d s system and the reintroduction o f
flexible exchange rates in t h e
early 1970s. 2 T h e controversial findings during this time
have resulted in some
researchers rejecting the merits of PPP in explaining exchange
rate move-
ments, while others c o n t e n d that PPP does i n d e e d
provide a strong basis for
exchange rate determination, with useful policy implications.
In t h e course o f PPP research, m u c h o f the debate over
its validity has b e e n
over t h e choice o f an appropriate 'basket' for making PPP
comparisons. T h e
different compositions of goods and services in these baskets
across countries
and the extent to which these items affect the exchange rates
have resulted in
arguments against their usefulness for PPP purposes. F r o o t
and R o g o f f (1994)
observe that most empirical tests do not a t t e m p t to c o m p
a r e identical baskets,
but instead use different countries' c o n s u m e r and
wholesale price indices
which consist o f different weights and mixes o f goods across
countries. This
m e a n s that even if PPP holds, it m a y not necessarily show
up in the results
unless the two countries in question have identical baskets.
Similarly, B e t t o n e t
al. (1995) argue that w h e n consumption bundles are not
identical, price indices
based on local consumption patterns m a y behave differently
even though the
law o f one price holds for each commodity, resulting in biased
outcomes o f
PPP tests. 3
A n o t h e r major limitation in PPP research has b e e n t h e
productivity bias
hypothesis (PBH), which is probably considered the most
serious criticism o f
the absolute PPP t h e o r y today. This hypothesis, first
introduced by H a r r o d
(1939) and subsequently formalised by Balassa (1964) and
Samuelson (1964), is
based on the premise that productivity growth in the tradeable
goods sector is
faster t h a n that in the non-tradeable goods sector. 4 T h e
result is that if t h e real
exchange rate b e t w e e n two countries is c o m p u t e d
using price deflators that
include both tradeable and non-tradeable goods, t h e n the
currency o f t h e
country with faster productivity growth in the t r a d e d sector
than in the
n o n - t r a d e d sector will be systematically overvalued
relative to its PPP level. 5
T h e U n i t e d Nations International Comparisons Project
(ICP) m e t h o d o f
accounting for PPP, which has received wide attention recently,
is also based
on the premise o f productivity differentials b e t w e e n
countries. 6 According to
Kravis (1986), this system o f international income and
purchasing p o w e r
comparisons improves t h e m e a s u r e m e n t o f countries'
average incomes and t h e
differences b e t w e e n them. Moreover, the ICP m e t h o d
also enables t h e compar-
ison o f price levels b e t w e e n countries and n o t just the
relative changes in
t h e m ] Using t h e ICP data, O h (1996) finds that PPP holds
in the long-run f o r
G-6 and O E C D countries u n d e r flexible exchange rates.
Given t h e prevailing index-number and productivity bias
problems, we have
d e c i d e d to use the Big Mac as the international m o n e t a r
y standard in this test
o f PPP, in place o f the traditional basket o f goods and
services. O u r decision is
based on the Big Mac being 'the perfect universal commodity'. 8
F u r t h e r m o r e ,
since t h e Big Mac comprises both t r a d e d and n o n - t r a
d e d goods, we are able to
incorporate the productivity bias concept into o u r research.
Pakko and Pollard
866
Burgernomics: the economics o f the Big Mac standard: Li Lian
Ong
(1996) provide an i n d e p e n d e n t analysis o f Big M a c
PPP. In that paper, the
authors investigate t h e p e r f o r m a n c e o f absolute and
relative Big M a c PPP.
T h e y also provide a discussion on why PPP fails. While we
also p e r f o r m tests o f
absolute and relative PPP similar to Pakko and Pollard's, we
extend the
analysis by (i) examining the productivity bias problem in g r e
a t e r detail using
the Big M a c h a m b u r g e r ; and (ii) improving on the Big
Mac Index by introduc-
ing the No-Frills Index, which takes into account the
productivity differentials
b e t w e e n countries.
T h e data used in this study consist of the prices o f M c D o n
a l d ' s Big M a c
hamburgers in 34 countries and the corresponding exchange
rates over t h e
1986-1994 period. These are published annually in The
Economist magazine.
O u r results indicate that the Big Mac Index performs just as
well as, if n o t
b e t t e r than, most indices used in tests of PPP. Like Pakko
and Pollard (1996),
we find that the Index is surprisingly accurate in tracking
exchange rates over
the long-term (i.e. t h e 9 years o f o u r sample period) which
is consistent with
previous PPP research findings. Even though individual
currencies m a y deviate
f r o m Big M a c PPP on a country-by-country basis, there is a
distinct t e n d e n c y
for deviations to offset o n e a n o t h e r so that the world
currencies, in aggregate,
are at parity for any 1 particular year. Moreover, geographic
influences a p p e a r
to play an important role in currency valuation. We show that
PPP compar-
isons can be e n h a n c e d by taking into account the
productivity differentials
b e t w e e n countries and excluding n o n - t r a d e d goods
from the Big Mac Index to
derive the No-Frills Index.
This p a p e r is organised as follows. Section I examines t h e
valuation o f
currencies relative to their Big Mac PPP. This is followed by f u
r t h e r tests o f
PPP using regression analysis in Section II. In Sections III and
IV, the Big Mac
is d e c o m p o s e d into its t r a d e d and n o n - t r a d e d c
o m p o n e n t s in o r d e r to e n h a n c e
PPP comparisons. W e conclude with a s u m m a r y o f o u r
findings in Section V.
I. T h e v a l u a t i o n o f c u r r e n c i e s
In this section, we investigate the valuation of currencies
relative to their Big
Mac PPP. Let Pc, be t h e domestic currency price o f a Big
Mac in c o u n t r y c in
y e a r t; P,* be the price in US dollars o f a Big Mac in the
US; and Sct be the
spot exchange rate, defined as the domestic currency cost o f
US$1. Accord-
ingly, P, JPt* is the Big M a c PPP. Expressed in logarithmic
form, we have
(1) log Pct/Pt* Pet rct==- ( Set ) = log~-t. - log Sct,
such that a currency is said to be overvalued if rot is g r e a t e r
t h a n zero,
undervalued if r,., is less than zero and at parity if r , equals
zero. T h e
p e r c e n t a g e deviation f r o m parity is approximately rct
X 100. Figure 1 shows the
country averages o f t h e o v e r / u n d e r - v a l u a t i o n s ,
rc., w h e r e t h e 'o' notation
indicates averages over time. Broadly speaking, it appears that t
h e high-growth,
developing economies in the A S E A N - O c e a n i a and E a s
t e r n E u r o p e a n regions
are generally u n d e r v a l u e d against the US, while the
currencies o f d e v e l o p e d
867
Burgernomics: the economics o f the Big Mac standard: Li Lian
Ong
rt. x 100
60
40
> 20 ©
-20
-40 >
60
-80
i l t I L l l i i i O i l l l O i O i O l O i O i O i l l i O i l l i O i O
i ~ i i i i i i ,
I I I
n
o,o
Grand Average
O , , ,, ,, ,, I
I
The Americas Western and Central Europe Eastern Europe East
Asia ASEAN-
Oceania
FIGURE 1. Over/under-valuation of currencies: regional groups,
1986-1994 averages.
r., x 100
35
30
25
o=
"~ 20
i ,5
o
10
0 .=
"~ -5
.g
-10
Grand Average
] ] ~ ' I I ' [ ] . . . . . [
1986 1987 119881 1989 1990 1991 1992 1993 1994
I I
FIGURE 2. Over/under-valuation of currencies: annual cross-
country averages, 1986-1994.
countries in Western and Central Europe, along with t h o s e o
f the highly
industrialised East A s i a n countries o f Taiwan, Japan and S
o u t h Korea, are
overvalued. 9 Figure 2 plots the annual averages o f the
deviations from parity
across countries, to,, where the ' . ' n o t a t i o n indicates
averages across countries.
A s can be seen, the U S dollar appears overvalued in 1988 and
1994, a l th o u g h
n o t by much in the latter year. The dollar appears undervalued
in all o t h e r
ye ars. 10
868
Burgernomics: the economics of the Big Mac standard." Li Lian
Ong
II. F u r t h e r tests o f Big M a c P P P
In Section I, we look at the valuation o f currencies relative to
their Big Mac
PPP and find that geographic influences play an important role
in currency
valuation. Furthermore, it appears that the U S dollar is
generally at parity on a
year-by-year basis. Using both time-series and averaged data,
we now conduct
regression-based tests to corroborate our results. Consider the
following rela-
tionship between the actual exchange rate in country c and year
t (Set) and the
corresponding price ratio Pet -= P c t / P t * :
( 2 ) log S a = o~ + / 3 log p ~ ,
where the PPP hypothesis implies a zero intercept term and a
unit slope
coefficient (o~= 0, / 3 = 1). The regression results are
presented in Table 1. II
Overall, Eq. ( 2 ) appears to model short-term PPP very well.
12 We subse-
TABLE 1. Regression results: exchange rates and prices
(standard errors in parentheses)
Year PPP M o d e l N u m b e r o f Intercept Slope A d j u s t
e d S.E.
observations R 2
I. Cross-country
1986 A b s o l u t e 14 0.124 (0.118) 0.915 (0.046) 0.968 0.318
1985/1986 Relative . . . . . . .
1987 A b s o l u t e 8 - 0 . 2 2 5 (0.087) 0.953 (0.026) 0.995
0.183
1986/1987 Relative 7 - 0 . 0 5 2 (0.012) 0.167 (0.080) 0.358
0.031
1988 A b s o l u t e 16 0.180 (0.116) 0.958 (0.035) 0.980 0.353
1987/1988 Relative 7 - 0 . 3 7 6 (0.207) - 0 . 6 5 3 (0.557)
0.058 0.044
1989 A b s o l u t e 17 - 0 . 0 1 0 (0.145) 0.991 (0.037) 0.978
0.427
1988/1989 Relative 16 - 0 . 2 6 3 (0.033) 1.635 (0.088) 0.958
0.093
1990 A b s o l u t e 18 - 0 . 0 1 4 (0.135) 0.953 (0.041) 0.969
0.422
1989/1990 Relative 17 0.002 (0.033) 1.075 (0.022) 0.993 0.132
1991 A b s o l u t e 19 - 0 . 0 6 3 (0.128) 0.964 (0.039) 0.972
0.388
1990/1991 Relative 18 - 0 . 0 4 8 (0.033) 0.879 (0.115) 0.771
0.127
1992 A b s o l u t e 22 - 0 . 0 7 3 (0.154) 0.990 (0.042) 0.964
0.485
1991/1992 Relative 18 - 0 . 1 9 1 (0.083) 2.155 (0.184) 0.889
0.317
1993 A b s o l u t e 24 - 0 . 0 4 8 (0.112) 0.987 (0.029) 0.981
0.392
1992/1993 Relative 20 0.036 (0.026) 0.798 (0.030) 0.974 0.112
1994 A b s o l u t e 31 - 0 . 0 2 8 (0.103) 1.010 (0.025) 0.982
0.360
1993/1994 Relative 23 0.053 (0.022) 0.850 (0.025) 0.981 0.103
II. C r o s s - c o u n t r y / t i m e - s e r i e s
1986-1994 A b s o l u t e 169 - 0 . 0 1 7 (0.042) 0.981 (0.012)
0.977 0.388
Relative 126 0.002 (0.024) 1.000 (0.031) 0.896 0.272
III. Average over time
1986-1994 A b s o l u t e 34 - 0 . 0 1 8 (0.094) 1.001 (0.024)
0.982 0.347
Relative 26 0.003 (0.014) 1.127 (0.032) 0.980 0.073
869
Burgernomics: the economics o f the Big Mac standard: Li Lian
Ong
quently run the regression using country data averaged over
time, such that log
So° = o~ + / 3 log Pc.. T h e results suggest that P P P holds
as a long-run proposi-
tion. ~3
Previously, we e m p l o y e d P P P in terms of levels which is
also known as
absolute P P P . W e now e m p l o y the relative version of P
P P which is in first
differences, i.e. Alog Set = a ' + / 3 'Alog Pc,, w h e r e Pc~ =
P ~ J P * , as before. The
use o f first differences accounts for the proven I(1) p r o p e r
t y o f exchange
rates. ~4 As with the absolute P P P regressions, we estimate
the relative P P P
m o d e l for each year's d a t a as well as for the p o o l e d
data. W e also consider the
use o f averaged data. ~ O u r results from using p o o l e d
data s u p p o r t the use o f
Big M a c prices for making P P P comparisons. Thus, o u r
findings once again
show that Big M a c P P P holds over the long-term.
O u r findings to this point indicate that Big M a c P P P
generally holds for o u r
sample countries, b o t h on a year-by-year basis and averaged
over 9 years.
However, these results are not without exception. In certain
cases, exchange
rates have b e e n f o u n d to deviate significantly from parity.
W e will now briefly
discuss the different possibilities as to h o w these deviations
could o c c u r in the
context of o u r research.
P P P theory assumes that there are no barriers to trade. It has
long b e e n
recognised that such barriers prevent arbitrage from taking
place and lead to
d e p a r t u r e s from parity. 16 In the case of a Big Mac, for
instance, the cost o f
i m p o r t e d b e e f in J a p a n (which accounts for nearly
80% o f the ingredients in a
Big Mac) includes a 50% tariff. 17 Big Mac prices could also b
e distorted by
high taxes in countries such as D e n m a r k and Sweden and
inflated p r o p e r t y
costs in H o n g Kong, J a p a n and Singapore, which could
exaggerate the degree
o f d e p a r t u r e f r o m parity for these currencies. It has
also o f t e n b e e n held that
the failure o f the law o f one price is due, in large part, to
systematic attempts
by firms operating in international markets to stabilise
destination m a r k e t
prices, when nominal exchange rates change, in o r d e r to p r
o t e c t m a r k e t
share. ~s A n o t h e r reason for observed d e p a r t u r e s
from Big M a c P P P is the
'status symbol' argument, which suggests that in certain
countries, fast-food
chains in general (and the M c D o n a l d ' s franchise in
particular) are rarities and
are thus able to c o m m a n d a m o n o p o l y p r e m i u m
over o t h e r commodities. This
is n o t the case in the U S w h e r e intense competition from
o t h e r fast-food
chains w o u l d serve to k e e p margins slim. A further i m p
o r t a n t reason for
deviations from P P P is the existence o f productivity
differences b e t w e e n
countries, m e n t i o n e d earlier. This will b e investigated in
the next two sections.
III. Is the Big M a c all tradeable?
H a r r o d (1939) argues that P P P holds true for t r a d e d
goods ( T ) only, as the
prices o f these goods are purcly thc effect of exchange rate
movements.
Accordingly, these prices should not vary outside the limits sct
by transporta-
tion costs and tariffs. T h e r e f o r e P P P should no longer
hold o n c c n o n - t r a d e d
goods ( N ) are taken into account, sincc they are not expected
to have the same
prices in different countries except u n d e r spccial
circumstances. Balassa (1964)
subsequently formalises H a r r o d ' s exposition by looking at
deviations f r o m P P P
870
Bu~ernomics: the economics of the Big Mac standard: Li Lian
Ong
in the context o f productivity biases. H e finds that m a r k e d
productivity differ-
entials in T b e t w e e n 'rich' and ' p o o r ' countries, along
with wage equalisation
within each economy, cause the prices o f T in terms of N to b
e c h e a p e r in the
richer economies. W e will use this a p p r o a c h as a basis
for slicing the Big M a c
into its T and N components.
Clements and Frenkel (1980) take the price level to b e a linear
h o m o g e n e o u s
( C o b b - D o u g l a s ) function of the prices of n o n - t r a d
e d goods, P!v, and t r a d e d
goods, PT, with weight ~ given to N:
( 3 ) e - ". 1 - . - P , ~ PT ,
w h e r e 0 < ce < 1 Thus, if P P P applies to T only, then S =
P r / P ~ and it follows
that
(45 P r = S . P ~ .
By rewriting Eq. ( 3 ) for the foreign country and rearranging b
o t h versions o f
the equation, we are then able to substitute P r and P.~ in Eq.
(4) to obtain
( 5 ) S = ( P r / P N ) " . P---
( p . ~ / p ~ ) " " p * •
Looking at Eq. ( 5 ) , we can see that the ( P T / P N ) a t e r m
b e c o m e s smaller, on
the basis o f a simple P P P calculation, as T b e c o m e s
relatively c h e a p e r to N in
the rich country, as explained by the P B H . In o t h e r words,
since N e n t e r into
the calculation o f PPP, via the overall price level, b u t do not
directly affect
exchange rates, the currency of the richer country will a p p e a
r to b e 'overval-
ued'.
C o n s i d e r also the Clements and S e m u d r a m (1983)
relationship b e t w e e n
relative prices and G D P p e r capita: 1~
( 6 ) log ~ = A + 0 5 1 o g G D P .
W e rewrite Eq. ( 6 ) for the foreign e c o n o m y and
substitute b o t h versions o f the
equation into the logarithmic form o f Eq. ( 5 ) to obtain
( 7 ) log S = 3 , + / 3 log G D P - / 3 * log G D P * + log ~ ,
w h e r e 3/= c~A - c~*A*, /3 = c~05 and /3* = a'05".
Assuming for expository pur-
p o s e s that ~ = ~* and 05= 05*, /3 would then b e equal to
/3*. W e also
i n c o r p o r a t e the definition in Eq. ( 1 ) so that Eq. ( 7 ) b
e c o m e s
, ( G D P ~
( 8 ) r = y ' + / 3 l o g i c ) ,
w h e r e 7 ' = - ~ and /3' = - / 3 . 2o As the coefficient /3 =
o~05, with 0 < a < 1 and
05 < 0, we expect 13 < 0 and /3' > 0. The estimates of Eq. ( 8 )
are given in Table
2 . 21
The estimate o f /3' in Table 2 indicates that, on average, a 10%
growth in
G D P causes a 2 % appreciation o f the currency in real
terms. Recall that o n e
of the structural p a r a m e t e r s o f this m o d e l is o~, the
share o f non-tradeables in
871
Burgemomics: the economics o f the Big Mac standard." Li
Lian Ong
TABLE 2. Regression results: currency valuation and G D P c r
o s s - c o u n t r y / t i m e - s e r i e s ,
1986-1994 (standard errors in parentheses)
, [ G D P
I n t e r c e p t coefficient y '
Coefficient of relative G D P / 3 '
A d j u s t e d R 2
S t a n d a r d error of estimate
0.259 (0.026)
0.240 (0.023)
0.415
0.266
total costs. As the coefficient /3' = - a4,, we can obtain an
estimate o f a given
estimates o f /3' and ~b. We use the Clements a n d S e m u d r
a m (1983) estimate
(h = - 0.256 to derive ~ = 0.937. Thus, the n o n - t r a d e d c o
m p o n e n t in a Big Mac
accounts for approximately 94% o f its price. This figure
appears reasonable
given the p r o m i n e n c e o f wages, rent, o t h e r
overheads, etc. in the cost o f a Big
Mac.
IV. Improving the Big Mac Index: the No-Frills Index
As previously discussed, PPP t h e o r y needs to bc extended
to take account o f
n o n - t r a d e d goods. O u r calculations in t h e previous
section indicate that, on
average, non-tradcablcs account for approximately 94% o f the
h a m b u r g e r
prices. Since these goods play only a very small part in
determining exchange
rates, they should be excluded in a m o r e sophisticated PPP
calculation. We
pursue this idea in this section by introducing the No-Frills
Index (NFI) in
which the non-tradeables arc excluded from t h e Big M a c
Index (BMI).
We rewrite Eq. (4) in logarithmic form to r e p r e s e n t t h e
PPP condition:
(9) log S = log PT -- log P~
= f ( l o g P , log GDP) - f * (log P * , log GDP*)
g ( l o g ~ - . , ' G D P , =
In the above, the second line reflects Eqs. (3) a n d ( 6 ) and
their foreign-coun-
try counterparts. The third line invokes (i) a h o m o g e n e i t y
assumption that
prices at h o m e relative to those abroad affect the exchange
rate; and (ii) an
assumption that the relevant p a r a m e t e r values are
identical in the two coun-
tries (o~ = a * and ~h = ~b*, in the notation o f Section III).
Once we have an estimate o f the p a r a m e t e r s o f t h e
function g (-, .) in Eq.
(9), we can estimate the NFI as log S = ~ (log P/P*, log
GDP/GDP*). It can
be shown that the N F I is c o m p u t e d as log S -- log S - k,
w h e r e S is the actual
exchange rate and k is the residual from regression (8). 22 A n o
t h e r way o f
visualising the N F I is that it incorporates the systematic
relationship b e t w e e n
departures from parity according to t h e B M I and GDP; this
relationship is t h e
productivity bias Eq. (8). F o r illustration purposes, Table 3
presents t h e N F I
872
Burgernomics: the economics o f the Big Mac standard: Li Lian
Ong
TABLE 3. A c t u a l e x c h a n g e r a t e s , t h e Big M a c
I n d e x a n d t h e N o - F r i l l s I n d e x
C o u n t r y
L o g a r i t h m i c
A c t u a l
e x c h a n g e r a t e
(1)
L o g a r i t h m i c d i f f e r e n c e s x 100
Big M a c N o - F r i l l s A c t u a l E R - A c t u a l E R -
B M I -
I n d e x I n d e x B M I N F I N F I
(2) (3) (4) = (1) - (2) (5) = (1) - (3) (6) = (2) - (3)
1994
A r g e n t i n a 0.00 0.45 0.47 - 4 5 . 1 1 - 4 7 . 3 0 - 2 . 2 0
A u s t r a l i a 0.35 0.07 - 0.09 28.30 44.18 15.88
A u s t r i a 2.48 2.69 2.47 - 20.97 1.96 22.94
B r i t a i n - 0.38 - 0.24 - 0.39 - 13.94 0.81 14.75
C a n a d a 0.33 0.22 0.04 11.42 28.47 17.05
C h i l e 6.03 6.02 6.23 0.48 - 20.38 - 20.87
C h i n a 2.16 1.36 2.10 79.98 6.16 - 7 3 . 8 2
D e n m a r k 1.90 2.42 2.16 - 5 1 . 5 3 - 2 5 . 5 2 26.01
F r a n c e 1.76 2.08 1.87 - 32.14 - 10.89 21.25
G e r m a n y 0.54 0.69 0.49 - 15.67 5.03 20.69
G r e e c e 5.53 5.60 5.60 - 7.30 - 7.75 - 0.45
H o l l a n d 0.65 0.86 0.66 - 21.58 - 1.66 19.92
H u n g a r y 4.63 4.30 4.49 33.77 14.93 - 18.85
I t a l y 7.40 7.59 7.43 - 18.68 - 2.82 15.86
J a p a n 4.64 5.14 4.80 - 49.14 - 15.88 33.26
M a l a y s i a 0.99 0.49 0.72 49.48 26.79 - 22.70
M e x i c o 1.21 1.26 1.45 - 4 . 6 5 - 2 3 . 7 6 - 19.11
P o l a n d 10.02 9.51 9.82 50.95 19.48 - 31.47
P o r t u g a l 5.16 5.25 5.28 - 9.32 - 12.27 - 2.95
R u s s i a 7.48 7.14 7.47 34.19 1.64 - 32.54
S i n g a p o r e 0.45 0.26 0.04 18.87 41.20 22.33
S o u t h K o r e a 6.70 6.91 6.92 - 21.07 - 22.53 - 1.46
S p a i n 4.93 5.01 4.94 - 8.34 - 1.62 6.72
S w e d e n 2.08 2.41 2.20 - 33.13 - 12.01 21.12
S w i t z e r l a n d 0.36 0.91 0.58 - 54.36 - 21.88 32.48
T h a i l a n d 3.23 3.04 3.36 19.25 - 12.58 - 31.83
M e a n - 3.09 - 1.85 1.23
S t a n d a r d e r r o r o f m e a n 6.76 4.21 5.08
t - s t a t i s t i c - 0.46 - 0.44 0.24
for 1994, as well as the test statistics for that year. N o t e that
for China, one o f
the poorest countries in the sample, the deviation o f the BMI
from the actual
exchange rate is approx. 80%; when the NFI is used, the
deviation falls to
approx. 6%.
We find that, on average, the excess o f the BMI over its No-
Frills counter-
part is approx. 10%, over the 1986-1994 period. 23 In other
words, the BMI
undervalues currencies by 10%, on average. Consequently, if
The Economist
magazine wishes to make some rough adjustments to its BMI to
allow for
productivity bias, a simple approach would be to add 10% to its
estimates o f
currency values, especially for the poorer countries.
873
Burgernomics: the economics o f the Big Mac standard: Li Lian
Ong
V. Summary and conclusion
The Economist magazine is considered the most influential and
prestigious
financial n e w s p a p e r in the world. In view o f its well-
known breezy style which
has b e e n described as 'simplify and then exaggerate', one
suspects that w h e n
the editor first i n t r o d u c e d the Big Mac Index in 1986, it
was a s o m e w h a t
tongue-in-cheek contribution to what is perhaps the m o s t
widely-researched
and d e b a t e d doctrine in international finance. M a n y
years later, the Big M a c
Index is still going strong and is now widely cited and u s e d
by academics and
practitioners alike. Given the competitive nature o f publishing,
one would
assume that the survival o f the index would have to be b a s e
d on s o m e intrinsic
merit and usefulness o f the m e a s u r e in judging the long-
term value o f curren-
cies.
O u r test results d e m o n s t r a t e that the Big M a c Index
is surprisingly accurate
in tracking exchange rates o v e r the longer-term, which is
consistent with
previous findings. The regression tests indicate that purchasing
p o w e r parity
holds with the Big M a c Index over a 9-year horizon. H o w e
v e r , this is n o t to say
that the currencies o f all individual countries for all years are
at parity.
G e o g r a p h i c influences a p p e a r to play a part in those
instances w h e r e devia-
tions from parity occur. F o r example, the currencies o f
developing Asian and
East E u r o p e a n countries are consistently undervalued,
while the currencies o f
the industrialised e c o n o m i e s are overvalued, on average.
The versatility o f the Big M a c Index notwithstanding, we are
still able to
improve on it by taking into account the existence o f
productivity bias b e t w e e n
countries. As it is well known, services are relatively c h e a p e
r in p o o r e r
countries and because these goods have little, if any, role in
determining
exchange rates, standard P P P calculations which include
services tend to show
that the currencies o f these countries are systematically
undervalued. In o t h e r
words, these deviations from parity are related to income. W e
confirm the
existence o f this productivity bias in the Big Mac Index and
subsequently
introduce the new No-Frills Index to solve the problem. T h e n
e w index
excludes the n o n - t r a d e d c o m p o n e n t o f Big Mac h
a m b u r g e r s in computing
parity. Interestingly, we estimate that this c o m p o n e n t
accounts for as much as
94% o f the cost o f a Big Mac. O u r new results indicate that
the No-Frills Index
p e r f o r m s even b e t t e r than the Big Mac Index,
especially for the p o o r e r
countries and could b e o f use to practitioners and policy-
makers.
Notes
1. The origins of PPP theory are analyzed in detail by Frenkel
(1976) and Officer (1982).
2. Studies by A d l e r and Lehmann (1983), Huizinga (1987)
and Meese and Rogof~ (1988)
are unable to reject the hypothesis that real exchange rates
follow a r a n d o m walk under
the floating exchange rate regime. However, recent studies by A
b u a f and Jorion (1990),
D i e b o l d et al. (1991) and Lothian (1990) find evidence o f
mean-reverting behavior in
real exchange rates using long-term time series data. O t h e r
research into real exchange
rate behavior during the float include Dornbusch (1987), F r a n
k e l and M e e s e (1987),
M e e s e (1990) and Officer (1976). Recent surveys o f the
literature are provided by
Lothian (1997), R o g o f f (1996) and Taylor (1995).
874
Burgernomics: the economics of the Big Mac standard: Li Lian
Ong
3. F r o o t and R o g o f f (1994) and Officer (1982) provide
comprehensive reviews o f the
l i t e r a t u r e in this area.
4. As an example, consider a two-country, two-good (traded and
non-traded, T and N )
world, where one country is rich and the o t h e r poor. Let the
rich country be m o r e
productive in the production of both T and N. Although this
country has an absolute
advantage in both goods, it is plausible to postulate that it is
relatively m o r e productive
in T. The reason lies in the nature of N which have large service
c o m p o n e n t s and are
labor-intensive. Thus, productivity improvements are m o r e
difficult in these areas.
Consequently, the relatively higher productivity o f T in the
rich country means that
their relative prices will be c h e a p e r in the rich country (in
terms of N).
5. The mechanics of this concept are discussed in further detail
in Section III. O t h e r
research into the PBH include Bartolini (1995) and Clemcnts
and S e m u d r a m (1983).
6. See Summers and H e s t o n (1991) for a description of the
data.
7. T h e r e have been strong criticisms o f the reliability of
the ICP method, however. They
include the fact that (i) world average prices are used to value
the G D P c o m p o n e n t s ,
which means that since world average prices are d o m i n a t e
d by the larger weights o f rich
countries, price weights that are not reflective of the low-
income countries t e n d to push
up their relative quantity indices (Isenman, 1980); (ii) the ICP
prices ' c o m p a r i s o n
resistant' services, which have no identifiable unit of output
which could be easily priced
(Maddison, 1983); and (iii) ICP d a t a are only g a t h e r e d
at 5-year intervals (beginning in
1970) and country coverage is limited, which means that data
from n o n - b e n c h m a r k years
and countries must be o b t a i n e d by extrapolation;
moreover, there is also a long time lag
between collection of the d a t a and their availability (Rogoff,
1996).
8. The Big Mac hamburger is p r o d u c e d locally in more
than 80 countries a r o u n d the world,
with only minor changes in recipe. It is 95 mm in diameter,
weighs 205 g and generally
uses the same ingredients everywhere - - two b e e f patties, a
special sauce, lettuce,
cheese, pickles and a sesame-seed bun ( L o o k Japan, June
1994). As well as being a
' s t a n d a r d product', this means that its local prices are less
likely to be d i s t o r t e d by
international t r a n s p o r t a t i o n and distribution costs.
9. t-test results indicate that the majority of the W e s t e r n
and Central E u r o p e a n currencies
a p p e a r to deviate significantly from parity at the 0.1%
level. Only I r e l a n d is at parity
with the US. In the A m e r i c a s group, parity with the US is
achieved by Mexico and
Brazil, while Canada, surprisingly, deviates from its North A m
e r i c a n neighbour at the
5% level. This result could perhaps be explained by Engel and
Rogers' (1995) finding
that crossing the US C a n a d i a n b o r d e r is equivalent to
adding 7182 miles between two
cities in the same country, in the context o f price differences
between locations.
Meanwhile, all the A S E A N - O c e a n i a currencies are
significantly undervalued. Results of
t-tests for parity by region indicate that except for Western and
Central E u r o p e which is
significantly overvalued, all o t h e r regions are, on average,
either undervalued or at
parity with the US. The currencies o f A S E A N - O c e a n i a
and Eastern E u r o p e are
significantly undervalued by approx. 28%, while the null
hypothesis of PPP holds for the
A m e r i c a s and East Asia. These findings are explained to
some extent by F r a n k e l and
W e i ' s (1995) research into the existence o f currency blocs.
Finally, the t-statistic for the
entire sample indicates that the currencies, averaged over time
and countries, deviate
significantly from parity at the 5% level.
10. Results of t-tests seem to imply that the over- or under-
valuation of each currency, with
respect to the US dollar, t e n d to offset one another on an
annual basis. W i t h the
exception o f 1987, when the US dollar is significantly
undervalued at the 1% level, it
a p p e a r s that the US dollar is m o r e or less at parity in
each year. Cumby (1996) finds that
deviations from Big Mac PPP are useful for forecasting
exchange rates. A f t e r account-
ing for currency-specific constants, a 10% undervaluation in 1
year, according to the Big
Mac Index, is associated with a 3.5% appreciation over the
following year.
11. Initially, we estimate Eq. ( 2 ) for each year, using cross-
country data; the results are
given in the first part o f Table 1. The adjusted R 2 figures
indicate a very significant
relationship between the implied and actual exchange rates on a
year-by-year basis. The
hypotheses of a zero intercept, a unit slope coefficient and the
joint hypothesis o f a z e r o
875
Burgernornics: the economics of the Big Mac standard." Li Lian
Ong
intercept and unit slope coefficient cannot be rejected for any 1
year, except for 1986
and 1987. Next, we pool the data over time and across
countries; the results are
p r e s e n t e d in the second part o f Table 1. In this case,
both the null hypotheses, when
taken separately, cannot be rejected. However, the joint
hypothesis is rejected at the 5%
level o f significance.
12. F r a n k e l and R o s e (1995), H a k k i o (1984) and Oh
(1996) show that the higher variability
in cross-sectional data, relative to time-series data, allows for m
o r e precise p a r a m e t e r
estimates in tests of PPP. Similarly, Cumby (1996) d e m o n s t
r a t e s that a larger cross-sec-
tion yields enough power to detect substantial mean-reversion
in his tests of Big Mac
PPP. H e finds little persistence in deviations from Big Mac
PPP, with only 30% o f
deviations persisting into the following year
13. As can be seen in the third part of Table 1, the adjusted R 2
remains very high at 98%.
The intercept and slope coefficient are not significantly
different from zero and unity,
respectively, while the joint hypothesis for the slope and
intercept also cannot be
rejected. This finding of long-run PPP is consistent with the
results o f A b u a f and Jorion
(1990), D i e b o l d et al. (1991), Frenkel (1981), Lothian
(1990) and Officer (1976). M a n z u r
(1990) shows that the long-run in PPP terms is 5 years.
14. See Blundell-Wignall et al. (1993), Edison and Pauls (1993)
and F r o o t and Rogoff
(1994). Note that as our d a t a observations are both across
countries and over time,
non-stationarity may not be such a problem as c o m p a r e d
with the situation with pure
time-series data.
15. The results o f the relative parity regressions o f annual
data are given in the first part o f
Table 1. With the exception of 1986/1987 and 1987/1988, we
find the adjusted R - to be
very high for each year. However, the joint hypothesis o f a
zero intercept and unit slope
is rejected for all years except 1990/1991. The j o i n t
hypothesis is also rejected when
averaged d a t a are used. W h e n the d a t a are pooled across
countries and over time, the
adjusted R 2 is approx. 90%. In this instance, both the null
hypotheses of a zero
i n t e r c e p t / u n i t slope coefficient as well as the joint
hypothesis cannot be rejected.
16. See H a r r o d (1939).
17. Look Japan, June 1994.
18. Firms are said to ' p r i c e to m a r k e t ' when they charge
different local prices across export
markets to reflect the particular local competitive situation; any
exchange rate move-
ment is a b s o r b e d by altering the home currency export
price (Ghosh and Wolf, 1994).
Cumby (1996) finds that relative local currency prices a p p e a
r to adjust to reduce
deviations from Big Mac PPP.
19. Using the price of haircuts in 24 countries to measure the
price of N, they find a strong
positive association between the price of a haircut and the GDP.
They estimate the
income elasticity o f the relative price of T, as r e p r e s e n t e
d by the regression coefficient
~/, in Eq. ( 6 ) , as being equal to - 0 . 2 5 6 , with s t a n d a r
d e r r o r 0.061. Their finding that N
become relatively more expensive with increasing income is
consistent with the PBH.
20. Note that the negative o f r, as defined in Eq. (1), is the
conventional definition of the
real exchange rate.
21. To estimate Eq. ( 8 ) , we use the d a t a on r, calculated in
Section I, and G D P figures
o b t a i n e d from the International Financial Statistics of the
International M o n e t a r y F u n d
(1996). Observations are omitted in instances where G D P d a
t a are unavailable.
22. See Ong (1995).
23. Not shown in Table 3; see Ong (1995) for calculation
details.
R e f e r e n c e s
Abuaf, N. and Jorion, P. (1990) Purchasing power parity in the
long run. Journal o f Finance
35, 157-174.
Adler, M. and Lehmann, B. (1983) Deviations from purchasing
power parity in the long run.
Journal o f Finance 38, 147-187.
876
Burgernomics: the economics of the Big Mac standard: Li Lian
Ong
Balassa, B. (1964) The purchasing-power parity doctrine: a
reappraisal. Journal of Political
Economy 72, 584-596.
Bartolini, L. (1995) Purchasing power parity measures of
competitiveness. Finance and
Development 32, 46-49.
Betton, S., Levi, M. D. and Uppal, R. (1995) Index-induced
errors and purchasing power
parity: bounding the possible bias. Journal of" International
Financial Markets, Institutions
and Money 5, 165 179.
BlundelI-Wignall, A., Fahrer, J. and Heath, A. (1993) Major
influences on the Australian
dollar exchange rate. The Exchange Rate, hlternational Trade
and the Balance of Payments.
Proceedings o f a Conference held at the H, C. Coombs Centre
for Financial Studies,
Kirribilli.
Clements, K. W. and Frenkel, J. A. (1980) Exchange rates,
money, and relative prices: the
dollar-pound in the 1920s. Journal of International Economics
10, 249-262.
Clements, K. W. and Semudram, M. (1983) An international
comparison of the price o f
nontraded goods. Weltwirtschaftliches Archiv 119, 356-363.
Cumby, R. (1996) Forecasting exchange rates on the hamburger
standard: what you see is
what you get with McParity. N B E R Working Paper Series,
No. 5675, National Bureau o f
Economic Research.
Diebold, F. X., Husted, S. and Rush, M. (1991) Real exchange
rates under the gold standard.
Journal of Political Economy 99, 1252-1271.
Dornbusch, R. (1987) Purchasing power parity. In The New
Palgrave: A Dictionary o f
Economics, eds J. Eatwell, M. Milgate and P. Newman, pp.
1075 1085. Macmillan,
London.
Edison, H. J. and Pauls, B. D. (1993) A re-assessment of the
relationship between real
exchange rates and real interest rates: 1974-1990. Journal of
Monetary Economics 31,
165-187.
Engel, C. and Rogers, J. H. (1995) How wide is the border?
International Finance
Discussion Papers, No. 498, Board of Governors of the Federal
Reserve System.
Frankel, J. A. and Meese, R. (1987) Are exchange rates
excessively variable? In NBER
MacroeconomicsAnnual, ed Stanley Fischer, pp. 117 153. M I T
Press, Cambridge, MA.
Frankel, J. A. and Rose, A. K. (1995) A panel project on
purchasing power parity: mean
reversion within and between countries. N B E R Working
Paper Series, No. 5006, National
Bureau of Economic Research.
Frankel, J. A. and Wei, S.-J. (1995) Is a yen bloc emerging? In
Economic Cooperation and
Challenges in the Pacific, ed R. Rich, pp. 145-175. Korea
Economic Institute o f America,
Washington, DC.
Frenkel, J. A. (1976) A monetary approach to the exchange rate:
doctrinal aspects and
empirical evidence. Scandinavian Journal o f Economics 78,
200-224.
Frenkel, J. A. (1981) The collapse of purchasing power parities
during the 1970s. European
Economic Review 16, 145-165.
Froot, K. A. and Rogoff, K. (1994) Perspectives on PPP and
long-run real exchange rates. In
Handbook of huernational Economics, eds G. Grossman and K.
Rogoff, Vol. 3, pp.
1647-1688. North-Holland, Amsterdam.
Ghosh, A. R. and Wolf, H. C. (1994) Pricing in international
markets: lessons from The
Economist. N B E R Working Paper Series, No. 4806, National
Bureau of Economic
Research.
Hakkio, C. S. (1984) A re-examination of purchasing power
parity: a multi-country and
multi-period study. Journal of hzternational Economics 17, 265-
277.
Harrod, R. F. (1939) h~ternational Economics. Nisbet,
Cambridge.
877
Bungemomics: the economics of the Big Mac standard: Li Lian
Ong
Huizinga, J. (1987) An empirical investigation of the long-run
behavior of real exchange
rates. In Carnegie-Rochester Series on Public Policy, eds K.
Brunner and A. Meltzer, Vol.
27, pp. 149-215.
International Monetary Fund (1996) bzternational Financial
Statistics Yearbook, 1996.
International Monetary Fund, Washington, DC.
Isenman, P. (1980) Inter-country comparison of 'real' (PPP)
incomes: revised estimates and
unresolved questions. World Development 8, 61-72.
Kravis, I. B. (1986) The three faces of the International
Comparison Project. Research
Observer 1, 3-26.
Look Japan, Vol. 40, No. 459. Look Japan, Tokyo.
Lothian, J. R. (1990) A century plus of Japanese exchange rate
behavior. Japan and the
World Economy 2, 47-70.
Lothian, J. R. (1997) Multi-country evidence on the behavior of
purchasing power parity
under the current float. Journal of International Money and
Finance 16, 19-36.
Maddison, A. (1983) A comparison of the levels of GDP per
capita in developed and
developing countries, 1790-1980. Journal of Economic History
43, 27-41.
Manzur, M. (1990) An international comparison of prices and
exchange rates: a new test of
purchasing power parity. Journal of International Money and
Finance 9, 75-91.
Meese, R. (1990) Currency fluctuations in the post-Bretton
Woods period. Journal of
Economic Perspectives 4, 117 134.
Meese, R. and Rogoff, K. S. (1988) Was it real? The exchange
rate-interest differential
relation over the modern floating-rate period. Journal of
Finance 43, 933-948.
Officer, L. H. (1976) The purchasing-power-parity theory of
exchange rates: a review article.
bzternational Monetary Fund Staff" Papers 23, 1 60.
Officer, L. H. (1982) Purchasing Power Parity and Exchange
Rates: Theory, Evidence and
Relevance. JAI Press, Connecticut.
Oh, K.-Y. (1996) Purchasing power parity and unit root tests
using panel data. Journal of
huernational Money and Finance 15, 405-418.
Ong, L. L. (1995) Burgernomics: The economics of the Big Mac
standard. Working Paper,
No. 95-52, Department of Accounting and Finance, The
University of Western Australia.
Pakko, M. R. and Pollard, P. S. (1996) For here or to go?
Purchasing power parity and the
Big Mac. Federal Reserve Bank of St. Louis Review 78, 3-21.
Rogoff, K. (1996) The purchasing power parity puzzle. Journal
of Economic Literature 34,
647-668.
Samuelson, P. A. (1964) Theoretical notes on trade problems.
Review of Economics and
Statistics 46, 145-154.
Summers, R. and Heston, A. (1991) The Penn World Table
(Mark 5): an expanded set of
international comparisons, 1950-1988. Quarterly Journal of
Economics 106, 327-368.
Taylor, M. P. (1995) The economics of exchange rates. Journal
of Economic Literature 33,
13 47.
The Economist, Vol. 300, No. 7462; Vol. 307, No. 7544; Vol.
311, No. 7598; Vol. 315, No.
7653; Vol. 319, No. 7702; Vol. 323, No. 7755; Vol. 327, No.
7807; Vol. 327, No. 7811; Vol.
331, No. 7858; Vol. 336, No. 7929. The Economist Newspaper,
London.
878
The Big Mac Index •
Topic: The Big Mac Index Write an essay more than 1000
words, excluding reference,
explaining the Big Mac Index and its advantages and limitations
in measuring PPP. Describe
the possible cause(s) of the failure of PPP that you learned in
the lecture. Also, examine the
conclusion from The Economist (article link below) that “[t]he
Chinese yuan, for example, is
44% undervalued against the dollar”. The following articles can
help you with the essay:
– http://www.economist.com/news/finance-and-
economics/21714392-emerging-market-
currenciesand-euro-look-undervalued-against-dollar-our-big
– Ong, L.L., 1997. Burgernomics: the economics of the Big Mac
standard. Journal of
International Money and Finance, 16(6), pp.865-878.
You are encouraged to search for more references or materials.
The reference should be in
Harvard style.

More Related Content

Similar to ~ ) Pergamon J o u n t a l q f l n t e r n a t i o n a l Mo.docx

CASE Network Studies and Analyses 343 - Sustainable Adjustment of Global Imba...
CASE Network Studies and Analyses 343 - Sustainable Adjustment of Global Imba...CASE Network Studies and Analyses 343 - Sustainable Adjustment of Global Imba...
CASE Network Studies and Analyses 343 - Sustainable Adjustment of Global Imba...
CASE Center for Social and Economic Research
 
Currency Forecasting Models
Currency Forecasting ModelsCurrency Forecasting Models
Currency Forecasting Models
basiljoe010
 
Foreign ExchangeRate Deterrntnattonand ForecastlngThe .docx
Foreign ExchangeRate Deterrntnattonand ForecastlngThe .docxForeign ExchangeRate Deterrntnattonand ForecastlngThe .docx
Foreign ExchangeRate Deterrntnattonand ForecastlngThe .docx
budbarber38650
 
ARTICLE ASSIGNMENT INFORMATIONInformation coming from Syllabus.docx
ARTICLE ASSIGNMENT INFORMATIONInformation coming from Syllabus.docxARTICLE ASSIGNMENT INFORMATIONInformation coming from Syllabus.docx
ARTICLE ASSIGNMENT INFORMATIONInformation coming from Syllabus.docx
fredharris32
 
Purchasing power parity a unit root, cointegration and var analysis in emergi...
Purchasing power parity a unit root, cointegration and var analysis in emergi...Purchasing power parity a unit root, cointegration and var analysis in emergi...
Purchasing power parity a unit root, cointegration and var analysis in emergi...
Giwrgos Loukopoulos
 
Econ Theory (2013) 53357–382DOI 10.1007s00199-012-0694-2
Econ Theory (2013) 53357–382DOI 10.1007s00199-012-0694-2Econ Theory (2013) 53357–382DOI 10.1007s00199-012-0694-2
Econ Theory (2013) 53357–382DOI 10.1007s00199-012-0694-2
EvonCanales257
 
Monetary Economics Project
Monetary Economics ProjectMonetary Economics Project
Monetary Economics ProjectSam Deegan
 
6_FDI & Trade in Cambodia
6_FDI & Trade in Cambodia6_FDI & Trade in Cambodia
6_FDI & Trade in CambodiaSamsen Neak
 
week 6 Discussion 1 Chapter 12 –From the chapter reading, we l.docx
week 6 Discussion 1 Chapter 12 –From the chapter reading, we l.docxweek 6 Discussion 1 Chapter 12 –From the chapter reading, we l.docx
week 6 Discussion 1 Chapter 12 –From the chapter reading, we l.docx
helzerpatrina
 
Capital asset pricing model (capm) evidence from nigeria
Capital asset pricing model (capm) evidence from nigeriaCapital asset pricing model (capm) evidence from nigeria
Capital asset pricing model (capm) evidence from nigeria
Alexander Decker
 
Purchasing power parity
Purchasing power parityPurchasing power parity
Purchasing power parity
Santhosh Kumar
 
Baltic dry index paper as predictor of economic activity and stock returns
Baltic dry index paper as predictor of economic activity and stock returnsBaltic dry index paper as predictor of economic activity and stock returns
Baltic dry index paper as predictor of economic activity and stock returns
neiracar
 
The choice of the exchange policies in the primary commodity exporting countr...
The choice of the exchange policies in the primary commodity exporting countr...The choice of the exchange policies in the primary commodity exporting countr...
The choice of the exchange policies in the primary commodity exporting countr...
Alexander Decker
 
Determinants of the implied equity risk premium in Brazil
Determinants of the implied equity risk premium in BrazilDeterminants of the implied equity risk premium in Brazil
Determinants of the implied equity risk premium in Brazil
FGV Brazil
 
iFinance - Why Exchange Rates Change: Purchasing Power Parity and Interest Ra...
iFinance - Why Exchange Rates Change: Purchasing Power Parity and Interest Ra...iFinance - Why Exchange Rates Change: Purchasing Power Parity and Interest Ra...
iFinance - Why Exchange Rates Change: Purchasing Power Parity and Interest Ra...Capa Pham
 
Econ 6301 Applied Microeconomic TheoryREADING ASSIGNMENT #2Ch .docx
Econ 6301 Applied Microeconomic TheoryREADING ASSIGNMENT #2Ch .docxEcon 6301 Applied Microeconomic TheoryREADING ASSIGNMENT #2Ch .docx
Econ 6301 Applied Microeconomic TheoryREADING ASSIGNMENT #2Ch .docx
madlynplamondon
 
The equity premium a puzzle
The equity premium a puzzleThe equity premium a puzzle
The equity premium a puzzle
Mai Ngoc Duc
 
Traditional convergence tests with Penn World Table 9.01
Traditional convergence tests with Penn World Table 9.01Traditional convergence tests with Penn World Table 9.01
Traditional convergence tests with Penn World Table 9.01
Palkansaajien tutkimuslaitos
 

Similar to ~ ) Pergamon J o u n t a l q f l n t e r n a t i o n a l Mo.docx (20)

CASE Network Studies and Analyses 343 - Sustainable Adjustment of Global Imba...
CASE Network Studies and Analyses 343 - Sustainable Adjustment of Global Imba...CASE Network Studies and Analyses 343 - Sustainable Adjustment of Global Imba...
CASE Network Studies and Analyses 343 - Sustainable Adjustment of Global Imba...
 
Currency Forecasting Models
Currency Forecasting ModelsCurrency Forecasting Models
Currency Forecasting Models
 
Foreign ExchangeRate Deterrntnattonand ForecastlngThe .docx
Foreign ExchangeRate Deterrntnattonand ForecastlngThe .docxForeign ExchangeRate Deterrntnattonand ForecastlngThe .docx
Foreign ExchangeRate Deterrntnattonand ForecastlngThe .docx
 
ARTICLE ASSIGNMENT INFORMATIONInformation coming from Syllabus.docx
ARTICLE ASSIGNMENT INFORMATIONInformation coming from Syllabus.docxARTICLE ASSIGNMENT INFORMATIONInformation coming from Syllabus.docx
ARTICLE ASSIGNMENT INFORMATIONInformation coming from Syllabus.docx
 
Purchasing power parity a unit root, cointegration and var analysis in emergi...
Purchasing power parity a unit root, cointegration and var analysis in emergi...Purchasing power parity a unit root, cointegration and var analysis in emergi...
Purchasing power parity a unit root, cointegration and var analysis in emergi...
 
Econ Theory (2013) 53357–382DOI 10.1007s00199-012-0694-2
Econ Theory (2013) 53357–382DOI 10.1007s00199-012-0694-2Econ Theory (2013) 53357–382DOI 10.1007s00199-012-0694-2
Econ Theory (2013) 53357–382DOI 10.1007s00199-012-0694-2
 
Monetary Economics Project
Monetary Economics ProjectMonetary Economics Project
Monetary Economics Project
 
6_FDI & Trade in Cambodia
6_FDI & Trade in Cambodia6_FDI & Trade in Cambodia
6_FDI & Trade in Cambodia
 
week 6 Discussion 1 Chapter 12 –From the chapter reading, we l.docx
week 6 Discussion 1 Chapter 12 –From the chapter reading, we l.docxweek 6 Discussion 1 Chapter 12 –From the chapter reading, we l.docx
week 6 Discussion 1 Chapter 12 –From the chapter reading, we l.docx
 
Capital asset pricing model (capm) evidence from nigeria
Capital asset pricing model (capm) evidence from nigeriaCapital asset pricing model (capm) evidence from nigeria
Capital asset pricing model (capm) evidence from nigeria
 
Purchasing power parity
Purchasing power parityPurchasing power parity
Purchasing power parity
 
Baltic dry index paper as predictor of economic activity and stock returns
Baltic dry index paper as predictor of economic activity and stock returnsBaltic dry index paper as predictor of economic activity and stock returns
Baltic dry index paper as predictor of economic activity and stock returns
 
The choice of the exchange policies in the primary commodity exporting countr...
The choice of the exchange policies in the primary commodity exporting countr...The choice of the exchange policies in the primary commodity exporting countr...
The choice of the exchange policies in the primary commodity exporting countr...
 
AGGLOMERATION AND INTERREGIONAL MOBILITY OF LABOR IN PORTUGAL
AGGLOMERATION AND INTERREGIONAL MOBILITY OF LABOR IN PORTUGALAGGLOMERATION AND INTERREGIONAL MOBILITY OF LABOR IN PORTUGAL
AGGLOMERATION AND INTERREGIONAL MOBILITY OF LABOR IN PORTUGAL
 
Determinants of the implied equity risk premium in Brazil
Determinants of the implied equity risk premium in BrazilDeterminants of the implied equity risk premium in Brazil
Determinants of the implied equity risk premium in Brazil
 
iFinance - Why Exchange Rates Change: Purchasing Power Parity and Interest Ra...
iFinance - Why Exchange Rates Change: Purchasing Power Parity and Interest Ra...iFinance - Why Exchange Rates Change: Purchasing Power Parity and Interest Ra...
iFinance - Why Exchange Rates Change: Purchasing Power Parity and Interest Ra...
 
Econ 6301 Applied Microeconomic TheoryREADING ASSIGNMENT #2Ch .docx
Econ 6301 Applied Microeconomic TheoryREADING ASSIGNMENT #2Ch .docxEcon 6301 Applied Microeconomic TheoryREADING ASSIGNMENT #2Ch .docx
Econ 6301 Applied Microeconomic TheoryREADING ASSIGNMENT #2Ch .docx
 
Bf
BfBf
Bf
 
The equity premium a puzzle
The equity premium a puzzleThe equity premium a puzzle
The equity premium a puzzle
 
Traditional convergence tests with Penn World Table 9.01
Traditional convergence tests with Penn World Table 9.01Traditional convergence tests with Penn World Table 9.01
Traditional convergence tests with Penn World Table 9.01
 

More from gerardkortney

· Describe strategies to build rapport with inmates and offenders .docx
· Describe strategies to build rapport with inmates and offenders .docx· Describe strategies to build rapport with inmates and offenders .docx
· Describe strategies to build rapport with inmates and offenders .docx
gerardkortney
 
· Debates continue regarding what constitutes an appropriate rol.docx
· Debates continue regarding what constitutes an appropriate rol.docx· Debates continue regarding what constitutes an appropriate rol.docx
· Debates continue regarding what constitutes an appropriate rol.docx
gerardkortney
 
· Critical thinking paper ·  ·  · 1. A case study..docx
· Critical thinking paper ·  ·  · 1. A case study..docx· Critical thinking paper ·  ·  · 1. A case study..docx
· Critical thinking paper ·  ·  · 1. A case study..docx
gerardkortney
 
· Create a Press Release for your event - refer to slide 24 in thi.docx
· Create a Press Release for your event - refer to slide 24 in thi.docx· Create a Press Release for your event - refer to slide 24 in thi.docx
· Create a Press Release for your event - refer to slide 24 in thi.docx
gerardkortney
 
· Coronel & Morris Chapter 7, Problems 1, 2 and 3.docx
· Coronel & Morris Chapter 7, Problems 1, 2 and 3.docx· Coronel & Morris Chapter 7, Problems 1, 2 and 3.docx
· Coronel & Morris Chapter 7, Problems 1, 2 and 3.docx
gerardkortney
 
· Complete the following problems from your textbook· Pages 378.docx
· Complete the following problems from your textbook· Pages 378.docx· Complete the following problems from your textbook· Pages 378.docx
· Complete the following problems from your textbook· Pages 378.docx
gerardkortney
 
· Consider how different countries approach aging. As you consid.docx
· Consider how different countries approach aging. As you consid.docx· Consider how different countries approach aging. As you consid.docx
· Consider how different countries approach aging. As you consid.docx
gerardkortney
 
· Clarifying some things on the Revolution I am going to say som.docx
· Clarifying some things on the Revolution I am going to say som.docx· Clarifying some things on the Revolution I am going to say som.docx
· Clarifying some things on the Revolution I am going to say som.docx
gerardkortney
 
· Chapter 9 – Review the section on Establishing a Security Cultur.docx
· Chapter 9 – Review the section on Establishing a Security Cultur.docx· Chapter 9 – Review the section on Establishing a Security Cultur.docx
· Chapter 9 – Review the section on Establishing a Security Cultur.docx
gerardkortney
 
· Chapter 10 The Early Elementary Grades 1-3The primary grades.docx
· Chapter 10 The Early Elementary Grades 1-3The primary grades.docx· Chapter 10 The Early Elementary Grades 1-3The primary grades.docx
· Chapter 10 The Early Elementary Grades 1-3The primary grades.docx
gerardkortney
 
· Chapter 5, Formulating the Research Design”· Section 5.2, Ch.docx
· Chapter 5, Formulating the Research Design”· Section 5.2, Ch.docx· Chapter 5, Formulating the Research Design”· Section 5.2, Ch.docx
· Chapter 5, Formulating the Research Design”· Section 5.2, Ch.docx
gerardkortney
 
· Chap 2 and 3· what barriers are there in terms of the inter.docx
· Chap 2 and  3· what barriers are there in terms of the inter.docx· Chap 2 and  3· what barriers are there in terms of the inter.docx
· Chap 2 and 3· what barriers are there in terms of the inter.docx
gerardkortney
 
· Case Study 2 Improving E-Mail Marketing ResponseDue Week 8 an.docx
· Case Study 2 Improving E-Mail Marketing ResponseDue Week 8 an.docx· Case Study 2 Improving E-Mail Marketing ResponseDue Week 8 an.docx
· Case Study 2 Improving E-Mail Marketing ResponseDue Week 8 an.docx
gerardkortney
 
· Briefly describe the technologies that are leading businesses in.docx
· Briefly describe the technologies that are leading businesses in.docx· Briefly describe the technologies that are leading businesses in.docx
· Briefly describe the technologies that are leading businesses in.docx
gerardkortney
 
· Assignment List· My Personality Theory Paper (Week Four)My.docx
· Assignment List· My Personality Theory Paper (Week Four)My.docx· Assignment List· My Personality Theory Paper (Week Four)My.docx
· Assignment List· My Personality Theory Paper (Week Four)My.docx
gerardkortney
 
· Assignment List· Week 7 - Philosophical EssayWeek 7 - Philos.docx
· Assignment List· Week 7 - Philosophical EssayWeek 7 - Philos.docx· Assignment List· Week 7 - Philosophical EssayWeek 7 - Philos.docx
· Assignment List· Week 7 - Philosophical EssayWeek 7 - Philos.docx
gerardkortney
 
· Assignment 3 Creating a Compelling VisionLeaders today must be .docx
· Assignment 3 Creating a Compelling VisionLeaders today must be .docx· Assignment 3 Creating a Compelling VisionLeaders today must be .docx
· Assignment 3 Creating a Compelling VisionLeaders today must be .docx
gerardkortney
 
· Assignment 4· Week 4 – Assignment Explain Theoretical Perspec.docx
· Assignment 4· Week 4 – Assignment Explain Theoretical Perspec.docx· Assignment 4· Week 4 – Assignment Explain Theoretical Perspec.docx
· Assignment 4· Week 4 – Assignment Explain Theoretical Perspec.docx
gerardkortney
 
· Assignment 2 Leader ProfileMany argue that the single largest v.docx
· Assignment 2 Leader ProfileMany argue that the single largest v.docx· Assignment 2 Leader ProfileMany argue that the single largest v.docx
· Assignment 2 Leader ProfileMany argue that the single largest v.docx
gerardkortney
 
· Assignment 1 Diversity Issues in Treating AddictionThe comple.docx
· Assignment 1 Diversity Issues in Treating AddictionThe comple.docx· Assignment 1 Diversity Issues in Treating AddictionThe comple.docx
· Assignment 1 Diversity Issues in Treating AddictionThe comple.docx
gerardkortney
 

More from gerardkortney (20)

· Describe strategies to build rapport with inmates and offenders .docx
· Describe strategies to build rapport with inmates and offenders .docx· Describe strategies to build rapport with inmates and offenders .docx
· Describe strategies to build rapport with inmates and offenders .docx
 
· Debates continue regarding what constitutes an appropriate rol.docx
· Debates continue regarding what constitutes an appropriate rol.docx· Debates continue regarding what constitutes an appropriate rol.docx
· Debates continue regarding what constitutes an appropriate rol.docx
 
· Critical thinking paper ·  ·  · 1. A case study..docx
· Critical thinking paper ·  ·  · 1. A case study..docx· Critical thinking paper ·  ·  · 1. A case study..docx
· Critical thinking paper ·  ·  · 1. A case study..docx
 
· Create a Press Release for your event - refer to slide 24 in thi.docx
· Create a Press Release for your event - refer to slide 24 in thi.docx· Create a Press Release for your event - refer to slide 24 in thi.docx
· Create a Press Release for your event - refer to slide 24 in thi.docx
 
· Coronel & Morris Chapter 7, Problems 1, 2 and 3.docx
· Coronel & Morris Chapter 7, Problems 1, 2 and 3.docx· Coronel & Morris Chapter 7, Problems 1, 2 and 3.docx
· Coronel & Morris Chapter 7, Problems 1, 2 and 3.docx
 
· Complete the following problems from your textbook· Pages 378.docx
· Complete the following problems from your textbook· Pages 378.docx· Complete the following problems from your textbook· Pages 378.docx
· Complete the following problems from your textbook· Pages 378.docx
 
· Consider how different countries approach aging. As you consid.docx
· Consider how different countries approach aging. As you consid.docx· Consider how different countries approach aging. As you consid.docx
· Consider how different countries approach aging. As you consid.docx
 
· Clarifying some things on the Revolution I am going to say som.docx
· Clarifying some things on the Revolution I am going to say som.docx· Clarifying some things on the Revolution I am going to say som.docx
· Clarifying some things on the Revolution I am going to say som.docx
 
· Chapter 9 – Review the section on Establishing a Security Cultur.docx
· Chapter 9 – Review the section on Establishing a Security Cultur.docx· Chapter 9 – Review the section on Establishing a Security Cultur.docx
· Chapter 9 – Review the section on Establishing a Security Cultur.docx
 
· Chapter 10 The Early Elementary Grades 1-3The primary grades.docx
· Chapter 10 The Early Elementary Grades 1-3The primary grades.docx· Chapter 10 The Early Elementary Grades 1-3The primary grades.docx
· Chapter 10 The Early Elementary Grades 1-3The primary grades.docx
 
· Chapter 5, Formulating the Research Design”· Section 5.2, Ch.docx
· Chapter 5, Formulating the Research Design”· Section 5.2, Ch.docx· Chapter 5, Formulating the Research Design”· Section 5.2, Ch.docx
· Chapter 5, Formulating the Research Design”· Section 5.2, Ch.docx
 
· Chap 2 and 3· what barriers are there in terms of the inter.docx
· Chap 2 and  3· what barriers are there in terms of the inter.docx· Chap 2 and  3· what barriers are there in terms of the inter.docx
· Chap 2 and 3· what barriers are there in terms of the inter.docx
 
· Case Study 2 Improving E-Mail Marketing ResponseDue Week 8 an.docx
· Case Study 2 Improving E-Mail Marketing ResponseDue Week 8 an.docx· Case Study 2 Improving E-Mail Marketing ResponseDue Week 8 an.docx
· Case Study 2 Improving E-Mail Marketing ResponseDue Week 8 an.docx
 
· Briefly describe the technologies that are leading businesses in.docx
· Briefly describe the technologies that are leading businesses in.docx· Briefly describe the technologies that are leading businesses in.docx
· Briefly describe the technologies that are leading businesses in.docx
 
· Assignment List· My Personality Theory Paper (Week Four)My.docx
· Assignment List· My Personality Theory Paper (Week Four)My.docx· Assignment List· My Personality Theory Paper (Week Four)My.docx
· Assignment List· My Personality Theory Paper (Week Four)My.docx
 
· Assignment List· Week 7 - Philosophical EssayWeek 7 - Philos.docx
· Assignment List· Week 7 - Philosophical EssayWeek 7 - Philos.docx· Assignment List· Week 7 - Philosophical EssayWeek 7 - Philos.docx
· Assignment List· Week 7 - Philosophical EssayWeek 7 - Philos.docx
 
· Assignment 3 Creating a Compelling VisionLeaders today must be .docx
· Assignment 3 Creating a Compelling VisionLeaders today must be .docx· Assignment 3 Creating a Compelling VisionLeaders today must be .docx
· Assignment 3 Creating a Compelling VisionLeaders today must be .docx
 
· Assignment 4· Week 4 – Assignment Explain Theoretical Perspec.docx
· Assignment 4· Week 4 – Assignment Explain Theoretical Perspec.docx· Assignment 4· Week 4 – Assignment Explain Theoretical Perspec.docx
· Assignment 4· Week 4 – Assignment Explain Theoretical Perspec.docx
 
· Assignment 2 Leader ProfileMany argue that the single largest v.docx
· Assignment 2 Leader ProfileMany argue that the single largest v.docx· Assignment 2 Leader ProfileMany argue that the single largest v.docx
· Assignment 2 Leader ProfileMany argue that the single largest v.docx
 
· Assignment 1 Diversity Issues in Treating AddictionThe comple.docx
· Assignment 1 Diversity Issues in Treating AddictionThe comple.docx· Assignment 1 Diversity Issues in Treating AddictionThe comple.docx
· Assignment 1 Diversity Issues in Treating AddictionThe comple.docx
 

Recently uploaded

June 3, 2024 Anti-Semitism Letter Sent to MIT President Kornbluth and MIT Cor...
June 3, 2024 Anti-Semitism Letter Sent to MIT President Kornbluth and MIT Cor...June 3, 2024 Anti-Semitism Letter Sent to MIT President Kornbluth and MIT Cor...
June 3, 2024 Anti-Semitism Letter Sent to MIT President Kornbluth and MIT Cor...
Levi Shapiro
 
aaaaaaaaaaaaaaaaaaaaaaaaaaaaaaaaaaaaaaaaa
aaaaaaaaaaaaaaaaaaaaaaaaaaaaaaaaaaaaaaaaaaaaaaaaaaaaaaaaaaaaaaaaaaaaaaaaaaaaaaaaaa
aaaaaaaaaaaaaaaaaaaaaaaaaaaaaaaaaaaaaaaaa
siemaillard
 
Marketing internship report file for MBA
Marketing internship report file for MBAMarketing internship report file for MBA
Marketing internship report file for MBA
gb193092
 
Mule 4.6 & Java 17 Upgrade | MuleSoft Mysore Meetup #46
Mule 4.6 & Java 17 Upgrade | MuleSoft Mysore Meetup #46Mule 4.6 & Java 17 Upgrade | MuleSoft Mysore Meetup #46
Mule 4.6 & Java 17 Upgrade | MuleSoft Mysore Meetup #46
MysoreMuleSoftMeetup
 
The Challenger.pdf DNHS Official Publication
The Challenger.pdf DNHS Official PublicationThe Challenger.pdf DNHS Official Publication
The Challenger.pdf DNHS Official Publication
Delapenabediema
 
BÀI TẬP BỔ TRỢ TIẾNG ANH GLOBAL SUCCESS LỚP 3 - CẢ NĂM (CÓ FILE NGHE VÀ ĐÁP Á...
BÀI TẬP BỔ TRỢ TIẾNG ANH GLOBAL SUCCESS LỚP 3 - CẢ NĂM (CÓ FILE NGHE VÀ ĐÁP Á...BÀI TẬP BỔ TRỢ TIẾNG ANH GLOBAL SUCCESS LỚP 3 - CẢ NĂM (CÓ FILE NGHE VÀ ĐÁP Á...
BÀI TẬP BỔ TRỢ TIẾNG ANH GLOBAL SUCCESS LỚP 3 - CẢ NĂM (CÓ FILE NGHE VÀ ĐÁP Á...
Nguyen Thanh Tu Collection
 
Group Presentation 2 Economics.Ariana Buscigliopptx
Group Presentation 2 Economics.Ariana BuscigliopptxGroup Presentation 2 Economics.Ariana Buscigliopptx
Group Presentation 2 Economics.Ariana Buscigliopptx
ArianaBusciglio
 
Unit 2- Research Aptitude (UGC NET Paper I).pdf
Unit 2- Research Aptitude (UGC NET Paper I).pdfUnit 2- Research Aptitude (UGC NET Paper I).pdf
Unit 2- Research Aptitude (UGC NET Paper I).pdf
Thiyagu K
 
Best Digital Marketing Institute In NOIDA
Best Digital Marketing Institute In NOIDABest Digital Marketing Institute In NOIDA
Best Digital Marketing Institute In NOIDA
deeptiverma2406
 
1.4 modern child centered education - mahatma gandhi-2.pptx
1.4 modern child centered education - mahatma gandhi-2.pptx1.4 modern child centered education - mahatma gandhi-2.pptx
1.4 modern child centered education - mahatma gandhi-2.pptx
JosvitaDsouza2
 
Introduction to AI for Nonprofits with Tapp Network
Introduction to AI for Nonprofits with Tapp NetworkIntroduction to AI for Nonprofits with Tapp Network
Introduction to AI for Nonprofits with Tapp Network
TechSoup
 
Acetabularia Information For Class 9 .docx
Acetabularia Information For Class 9  .docxAcetabularia Information For Class 9  .docx
Acetabularia Information For Class 9 .docx
vaibhavrinwa19
 
S1-Introduction-Biopesticides in ICM.pptx
S1-Introduction-Biopesticides in ICM.pptxS1-Introduction-Biopesticides in ICM.pptx
S1-Introduction-Biopesticides in ICM.pptx
tarandeep35
 
Guidance_and_Counselling.pdf B.Ed. 4th Semester
Guidance_and_Counselling.pdf B.Ed. 4th SemesterGuidance_and_Counselling.pdf B.Ed. 4th Semester
Guidance_and_Counselling.pdf B.Ed. 4th Semester
Atul Kumar Singh
 
Model Attribute Check Company Auto Property
Model Attribute  Check Company Auto PropertyModel Attribute  Check Company Auto Property
Model Attribute Check Company Auto Property
Celine George
 
Home assignment II on Spectroscopy 2024 Answers.pdf
Home assignment II on Spectroscopy 2024 Answers.pdfHome assignment II on Spectroscopy 2024 Answers.pdf
Home assignment II on Spectroscopy 2024 Answers.pdf
Tamralipta Mahavidyalaya
 
2024.06.01 Introducing a competency framework for languag learning materials ...
2024.06.01 Introducing a competency framework for languag learning materials ...2024.06.01 Introducing a competency framework for languag learning materials ...
2024.06.01 Introducing a competency framework for languag learning materials ...
Sandy Millin
 
Chapter 3 - Islamic Banking Products and Services.pptx
Chapter 3 - Islamic Banking Products and Services.pptxChapter 3 - Islamic Banking Products and Services.pptx
Chapter 3 - Islamic Banking Products and Services.pptx
Mohd Adib Abd Muin, Senior Lecturer at Universiti Utara Malaysia
 
Francesca Gottschalk - How can education support child empowerment.pptx
Francesca Gottschalk - How can education support child empowerment.pptxFrancesca Gottschalk - How can education support child empowerment.pptx
Francesca Gottschalk - How can education support child empowerment.pptx
EduSkills OECD
 
Digital Artifact 2 - Investigating Pavilion Designs
Digital Artifact 2 - Investigating Pavilion DesignsDigital Artifact 2 - Investigating Pavilion Designs
Digital Artifact 2 - Investigating Pavilion Designs
chanes7
 

Recently uploaded (20)

June 3, 2024 Anti-Semitism Letter Sent to MIT President Kornbluth and MIT Cor...
June 3, 2024 Anti-Semitism Letter Sent to MIT President Kornbluth and MIT Cor...June 3, 2024 Anti-Semitism Letter Sent to MIT President Kornbluth and MIT Cor...
June 3, 2024 Anti-Semitism Letter Sent to MIT President Kornbluth and MIT Cor...
 
aaaaaaaaaaaaaaaaaaaaaaaaaaaaaaaaaaaaaaaaa
aaaaaaaaaaaaaaaaaaaaaaaaaaaaaaaaaaaaaaaaaaaaaaaaaaaaaaaaaaaaaaaaaaaaaaaaaaaaaaaaaa
aaaaaaaaaaaaaaaaaaaaaaaaaaaaaaaaaaaaaaaaa
 
Marketing internship report file for MBA
Marketing internship report file for MBAMarketing internship report file for MBA
Marketing internship report file for MBA
 
Mule 4.6 & Java 17 Upgrade | MuleSoft Mysore Meetup #46
Mule 4.6 & Java 17 Upgrade | MuleSoft Mysore Meetup #46Mule 4.6 & Java 17 Upgrade | MuleSoft Mysore Meetup #46
Mule 4.6 & Java 17 Upgrade | MuleSoft Mysore Meetup #46
 
The Challenger.pdf DNHS Official Publication
The Challenger.pdf DNHS Official PublicationThe Challenger.pdf DNHS Official Publication
The Challenger.pdf DNHS Official Publication
 
BÀI TẬP BỔ TRỢ TIẾNG ANH GLOBAL SUCCESS LỚP 3 - CẢ NĂM (CÓ FILE NGHE VÀ ĐÁP Á...
BÀI TẬP BỔ TRỢ TIẾNG ANH GLOBAL SUCCESS LỚP 3 - CẢ NĂM (CÓ FILE NGHE VÀ ĐÁP Á...BÀI TẬP BỔ TRỢ TIẾNG ANH GLOBAL SUCCESS LỚP 3 - CẢ NĂM (CÓ FILE NGHE VÀ ĐÁP Á...
BÀI TẬP BỔ TRỢ TIẾNG ANH GLOBAL SUCCESS LỚP 3 - CẢ NĂM (CÓ FILE NGHE VÀ ĐÁP Á...
 
Group Presentation 2 Economics.Ariana Buscigliopptx
Group Presentation 2 Economics.Ariana BuscigliopptxGroup Presentation 2 Economics.Ariana Buscigliopptx
Group Presentation 2 Economics.Ariana Buscigliopptx
 
Unit 2- Research Aptitude (UGC NET Paper I).pdf
Unit 2- Research Aptitude (UGC NET Paper I).pdfUnit 2- Research Aptitude (UGC NET Paper I).pdf
Unit 2- Research Aptitude (UGC NET Paper I).pdf
 
Best Digital Marketing Institute In NOIDA
Best Digital Marketing Institute In NOIDABest Digital Marketing Institute In NOIDA
Best Digital Marketing Institute In NOIDA
 
1.4 modern child centered education - mahatma gandhi-2.pptx
1.4 modern child centered education - mahatma gandhi-2.pptx1.4 modern child centered education - mahatma gandhi-2.pptx
1.4 modern child centered education - mahatma gandhi-2.pptx
 
Introduction to AI for Nonprofits with Tapp Network
Introduction to AI for Nonprofits with Tapp NetworkIntroduction to AI for Nonprofits with Tapp Network
Introduction to AI for Nonprofits with Tapp Network
 
Acetabularia Information For Class 9 .docx
Acetabularia Information For Class 9  .docxAcetabularia Information For Class 9  .docx
Acetabularia Information For Class 9 .docx
 
S1-Introduction-Biopesticides in ICM.pptx
S1-Introduction-Biopesticides in ICM.pptxS1-Introduction-Biopesticides in ICM.pptx
S1-Introduction-Biopesticides in ICM.pptx
 
Guidance_and_Counselling.pdf B.Ed. 4th Semester
Guidance_and_Counselling.pdf B.Ed. 4th SemesterGuidance_and_Counselling.pdf B.Ed. 4th Semester
Guidance_and_Counselling.pdf B.Ed. 4th Semester
 
Model Attribute Check Company Auto Property
Model Attribute  Check Company Auto PropertyModel Attribute  Check Company Auto Property
Model Attribute Check Company Auto Property
 
Home assignment II on Spectroscopy 2024 Answers.pdf
Home assignment II on Spectroscopy 2024 Answers.pdfHome assignment II on Spectroscopy 2024 Answers.pdf
Home assignment II on Spectroscopy 2024 Answers.pdf
 
2024.06.01 Introducing a competency framework for languag learning materials ...
2024.06.01 Introducing a competency framework for languag learning materials ...2024.06.01 Introducing a competency framework for languag learning materials ...
2024.06.01 Introducing a competency framework for languag learning materials ...
 
Chapter 3 - Islamic Banking Products and Services.pptx
Chapter 3 - Islamic Banking Products and Services.pptxChapter 3 - Islamic Banking Products and Services.pptx
Chapter 3 - Islamic Banking Products and Services.pptx
 
Francesca Gottschalk - How can education support child empowerment.pptx
Francesca Gottschalk - How can education support child empowerment.pptxFrancesca Gottschalk - How can education support child empowerment.pptx
Francesca Gottschalk - How can education support child empowerment.pptx
 
Digital Artifact 2 - Investigating Pavilion Designs
Digital Artifact 2 - Investigating Pavilion DesignsDigital Artifact 2 - Investigating Pavilion Designs
Digital Artifact 2 - Investigating Pavilion Designs
 

~ ) Pergamon J o u n t a l q f l n t e r n a t i o n a l Mo.docx

  • 1. ~ ) Pergamon J o u n t a l q f l n t e r n a t i o n a l Monca' a n d Finance Vol. 16. No. 6, pp. 865 878, 1997 © 19t~7 Elsevier Science Ltd. All rights rcservcd Printed in G r e a t Britain P I I : S0261-5606(97)00032-6 0 2 6 1 - 5 6 0 6 / 9 7 $17.00 + 0.00 Burgernomics: the economics of the Big Mac standard* L I L I A N O N G + Department of Accounting and Finance, The University of Western Australia, Nedlands, WA 6907, Australia In the course of PPP research, much o f the debate over the validity has been over the choice o f an a p p r o p r i a t e ' b a s k e t ' for making purchasing power comparisons. The different compositions of goods and services in these baskets across countries have resulted in arguments against their usefulness for PPP purposes. This problem is a u g m e n t e d by the existence o f productivity differentials in t r a d e d and non-traded goods across coun- tries. T h e r e f o r e we consider the use o f the Big Mac as the international monetary s t a n d a r d as being a more palatable alternative: It
  • 2. is p r o d u c e d locally in over 80 countries a r o u n d the world, with only minor changes in recipe and thus has the flavour of ' t h e perfect universal commodity'. O u r results indicate that the Big Mac Index is surprisingly accurate in tracking exchange rates over the long-term, which is consistent with previous PPP research findings. W e subsequently enhance our PPP comparisons by taking into account the productivity differentials between countries and excluding n o n - t r a d e d goods from the Big Mac Index to derive the No-Frills Index. ( J E L F31). © 1997 Elsevier Science Ltd. All rights reserved. 'Suppose a man climbs five f e e t up a sea wall, then climbs down 12 feet. Whether he drowns o r not depends u p o n how high above sea-level he was when he started. T h e same p r o b l e m arises in deciding whether currencies are under- or o v e r - v a l u e d . . . ' The Economist, 26 August 1995 (p. 70) The purchasing power parity (PPP) doctrine is perhaps o n e o f the oldest and most widely researched areas in international finance. The origins o f PPP theory can be traced back to Spanish scholars o f the sixteenth century, although the intellectual origins o f the doctrine are credited to Wheatley's and
  • 3. *This p a p e r is a revised version o f a section o f my PhD thesis at the University o f W e s t e r n Australia, jointly supervised by Professor H. Y. Izan and Professor K. W. Clements. I ' d also like to thank G e o f f Kingston, P e t e r Forsyth, M a r d i Dungey, James R. Lothian, the participants at the 1995 PhD Conference in Economics and Business and an anonymous referee for their helpful comments; and the Australian Agency for I n t e r n a t i o n a l D e v e l o p - ment ( A u s A I D ) , and the D e p a r t m e n t of Accounting and Finance, The University o f Western Australia for their financial support. All remaining errors in this p a p e r are mine. *Corresponding author. Tel.: + 6 1 08 93803625; fax: +61 08 93801047; e-mail: [email protected] 865 Burgemomics: the economics of the Big Mac standard: Li Lian Ong Ricardo's w o r k in the n i n e t e e n t h century. ~ PPP t h e o r y as we know it today, however, is attributed to Gustav Cassel's writings during the 1920s. This interest has intensified over the last two decades with t h e collapse o f t h e B r e t t o n W o o d s system and the reintroduction o f flexible exchange rates in t h e early 1970s. 2 T h e controversial findings during this time have resulted in some researchers rejecting the merits of PPP in explaining exchange rate move-
  • 4. ments, while others c o n t e n d that PPP does i n d e e d provide a strong basis for exchange rate determination, with useful policy implications. In t h e course o f PPP research, m u c h o f the debate over its validity has b e e n over t h e choice o f an appropriate 'basket' for making PPP comparisons. T h e different compositions of goods and services in these baskets across countries and the extent to which these items affect the exchange rates have resulted in arguments against their usefulness for PPP purposes. F r o o t and R o g o f f (1994) observe that most empirical tests do not a t t e m p t to c o m p a r e identical baskets, but instead use different countries' c o n s u m e r and wholesale price indices which consist o f different weights and mixes o f goods across countries. This m e a n s that even if PPP holds, it m a y not necessarily show up in the results unless the two countries in question have identical baskets. Similarly, B e t t o n e t al. (1995) argue that w h e n consumption bundles are not identical, price indices based on local consumption patterns m a y behave differently even though the law o f one price holds for each commodity, resulting in biased outcomes o f PPP tests. 3 A n o t h e r major limitation in PPP research has b e e n t h e productivity bias hypothesis (PBH), which is probably considered the most serious criticism o f
  • 5. the absolute PPP t h e o r y today. This hypothesis, first introduced by H a r r o d (1939) and subsequently formalised by Balassa (1964) and Samuelson (1964), is based on the premise that productivity growth in the tradeable goods sector is faster t h a n that in the non-tradeable goods sector. 4 T h e result is that if t h e real exchange rate b e t w e e n two countries is c o m p u t e d using price deflators that include both tradeable and non-tradeable goods, t h e n the currency o f t h e country with faster productivity growth in the t r a d e d sector than in the n o n - t r a d e d sector will be systematically overvalued relative to its PPP level. 5 T h e U n i t e d Nations International Comparisons Project (ICP) m e t h o d o f accounting for PPP, which has received wide attention recently, is also based on the premise o f productivity differentials b e t w e e n countries. 6 According to Kravis (1986), this system o f international income and purchasing p o w e r comparisons improves t h e m e a s u r e m e n t o f countries' average incomes and t h e differences b e t w e e n them. Moreover, the ICP m e t h o d also enables t h e compar- ison o f price levels b e t w e e n countries and n o t just the relative changes in t h e m ] Using t h e ICP data, O h (1996) finds that PPP holds in the long-run f o r G-6 and O E C D countries u n d e r flexible exchange rates. Given t h e prevailing index-number and productivity bias
  • 6. problems, we have d e c i d e d to use the Big Mac as the international m o n e t a r y standard in this test o f PPP, in place o f the traditional basket o f goods and services. O u r decision is based on the Big Mac being 'the perfect universal commodity'. 8 F u r t h e r m o r e , since t h e Big Mac comprises both t r a d e d and n o n - t r a d e d goods, we are able to incorporate the productivity bias concept into o u r research. Pakko and Pollard 866 Burgernomics: the economics o f the Big Mac standard: Li Lian Ong (1996) provide an i n d e p e n d e n t analysis o f Big M a c PPP. In that paper, the authors investigate t h e p e r f o r m a n c e o f absolute and relative Big M a c PPP. T h e y also provide a discussion on why PPP fails. While we also p e r f o r m tests o f absolute and relative PPP similar to Pakko and Pollard's, we extend the analysis by (i) examining the productivity bias problem in g r e a t e r detail using the Big M a c h a m b u r g e r ; and (ii) improving on the Big Mac Index by introduc- ing the No-Frills Index, which takes into account the productivity differentials b e t w e e n countries. T h e data used in this study consist of the prices o f M c D o n
  • 7. a l d ' s Big M a c hamburgers in 34 countries and the corresponding exchange rates over t h e 1986-1994 period. These are published annually in The Economist magazine. O u r results indicate that the Big Mac Index performs just as well as, if n o t b e t t e r than, most indices used in tests of PPP. Like Pakko and Pollard (1996), we find that the Index is surprisingly accurate in tracking exchange rates over the long-term (i.e. t h e 9 years o f o u r sample period) which is consistent with previous PPP research findings. Even though individual currencies m a y deviate f r o m Big M a c PPP on a country-by-country basis, there is a distinct t e n d e n c y for deviations to offset o n e a n o t h e r so that the world currencies, in aggregate, are at parity for any 1 particular year. Moreover, geographic influences a p p e a r to play an important role in currency valuation. We show that PPP compar- isons can be e n h a n c e d by taking into account the productivity differentials b e t w e e n countries and excluding n o n - t r a d e d goods from the Big Mac Index to derive the No-Frills Index. This p a p e r is organised as follows. Section I examines t h e valuation o f currencies relative to their Big Mac PPP. This is followed by f u r t h e r tests o f PPP using regression analysis in Section II. In Sections III and IV, the Big Mac is d e c o m p o s e d into its t r a d e d and n o n - t r a d e d c
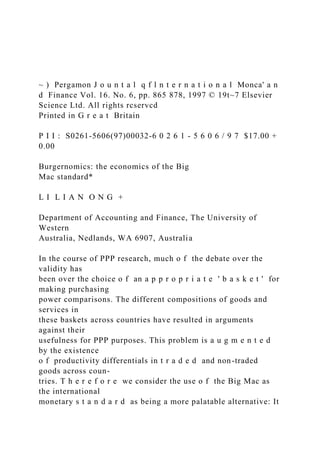
  • 8. o m p o n e n t s in o r d e r to e n h a n c e PPP comparisons. W e conclude with a s u m m a r y o f o u r findings in Section V. I. T h e v a l u a t i o n o f c u r r e n c i e s In this section, we investigate the valuation of currencies relative to their Big Mac PPP. Let Pc, be t h e domestic currency price o f a Big Mac in c o u n t r y c in y e a r t; P,* be the price in US dollars o f a Big Mac in the US; and Sct be the spot exchange rate, defined as the domestic currency cost o f US$1. Accord- ingly, P, JPt* is the Big M a c PPP. Expressed in logarithmic form, we have (1) log Pct/Pt* Pet rct==- ( Set ) = log~-t. - log Sct, such that a currency is said to be overvalued if rot is g r e a t e r t h a n zero, undervalued if r,., is less than zero and at parity if r , equals zero. T h e p e r c e n t a g e deviation f r o m parity is approximately rct X 100. Figure 1 shows the country averages o f t h e o v e r / u n d e r - v a l u a t i o n s , rc., w h e r e t h e 'o' notation indicates averages over time. Broadly speaking, it appears that t h e high-growth, developing economies in the A S E A N - O c e a n i a and E a s t e r n E u r o p e a n regions are generally u n d e r v a l u e d against the US, while the currencies o f d e v e l o p e d 867
  • 9. Burgernomics: the economics o f the Big Mac standard: Li Lian Ong rt. x 100 60 40 > 20 © -20 -40 > 60 -80 i l t I L l l i i i O i l l l O i O i O l O i O i O i l l i O i l l i O i O i ~ i i i i i i , I I I n o,o Grand Average O , , ,, ,, ,, I I The Americas Western and Central Europe Eastern Europe East Asia ASEAN-
  • 10. Oceania FIGURE 1. Over/under-valuation of currencies: regional groups, 1986-1994 averages. r., x 100 35 30 25 o= "~ 20 i ,5 o 10 0 .= "~ -5 .g -10 Grand Average ] ] ~ ' I I ' [ ] . . . . . [ 1986 1987 119881 1989 1990 1991 1992 1993 1994 I I FIGURE 2. Over/under-valuation of currencies: annual cross-
  • 11. country averages, 1986-1994. countries in Western and Central Europe, along with t h o s e o f the highly industrialised East A s i a n countries o f Taiwan, Japan and S o u t h Korea, are overvalued. 9 Figure 2 plots the annual averages o f the deviations from parity across countries, to,, where the ' . ' n o t a t i o n indicates averages across countries. A s can be seen, the U S dollar appears overvalued in 1988 and 1994, a l th o u g h n o t by much in the latter year. The dollar appears undervalued in all o t h e r ye ars. 10 868 Burgernomics: the economics of the Big Mac standard." Li Lian Ong II. F u r t h e r tests o f Big M a c P P P In Section I, we look at the valuation o f currencies relative to their Big Mac PPP and find that geographic influences play an important role in currency valuation. Furthermore, it appears that the U S dollar is generally at parity on a year-by-year basis. Using both time-series and averaged data, we now conduct regression-based tests to corroborate our results. Consider the following rela- tionship between the actual exchange rate in country c and year
  • 12. t (Set) and the corresponding price ratio Pet -= P c t / P t * : ( 2 ) log S a = o~ + / 3 log p ~ , where the PPP hypothesis implies a zero intercept term and a unit slope coefficient (o~= 0, / 3 = 1). The regression results are presented in Table 1. II Overall, Eq. ( 2 ) appears to model short-term PPP very well. 12 We subse- TABLE 1. Regression results: exchange rates and prices (standard errors in parentheses) Year PPP M o d e l N u m b e r o f Intercept Slope A d j u s t e d S.E. observations R 2 I. Cross-country 1986 A b s o l u t e 14 0.124 (0.118) 0.915 (0.046) 0.968 0.318 1985/1986 Relative . . . . . . . 1987 A b s o l u t e 8 - 0 . 2 2 5 (0.087) 0.953 (0.026) 0.995 0.183 1986/1987 Relative 7 - 0 . 0 5 2 (0.012) 0.167 (0.080) 0.358 0.031 1988 A b s o l u t e 16 0.180 (0.116) 0.958 (0.035) 0.980 0.353 1987/1988 Relative 7 - 0 . 3 7 6 (0.207) - 0 . 6 5 3 (0.557) 0.058 0.044 1989 A b s o l u t e 17 - 0 . 0 1 0 (0.145) 0.991 (0.037) 0.978 0.427 1988/1989 Relative 16 - 0 . 2 6 3 (0.033) 1.635 (0.088) 0.958 0.093 1990 A b s o l u t e 18 - 0 . 0 1 4 (0.135) 0.953 (0.041) 0.969 0.422 1989/1990 Relative 17 0.002 (0.033) 1.075 (0.022) 0.993 0.132
  • 13. 1991 A b s o l u t e 19 - 0 . 0 6 3 (0.128) 0.964 (0.039) 0.972 0.388 1990/1991 Relative 18 - 0 . 0 4 8 (0.033) 0.879 (0.115) 0.771 0.127 1992 A b s o l u t e 22 - 0 . 0 7 3 (0.154) 0.990 (0.042) 0.964 0.485 1991/1992 Relative 18 - 0 . 1 9 1 (0.083) 2.155 (0.184) 0.889 0.317 1993 A b s o l u t e 24 - 0 . 0 4 8 (0.112) 0.987 (0.029) 0.981 0.392 1992/1993 Relative 20 0.036 (0.026) 0.798 (0.030) 0.974 0.112 1994 A b s o l u t e 31 - 0 . 0 2 8 (0.103) 1.010 (0.025) 0.982 0.360 1993/1994 Relative 23 0.053 (0.022) 0.850 (0.025) 0.981 0.103 II. C r o s s - c o u n t r y / t i m e - s e r i e s 1986-1994 A b s o l u t e 169 - 0 . 0 1 7 (0.042) 0.981 (0.012) 0.977 0.388 Relative 126 0.002 (0.024) 1.000 (0.031) 0.896 0.272 III. Average over time 1986-1994 A b s o l u t e 34 - 0 . 0 1 8 (0.094) 1.001 (0.024) 0.982 0.347 Relative 26 0.003 (0.014) 1.127 (0.032) 0.980 0.073 869 Burgernomics: the economics o f the Big Mac standard: Li Lian Ong quently run the regression using country data averaged over time, such that log
  • 14. So° = o~ + / 3 log Pc.. T h e results suggest that P P P holds as a long-run proposi- tion. ~3 Previously, we e m p l o y e d P P P in terms of levels which is also known as absolute P P P . W e now e m p l o y the relative version of P P P which is in first differences, i.e. Alog Set = a ' + / 3 'Alog Pc,, w h e r e Pc~ = P ~ J P * , as before. The use o f first differences accounts for the proven I(1) p r o p e r t y o f exchange rates. ~4 As with the absolute P P P regressions, we estimate the relative P P P m o d e l for each year's d a t a as well as for the p o o l e d data. W e also consider the use o f averaged data. ~ O u r results from using p o o l e d data s u p p o r t the use o f Big M a c prices for making P P P comparisons. Thus, o u r findings once again show that Big M a c P P P holds over the long-term. O u r findings to this point indicate that Big M a c P P P generally holds for o u r sample countries, b o t h on a year-by-year basis and averaged over 9 years. However, these results are not without exception. In certain cases, exchange rates have b e e n f o u n d to deviate significantly from parity. W e will now briefly discuss the different possibilities as to h o w these deviations could o c c u r in the context of o u r research. P P P theory assumes that there are no barriers to trade. It has long b e e n
  • 15. recognised that such barriers prevent arbitrage from taking place and lead to d e p a r t u r e s from parity. 16 In the case of a Big Mac, for instance, the cost o f i m p o r t e d b e e f in J a p a n (which accounts for nearly 80% o f the ingredients in a Big Mac) includes a 50% tariff. 17 Big Mac prices could also b e distorted by high taxes in countries such as D e n m a r k and Sweden and inflated p r o p e r t y costs in H o n g Kong, J a p a n and Singapore, which could exaggerate the degree o f d e p a r t u r e f r o m parity for these currencies. It has also o f t e n b e e n held that the failure o f the law o f one price is due, in large part, to systematic attempts by firms operating in international markets to stabilise destination m a r k e t prices, when nominal exchange rates change, in o r d e r to p r o t e c t m a r k e t share. ~s A n o t h e r reason for observed d e p a r t u r e s from Big M a c P P P is the 'status symbol' argument, which suggests that in certain countries, fast-food chains in general (and the M c D o n a l d ' s franchise in particular) are rarities and are thus able to c o m m a n d a m o n o p o l y p r e m i u m over o t h e r commodities. This is n o t the case in the U S w h e r e intense competition from o t h e r fast-food chains w o u l d serve to k e e p margins slim. A further i m p o r t a n t reason for deviations from P P P is the existence o f productivity differences b e t w e e n countries, m e n t i o n e d earlier. This will b e investigated in the next two sections.
  • 16. III. Is the Big M a c all tradeable? H a r r o d (1939) argues that P P P holds true for t r a d e d goods ( T ) only, as the prices o f these goods are purcly thc effect of exchange rate movements. Accordingly, these prices should not vary outside the limits sct by transporta- tion costs and tariffs. T h e r e f o r e P P P should no longer hold o n c c n o n - t r a d e d goods ( N ) are taken into account, sincc they are not expected to have the same prices in different countries except u n d e r spccial circumstances. Balassa (1964) subsequently formalises H a r r o d ' s exposition by looking at deviations f r o m P P P 870 Bu~ernomics: the economics of the Big Mac standard: Li Lian Ong in the context o f productivity biases. H e finds that m a r k e d productivity differ- entials in T b e t w e e n 'rich' and ' p o o r ' countries, along with wage equalisation within each economy, cause the prices o f T in terms of N to b e c h e a p e r in the richer economies. W e will use this a p p r o a c h as a basis for slicing the Big M a c into its T and N components. Clements and Frenkel (1980) take the price level to b e a linear
  • 17. h o m o g e n e o u s ( C o b b - D o u g l a s ) function of the prices of n o n - t r a d e d goods, P!v, and t r a d e d goods, PT, with weight ~ given to N: ( 3 ) e - ". 1 - . - P , ~ PT , w h e r e 0 < ce < 1 Thus, if P P P applies to T only, then S = P r / P ~ and it follows that (45 P r = S . P ~ . By rewriting Eq. ( 3 ) for the foreign country and rearranging b o t h versions o f the equation, we are then able to substitute P r and P.~ in Eq. (4) to obtain ( 5 ) S = ( P r / P N ) " . P--- ( p . ~ / p ~ ) " " p * • Looking at Eq. ( 5 ) , we can see that the ( P T / P N ) a t e r m b e c o m e s smaller, on the basis o f a simple P P P calculation, as T b e c o m e s relatively c h e a p e r to N in the rich country, as explained by the P B H . In o t h e r words, since N e n t e r into the calculation o f PPP, via the overall price level, b u t do not directly affect exchange rates, the currency of the richer country will a p p e a r to b e 'overval- ued'. C o n s i d e r also the Clements and S e m u d r a m (1983) relationship b e t w e e n relative prices and G D P p e r capita: 1~
  • 18. ( 6 ) log ~ = A + 0 5 1 o g G D P . W e rewrite Eq. ( 6 ) for the foreign e c o n o m y and substitute b o t h versions o f the equation into the logarithmic form o f Eq. ( 5 ) to obtain ( 7 ) log S = 3 , + / 3 log G D P - / 3 * log G D P * + log ~ , w h e r e 3/= c~A - c~*A*, /3 = c~05 and /3* = a'05". Assuming for expository pur- p o s e s that ~ = ~* and 05= 05*, /3 would then b e equal to /3*. W e also i n c o r p o r a t e the definition in Eq. ( 1 ) so that Eq. ( 7 ) b e c o m e s , ( G D P ~ ( 8 ) r = y ' + / 3 l o g i c ) , w h e r e 7 ' = - ~ and /3' = - / 3 . 2o As the coefficient /3 = o~05, with 0 < a < 1 and 05 < 0, we expect 13 < 0 and /3' > 0. The estimates of Eq. ( 8 ) are given in Table 2 . 21 The estimate o f /3' in Table 2 indicates that, on average, a 10% growth in G D P causes a 2 % appreciation o f the currency in real terms. Recall that o n e of the structural p a r a m e t e r s o f this m o d e l is o~, the share o f non-tradeables in 871
  • 19. Burgemomics: the economics o f the Big Mac standard." Li Lian Ong TABLE 2. Regression results: currency valuation and G D P c r o s s - c o u n t r y / t i m e - s e r i e s , 1986-1994 (standard errors in parentheses) , [ G D P I n t e r c e p t coefficient y ' Coefficient of relative G D P / 3 ' A d j u s t e d R 2 S t a n d a r d error of estimate 0.259 (0.026) 0.240 (0.023) 0.415 0.266 total costs. As the coefficient /3' = - a4,, we can obtain an estimate o f a given estimates o f /3' and ~b. We use the Clements a n d S e m u d r a m (1983) estimate (h = - 0.256 to derive ~ = 0.937. Thus, the n o n - t r a d e d c o m p o n e n t in a Big Mac accounts for approximately 94% o f its price. This figure appears reasonable given the p r o m i n e n c e o f wages, rent, o t h e r overheads, etc. in the cost o f a Big Mac. IV. Improving the Big Mac Index: the No-Frills Index As previously discussed, PPP t h e o r y needs to bc extended to take account o f n o n - t r a d e d goods. O u r calculations in t h e previous
  • 20. section indicate that, on average, non-tradcablcs account for approximately 94% o f the h a m b u r g e r prices. Since these goods play only a very small part in determining exchange rates, they should be excluded in a m o r e sophisticated PPP calculation. We pursue this idea in this section by introducing the No-Frills Index (NFI) in which the non-tradeables arc excluded from t h e Big M a c Index (BMI). We rewrite Eq. (4) in logarithmic form to r e p r e s e n t t h e PPP condition: (9) log S = log PT -- log P~ = f ( l o g P , log GDP) - f * (log P * , log GDP*) g ( l o g ~ - . , ' G D P , = In the above, the second line reflects Eqs. (3) a n d ( 6 ) and their foreign-coun- try counterparts. The third line invokes (i) a h o m o g e n e i t y assumption that prices at h o m e relative to those abroad affect the exchange rate; and (ii) an assumption that the relevant p a r a m e t e r values are identical in the two coun- tries (o~ = a * and ~h = ~b*, in the notation o f Section III). Once we have an estimate o f the p a r a m e t e r s o f t h e function g (-, .) in Eq. (9), we can estimate the NFI as log S = ~ (log P/P*, log GDP/GDP*). It can be shown that the N F I is c o m p u t e d as log S -- log S - k,
  • 21. w h e r e S is the actual exchange rate and k is the residual from regression (8). 22 A n o t h e r way o f visualising the N F I is that it incorporates the systematic relationship b e t w e e n departures from parity according to t h e B M I and GDP; this relationship is t h e productivity bias Eq. (8). F o r illustration purposes, Table 3 presents t h e N F I 872 Burgernomics: the economics o f the Big Mac standard: Li Lian Ong TABLE 3. A c t u a l e x c h a n g e r a t e s , t h e Big M a c I n d e x a n d t h e N o - F r i l l s I n d e x C o u n t r y L o g a r i t h m i c A c t u a l e x c h a n g e r a t e (1) L o g a r i t h m i c d i f f e r e n c e s x 100 Big M a c N o - F r i l l s A c t u a l E R - A c t u a l E R - B M I - I n d e x I n d e x B M I N F I N F I
  • 22. (2) (3) (4) = (1) - (2) (5) = (1) - (3) (6) = (2) - (3) 1994 A r g e n t i n a 0.00 0.45 0.47 - 4 5 . 1 1 - 4 7 . 3 0 - 2 . 2 0 A u s t r a l i a 0.35 0.07 - 0.09 28.30 44.18 15.88 A u s t r i a 2.48 2.69 2.47 - 20.97 1.96 22.94 B r i t a i n - 0.38 - 0.24 - 0.39 - 13.94 0.81 14.75 C a n a d a 0.33 0.22 0.04 11.42 28.47 17.05 C h i l e 6.03 6.02 6.23 0.48 - 20.38 - 20.87 C h i n a 2.16 1.36 2.10 79.98 6.16 - 7 3 . 8 2 D e n m a r k 1.90 2.42 2.16 - 5 1 . 5 3 - 2 5 . 5 2 26.01 F r a n c e 1.76 2.08 1.87 - 32.14 - 10.89 21.25 G e r m a n y 0.54 0.69 0.49 - 15.67 5.03 20.69 G r e e c e 5.53 5.60 5.60 - 7.30 - 7.75 - 0.45 H o l l a n d 0.65 0.86 0.66 - 21.58 - 1.66 19.92 H u n g a r y 4.63 4.30 4.49 33.77 14.93 - 18.85 I t a l y 7.40 7.59 7.43 - 18.68 - 2.82 15.86 J a p a n 4.64 5.14 4.80 - 49.14 - 15.88 33.26 M a l a y s i a 0.99 0.49 0.72 49.48 26.79 - 22.70
  • 23. M e x i c o 1.21 1.26 1.45 - 4 . 6 5 - 2 3 . 7 6 - 19.11 P o l a n d 10.02 9.51 9.82 50.95 19.48 - 31.47 P o r t u g a l 5.16 5.25 5.28 - 9.32 - 12.27 - 2.95 R u s s i a 7.48 7.14 7.47 34.19 1.64 - 32.54 S i n g a p o r e 0.45 0.26 0.04 18.87 41.20 22.33 S o u t h K o r e a 6.70 6.91 6.92 - 21.07 - 22.53 - 1.46 S p a i n 4.93 5.01 4.94 - 8.34 - 1.62 6.72 S w e d e n 2.08 2.41 2.20 - 33.13 - 12.01 21.12 S w i t z e r l a n d 0.36 0.91 0.58 - 54.36 - 21.88 32.48 T h a i l a n d 3.23 3.04 3.36 19.25 - 12.58 - 31.83 M e a n - 3.09 - 1.85 1.23 S t a n d a r d e r r o r o f m e a n 6.76 4.21 5.08 t - s t a t i s t i c - 0.46 - 0.44 0.24 for 1994, as well as the test statistics for that year. N o t e that for China, one o f the poorest countries in the sample, the deviation o f the BMI from the actual exchange rate is approx. 80%; when the NFI is used, the deviation falls to approx. 6%. We find that, on average, the excess o f the BMI over its No-
  • 24. Frills counter- part is approx. 10%, over the 1986-1994 period. 23 In other words, the BMI undervalues currencies by 10%, on average. Consequently, if The Economist magazine wishes to make some rough adjustments to its BMI to allow for productivity bias, a simple approach would be to add 10% to its estimates o f currency values, especially for the poorer countries. 873 Burgernomics: the economics o f the Big Mac standard: Li Lian Ong V. Summary and conclusion The Economist magazine is considered the most influential and prestigious financial n e w s p a p e r in the world. In view o f its well- known breezy style which has b e e n described as 'simplify and then exaggerate', one suspects that w h e n the editor first i n t r o d u c e d the Big Mac Index in 1986, it was a s o m e w h a t tongue-in-cheek contribution to what is perhaps the m o s t widely-researched and d e b a t e d doctrine in international finance. M a n y years later, the Big M a c Index is still going strong and is now widely cited and u s e d by academics and practitioners alike. Given the competitive nature o f publishing, one would
  • 25. assume that the survival o f the index would have to be b a s e d on s o m e intrinsic merit and usefulness o f the m e a s u r e in judging the long- term value o f curren- cies. O u r test results d e m o n s t r a t e that the Big M a c Index is surprisingly accurate in tracking exchange rates o v e r the longer-term, which is consistent with previous findings. The regression tests indicate that purchasing p o w e r parity holds with the Big M a c Index over a 9-year horizon. H o w e v e r , this is n o t to say that the currencies o f all individual countries for all years are at parity. G e o g r a p h i c influences a p p e a r to play a part in those instances w h e r e devia- tions from parity occur. F o r example, the currencies o f developing Asian and East E u r o p e a n countries are consistently undervalued, while the currencies o f the industrialised e c o n o m i e s are overvalued, on average. The versatility o f the Big M a c Index notwithstanding, we are still able to improve on it by taking into account the existence o f productivity bias b e t w e e n countries. As it is well known, services are relatively c h e a p e r in p o o r e r countries and because these goods have little, if any, role in determining exchange rates, standard P P P calculations which include services tend to show that the currencies o f these countries are systematically undervalued. In o t h e r
  • 26. words, these deviations from parity are related to income. W e confirm the existence o f this productivity bias in the Big Mac Index and subsequently introduce the new No-Frills Index to solve the problem. T h e n e w index excludes the n o n - t r a d e d c o m p o n e n t o f Big Mac h a m b u r g e r s in computing parity. Interestingly, we estimate that this c o m p o n e n t accounts for as much as 94% o f the cost o f a Big Mac. O u r new results indicate that the No-Frills Index p e r f o r m s even b e t t e r than the Big Mac Index, especially for the p o o r e r countries and could b e o f use to practitioners and policy- makers. Notes 1. The origins of PPP theory are analyzed in detail by Frenkel (1976) and Officer (1982). 2. Studies by A d l e r and Lehmann (1983), Huizinga (1987) and Meese and Rogof~ (1988) are unable to reject the hypothesis that real exchange rates follow a r a n d o m walk under the floating exchange rate regime. However, recent studies by A b u a f and Jorion (1990), D i e b o l d et al. (1991) and Lothian (1990) find evidence o f mean-reverting behavior in real exchange rates using long-term time series data. O t h e r research into real exchange rate behavior during the float include Dornbusch (1987), F r a n k e l and M e e s e (1987), M e e s e (1990) and Officer (1976). Recent surveys o f the literature are provided by
  • 27. Lothian (1997), R o g o f f (1996) and Taylor (1995). 874 Burgernomics: the economics of the Big Mac standard: Li Lian Ong 3. F r o o t and R o g o f f (1994) and Officer (1982) provide comprehensive reviews o f the l i t e r a t u r e in this area. 4. As an example, consider a two-country, two-good (traded and non-traded, T and N ) world, where one country is rich and the o t h e r poor. Let the rich country be m o r e productive in the production of both T and N. Although this country has an absolute advantage in both goods, it is plausible to postulate that it is relatively m o r e productive in T. The reason lies in the nature of N which have large service c o m p o n e n t s and are labor-intensive. Thus, productivity improvements are m o r e difficult in these areas. Consequently, the relatively higher productivity o f T in the rich country means that their relative prices will be c h e a p e r in the rich country (in terms of N). 5. The mechanics of this concept are discussed in further detail in Section III. O t h e r research into the PBH include Bartolini (1995) and Clemcnts and S e m u d r a m (1983). 6. See Summers and H e s t o n (1991) for a description of the
  • 28. data. 7. T h e r e have been strong criticisms o f the reliability of the ICP method, however. They include the fact that (i) world average prices are used to value the G D P c o m p o n e n t s , which means that since world average prices are d o m i n a t e d by the larger weights o f rich countries, price weights that are not reflective of the low- income countries t e n d to push up their relative quantity indices (Isenman, 1980); (ii) the ICP prices ' c o m p a r i s o n resistant' services, which have no identifiable unit of output which could be easily priced (Maddison, 1983); and (iii) ICP d a t a are only g a t h e r e d at 5-year intervals (beginning in 1970) and country coverage is limited, which means that data from n o n - b e n c h m a r k years and countries must be o b t a i n e d by extrapolation; moreover, there is also a long time lag between collection of the d a t a and their availability (Rogoff, 1996). 8. The Big Mac hamburger is p r o d u c e d locally in more than 80 countries a r o u n d the world, with only minor changes in recipe. It is 95 mm in diameter, weighs 205 g and generally uses the same ingredients everywhere - - two b e e f patties, a special sauce, lettuce, cheese, pickles and a sesame-seed bun ( L o o k Japan, June 1994). As well as being a ' s t a n d a r d product', this means that its local prices are less likely to be d i s t o r t e d by international t r a n s p o r t a t i o n and distribution costs. 9. t-test results indicate that the majority of the W e s t e r n
  • 29. and Central E u r o p e a n currencies a p p e a r to deviate significantly from parity at the 0.1% level. Only I r e l a n d is at parity with the US. In the A m e r i c a s group, parity with the US is achieved by Mexico and Brazil, while Canada, surprisingly, deviates from its North A m e r i c a n neighbour at the 5% level. This result could perhaps be explained by Engel and Rogers' (1995) finding that crossing the US C a n a d i a n b o r d e r is equivalent to adding 7182 miles between two cities in the same country, in the context o f price differences between locations. Meanwhile, all the A S E A N - O c e a n i a currencies are significantly undervalued. Results of t-tests for parity by region indicate that except for Western and Central E u r o p e which is significantly overvalued, all o t h e r regions are, on average, either undervalued or at parity with the US. The currencies o f A S E A N - O c e a n i a and Eastern E u r o p e are significantly undervalued by approx. 28%, while the null hypothesis of PPP holds for the A m e r i c a s and East Asia. These findings are explained to some extent by F r a n k e l and W e i ' s (1995) research into the existence o f currency blocs. Finally, the t-statistic for the entire sample indicates that the currencies, averaged over time and countries, deviate significantly from parity at the 5% level. 10. Results of t-tests seem to imply that the over- or under- valuation of each currency, with respect to the US dollar, t e n d to offset one another on an annual basis. W i t h the exception o f 1987, when the US dollar is significantly
  • 30. undervalued at the 1% level, it a p p e a r s that the US dollar is m o r e or less at parity in each year. Cumby (1996) finds that deviations from Big Mac PPP are useful for forecasting exchange rates. A f t e r account- ing for currency-specific constants, a 10% undervaluation in 1 year, according to the Big Mac Index, is associated with a 3.5% appreciation over the following year. 11. Initially, we estimate Eq. ( 2 ) for each year, using cross- country data; the results are given in the first part o f Table 1. The adjusted R 2 figures indicate a very significant relationship between the implied and actual exchange rates on a year-by-year basis. The hypotheses of a zero intercept, a unit slope coefficient and the joint hypothesis o f a z e r o 875 Burgernornics: the economics of the Big Mac standard." Li Lian Ong intercept and unit slope coefficient cannot be rejected for any 1 year, except for 1986 and 1987. Next, we pool the data over time and across countries; the results are p r e s e n t e d in the second part o f Table 1. In this case, both the null hypotheses, when taken separately, cannot be rejected. However, the joint hypothesis is rejected at the 5% level o f significance.
  • 31. 12. F r a n k e l and R o s e (1995), H a k k i o (1984) and Oh (1996) show that the higher variability in cross-sectional data, relative to time-series data, allows for m o r e precise p a r a m e t e r estimates in tests of PPP. Similarly, Cumby (1996) d e m o n s t r a t e s that a larger cross-sec- tion yields enough power to detect substantial mean-reversion in his tests of Big Mac PPP. H e finds little persistence in deviations from Big Mac PPP, with only 30% o f deviations persisting into the following year 13. As can be seen in the third part of Table 1, the adjusted R 2 remains very high at 98%. The intercept and slope coefficient are not significantly different from zero and unity, respectively, while the joint hypothesis for the slope and intercept also cannot be rejected. This finding of long-run PPP is consistent with the results o f A b u a f and Jorion (1990), D i e b o l d et al. (1991), Frenkel (1981), Lothian (1990) and Officer (1976). M a n z u r (1990) shows that the long-run in PPP terms is 5 years. 14. See Blundell-Wignall et al. (1993), Edison and Pauls (1993) and F r o o t and Rogoff (1994). Note that as our d a t a observations are both across countries and over time, non-stationarity may not be such a problem as c o m p a r e d with the situation with pure time-series data. 15. The results o f the relative parity regressions o f annual data are given in the first part o f Table 1. With the exception of 1986/1987 and 1987/1988, we find the adjusted R - to be
  • 32. very high for each year. However, the joint hypothesis o f a zero intercept and unit slope is rejected for all years except 1990/1991. The j o i n t hypothesis is also rejected when averaged d a t a are used. W h e n the d a t a are pooled across countries and over time, the adjusted R 2 is approx. 90%. In this instance, both the null hypotheses of a zero i n t e r c e p t / u n i t slope coefficient as well as the joint hypothesis cannot be rejected. 16. See H a r r o d (1939). 17. Look Japan, June 1994. 18. Firms are said to ' p r i c e to m a r k e t ' when they charge different local prices across export markets to reflect the particular local competitive situation; any exchange rate move- ment is a b s o r b e d by altering the home currency export price (Ghosh and Wolf, 1994). Cumby (1996) finds that relative local currency prices a p p e a r to adjust to reduce deviations from Big Mac PPP. 19. Using the price of haircuts in 24 countries to measure the price of N, they find a strong positive association between the price of a haircut and the GDP. They estimate the income elasticity o f the relative price of T, as r e p r e s e n t e d by the regression coefficient ~/, in Eq. ( 6 ) , as being equal to - 0 . 2 5 6 , with s t a n d a r d e r r o r 0.061. Their finding that N become relatively more expensive with increasing income is consistent with the PBH. 20. Note that the negative o f r, as defined in Eq. (1), is the
  • 33. conventional definition of the real exchange rate. 21. To estimate Eq. ( 8 ) , we use the d a t a on r, calculated in Section I, and G D P figures o b t a i n e d from the International Financial Statistics of the International M o n e t a r y F u n d (1996). Observations are omitted in instances where G D P d a t a are unavailable. 22. See Ong (1995). 23. Not shown in Table 3; see Ong (1995) for calculation details. R e f e r e n c e s Abuaf, N. and Jorion, P. (1990) Purchasing power parity in the long run. Journal o f Finance 35, 157-174. Adler, M. and Lehmann, B. (1983) Deviations from purchasing power parity in the long run. Journal o f Finance 38, 147-187. 876 Burgernomics: the economics of the Big Mac standard: Li Lian Ong Balassa, B. (1964) The purchasing-power parity doctrine: a reappraisal. Journal of Political Economy 72, 584-596. Bartolini, L. (1995) Purchasing power parity measures of
  • 34. competitiveness. Finance and Development 32, 46-49. Betton, S., Levi, M. D. and Uppal, R. (1995) Index-induced errors and purchasing power parity: bounding the possible bias. Journal of" International Financial Markets, Institutions and Money 5, 165 179. BlundelI-Wignall, A., Fahrer, J. and Heath, A. (1993) Major influences on the Australian dollar exchange rate. The Exchange Rate, hlternational Trade and the Balance of Payments. Proceedings o f a Conference held at the H, C. Coombs Centre for Financial Studies, Kirribilli. Clements, K. W. and Frenkel, J. A. (1980) Exchange rates, money, and relative prices: the dollar-pound in the 1920s. Journal of International Economics 10, 249-262. Clements, K. W. and Semudram, M. (1983) An international comparison of the price o f nontraded goods. Weltwirtschaftliches Archiv 119, 356-363. Cumby, R. (1996) Forecasting exchange rates on the hamburger standard: what you see is what you get with McParity. N B E R Working Paper Series, No. 5675, National Bureau o f Economic Research. Diebold, F. X., Husted, S. and Rush, M. (1991) Real exchange rates under the gold standard. Journal of Political Economy 99, 1252-1271.
  • 35. Dornbusch, R. (1987) Purchasing power parity. In The New Palgrave: A Dictionary o f Economics, eds J. Eatwell, M. Milgate and P. Newman, pp. 1075 1085. Macmillan, London. Edison, H. J. and Pauls, B. D. (1993) A re-assessment of the relationship between real exchange rates and real interest rates: 1974-1990. Journal of Monetary Economics 31, 165-187. Engel, C. and Rogers, J. H. (1995) How wide is the border? International Finance Discussion Papers, No. 498, Board of Governors of the Federal Reserve System. Frankel, J. A. and Meese, R. (1987) Are exchange rates excessively variable? In NBER MacroeconomicsAnnual, ed Stanley Fischer, pp. 117 153. M I T Press, Cambridge, MA. Frankel, J. A. and Rose, A. K. (1995) A panel project on purchasing power parity: mean reversion within and between countries. N B E R Working Paper Series, No. 5006, National Bureau of Economic Research. Frankel, J. A. and Wei, S.-J. (1995) Is a yen bloc emerging? In Economic Cooperation and Challenges in the Pacific, ed R. Rich, pp. 145-175. Korea Economic Institute o f America, Washington, DC. Frenkel, J. A. (1976) A monetary approach to the exchange rate: doctrinal aspects and
  • 36. empirical evidence. Scandinavian Journal o f Economics 78, 200-224. Frenkel, J. A. (1981) The collapse of purchasing power parities during the 1970s. European Economic Review 16, 145-165. Froot, K. A. and Rogoff, K. (1994) Perspectives on PPP and long-run real exchange rates. In Handbook of huernational Economics, eds G. Grossman and K. Rogoff, Vol. 3, pp. 1647-1688. North-Holland, Amsterdam. Ghosh, A. R. and Wolf, H. C. (1994) Pricing in international markets: lessons from The Economist. N B E R Working Paper Series, No. 4806, National Bureau of Economic Research. Hakkio, C. S. (1984) A re-examination of purchasing power parity: a multi-country and multi-period study. Journal of hzternational Economics 17, 265- 277. Harrod, R. F. (1939) h~ternational Economics. Nisbet, Cambridge. 877 Bungemomics: the economics of the Big Mac standard: Li Lian Ong Huizinga, J. (1987) An empirical investigation of the long-run behavior of real exchange
  • 37. rates. In Carnegie-Rochester Series on Public Policy, eds K. Brunner and A. Meltzer, Vol. 27, pp. 149-215. International Monetary Fund (1996) bzternational Financial Statistics Yearbook, 1996. International Monetary Fund, Washington, DC. Isenman, P. (1980) Inter-country comparison of 'real' (PPP) incomes: revised estimates and unresolved questions. World Development 8, 61-72. Kravis, I. B. (1986) The three faces of the International Comparison Project. Research Observer 1, 3-26. Look Japan, Vol. 40, No. 459. Look Japan, Tokyo. Lothian, J. R. (1990) A century plus of Japanese exchange rate behavior. Japan and the World Economy 2, 47-70. Lothian, J. R. (1997) Multi-country evidence on the behavior of purchasing power parity under the current float. Journal of International Money and Finance 16, 19-36. Maddison, A. (1983) A comparison of the levels of GDP per capita in developed and developing countries, 1790-1980. Journal of Economic History 43, 27-41. Manzur, M. (1990) An international comparison of prices and exchange rates: a new test of purchasing power parity. Journal of International Money and Finance 9, 75-91.
  • 38. Meese, R. (1990) Currency fluctuations in the post-Bretton Woods period. Journal of Economic Perspectives 4, 117 134. Meese, R. and Rogoff, K. S. (1988) Was it real? The exchange rate-interest differential relation over the modern floating-rate period. Journal of Finance 43, 933-948. Officer, L. H. (1976) The purchasing-power-parity theory of exchange rates: a review article. bzternational Monetary Fund Staff" Papers 23, 1 60. Officer, L. H. (1982) Purchasing Power Parity and Exchange Rates: Theory, Evidence and Relevance. JAI Press, Connecticut. Oh, K.-Y. (1996) Purchasing power parity and unit root tests using panel data. Journal of huernational Money and Finance 15, 405-418. Ong, L. L. (1995) Burgernomics: The economics of the Big Mac standard. Working Paper, No. 95-52, Department of Accounting and Finance, The University of Western Australia. Pakko, M. R. and Pollard, P. S. (1996) For here or to go? Purchasing power parity and the Big Mac. Federal Reserve Bank of St. Louis Review 78, 3-21. Rogoff, K. (1996) The purchasing power parity puzzle. Journal of Economic Literature 34, 647-668. Samuelson, P. A. (1964) Theoretical notes on trade problems. Review of Economics and
  • 39. Statistics 46, 145-154. Summers, R. and Heston, A. (1991) The Penn World Table (Mark 5): an expanded set of international comparisons, 1950-1988. Quarterly Journal of Economics 106, 327-368. Taylor, M. P. (1995) The economics of exchange rates. Journal of Economic Literature 33, 13 47. The Economist, Vol. 300, No. 7462; Vol. 307, No. 7544; Vol. 311, No. 7598; Vol. 315, No. 7653; Vol. 319, No. 7702; Vol. 323, No. 7755; Vol. 327, No. 7807; Vol. 327, No. 7811; Vol. 331, No. 7858; Vol. 336, No. 7929. The Economist Newspaper, London. 878 The Big Mac Index • Topic: The Big Mac Index Write an essay more than 1000 words, excluding reference, explaining the Big Mac Index and its advantages and limitations in measuring PPP. Describe the possible cause(s) of the failure of PPP that you learned in the lecture. Also, examine the
  • 40. conclusion from The Economist (article link below) that “[t]he Chinese yuan, for example, is 44% undervalued against the dollar”. The following articles can help you with the essay: – http://www.economist.com/news/finance-and- economics/21714392-emerging-market- currenciesand-euro-look-undervalued-against-dollar-our-big – Ong, L.L., 1997. Burgernomics: the economics of the Big Mac standard. Journal of International Money and Finance, 16(6), pp.865-878. You are encouraged to search for more references or materials. The reference should be in Harvard style.