2. ventional cement‐based mortar and concrete has been widely investi-
gated by researchers (Lazaro et al. 2016; Shahbazpanahi et al. 2021a).
Generally, nanotechnology is the monitoring capability and restruc-
ture of the matter at the atomic and molecular levels in the area of 1
to 100 nm, and contribution to the distinguished characteristics and
phenomena at that size as equivalent to those correlating with single
atoms and molecules or bulk behavior (Zhu et al. 2004; Sharif,
2021; Faraj et al. 2022).
In the past, various researches were carried out to study different
characteristics of SCMs containing different types of NPs
(Madandoust et al. 2015; Mohseni et al. 2015; Kadhim et al. 2020;
Khotbehsara et al. 2015; Miyandehi et al. 2014). Among the various
NPs used in the previous investigations, nano SiO2 (NS) is the most
popular. Other types of NPs used in the literature include Nano
Al2O3 (NA) (Mohseni et al. 2015; Mohseni and Tsavdaridis, 2016a;
Miyandehi et al. 2014), Nano TiO2 (NT) (Mohseni et al. 2015;
Mohseni et al., 2016b; Rao et al. 2015), Nano Fe2O3 (NF)
(Madandoust et al. 2015), Nano CuO (NC) (Khotbehsara et al. 2015;
Mohseni et al. 2015), Nano cement kiln dust (NCKD) (Kadhim et al.
2020), Nano ZnO2 (NZn) and Nano Cr2O3 (NCr) (Yang et al. 2015).
The main reason for adding NPs into all types of concrete compos-
ites, including SCM and SCC is to enhance the microstructural charac-
teristics of the concrete composite. As a result, it would improve all
other composite properties, namely mechanical and physical proper-
ties and durability properties of the concrete composites (Balapour
et al. 2018). The main product in the hydration process between
cement and water is the calcium silicate hydrate (C‐S‐H) gel and cal-
cium hydroxide (C–H) crystals (Shahbazpanahi and Faraj, 2020;
Shahbazpanahi et al. 2021b). However, C–H crystals are an unwanted
product in the concrete composite matrix because they lead to some
drawbacks in the nearer future in the cement matrix and consequently
adversely affect the concrete performance. To tackle these problems of
C–H crystals in the concrete composite matrix, some researchers add
nano‐silica to the concrete composite to change the undesired C–H
crystals to the C‐S‐H gels in the chemical reaction process, namely poz-
zolanic reaction. As a result of this pozzolanic reaction, extra C‐S‐H gel
is generated, and the presence of C–H crystals is reduced inside the
concrete composite matrix; and finally, the performance and
microstructure of the concrete composite are improved (Thomas
et al. 2017).
This review study aims to investigate the influence of various NPs
inclusion on the fresh, strength, and durability performance of SCMs.
In the literature, no review paper was found to summarize the effect
of NPs on the performance of SCMs. Therefore, in this study, the pre-
vious researches were investigated to highlight the effects of NPs on
the most critical fresh, mechanical, and durability properties of SCMs
such as slump flow diameter, V‐funnel flow time, compression
strength, flexural strength, water absorption capacity, chloride pene-
tration, and electrical resistivity. Moreover, an empirical model among
strength properties is also developed. Moreover, a significant part of
this study is devoted to proposing systematic multiscale models to
forecast the CS of SCMs containing NPs. Various mixture proportions
and curing times were used as input parameters to develop reliable
models to predict the CS. Based on the best of the author's knowledge,
this is the first review paper on this topic, including a systematic
review, analysis, and modeling. This study encourages the construc-
tion industry to take advantage of nanotechnology to produce high‐
performance cement‐based materials that can be used to develop
improved infrastructure.
2. Properties of NPs and SCM mixes used in the literature
In this section, different types and properties of NPs used in the lit-
erature to improve the performance of SCMs are reported. Moreover,
additional information regarding the mixed proportions of SCMs made
with various types of NPs are present in Table 1. The amount of NPs
used in the mixed proportions of SCMs is between 0% and 5% replace-
ments with cement by weight. Higher amounts of NPs could diminish
their advantage due to their agglomeration inside the matrix, which
aggravates the fresh flow behavior of SCMs. The diameter of NPs var-
ied between 15 and 62.3 nm, with the surface–volume ratio ranging
from 50 to 230 m2
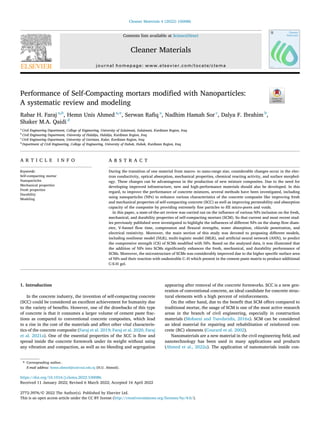
/g. The majority of the NPs shapes used in the pre-
vious studies are spherical as illustrated in Fig. 1, which explains the
nano CuO (NCu) particles using transmission electron micrographs
(TEM).
3. Properties of SCM containing different NPs
The main focus of this study is to review the fresh, strength, and
durability performance of SCMs made with different types of NPs.
Therefore, the following section reports the results obtained from pre-
vious studies and the proper discussion for each property will also
present.
3.1. Rheological and fresh properties
As mentioned previously, SCM is a mixture with a high flowability
compared to conventional mortar. Therefore, assessing this composite
in the fresh state is quite critical. The fresh and rheological behavior of
SCC and SCM can be assessed through the tests outlined in (EFNARC,
2002; ASTM C‐1437–2003). The most common tests to assess the fresh
behavior of SCMs are mini‐slump and V‐funnel.
For the mini‐slump test, the apparatus is in the cone shape, having
the dimensions (height = 60 mm, diameter at the base = 100 mm and
top diameter = 70 mm) as shown in Fig. 2a. The cone is filled with
SCM, then gently lifted upwards. As a result, the mortar spreads over
the steel base plate and the diameter of the spread mortar is recorded
in two opposite directions and the average is calculated as the diame-
ter for the test.
For the mini V‐funnel test, which is generally used to assess the fill-
ing ability and determine a proper water/ binder ratio for the SCM
mixtures, a mini funnel is poured with SCM mixture; the bottom gate
of the funnel is then opened and the time is start recording. When the
light first appeared by looking down into the funnel, the time is
stopped, and the flow time in seconds is recorded. Fig. 2b illustrates
the mini V‐funnel instrument and conducting the test.
3.1.1. Slump flow diameter
The experimental outcomes extracted from past investigations for
the SCMs containing different replacement percentages of NPs are pre-
sented in Fig. 3. The higher slump values mean the higher workability
for the SCM mixtures. The slump flow diameters of SCMs containing
different types of NPs reported in the literature varied between
240 mm and 260 mm, except the mixture contained NCKD, which
reported higher values (Kadhim et al. 2020). As shown in Fig. 3, except
for the NCKD, all other NPs had a similar influence on the slump val-
ues of SCMs. Slump flow diameter was slightly elevated with changing
the NPs percentage from 0% to 5%. Mohseni and Tsavdaridis (2016a)
investigated the impact of NA particles on the fresh performance of
SCMs. Three different proportions of NA particles (1, 3, and 5%) of
the binder content were incorporated. They observed that the slump
flow diameter increased slightly with increasing the NA particles con-
tent. The control mixture had a flow diameter of 245 mm, then it was
boosted to 250 mm when 5% of NA particles were utilized. Similar
observations for other types of NPs were also presented by other
researchers (Madandoust et al. 2015; Nasr et al. 2019; Mohseni et al.
2015). The main reason behind increasing the slump diameter value
due to the addition of NPs is that a higher amount of superplasticizer
is required for the mixtures made with NPs. Because the NPs had a
very high surface area compared to cement particles, it is expected
R.H. Faraj et al. Cleaner Materials 4 (2022) 100086
2
3. Table 1
Properties of NPs and SCM mixtures reported in the literature.
Refs. Composite types Cement replacement
with NPs: wt%
Binder content w/b ratio Curing time (days) Properties of NPs
Madandoust et al. 2015 SCM 0, 1, 2, 3, 4, 5 700 0.4 3, 7, 28, 90 days D (nm) = 15
SVR (m2
/g) = 200
Purity (%) > 99
D (nm) = 60
SVR (m2
/g) = 60
Purity (%) > 98
D (nm) = 15
SVR (m2
/g) = 200
Purity (%) > 99
Mohseni et al. 2015 SCM 0, 1, 3, 5 700 0.4 3, 7, 28, 90 days D (nm) = 15 ± 3
SVR (m2
/g) = 200
Purity (%) > 99
Mohseni and Tsavdaridis, 2016a SCM 0, 1, 3, 5 700 0.4 3, 7, 28, 90 days D (nm) = 15 ± 3
SVR (m2
/g) = 200
Purity (%) > 99
Mohseni et al., 2016b SCM 0, 1, 3, 5 700 0.4 3, 7, 28, 90 days D (nm) = 15 ± 3
SVR (m2
/g) = 200
Purity (%) > 99
Kadhim et al. 2020 SCM 0, 1, 2, 3, 4, 5 600 0.35 7, 28, 90 days D (nm) = 62.3
Purity (%) > 99.9
Khotbehsara et al. 2015 SCM 0, 1, 2, 3, 4 700 0.4 7, 28, 90 days D (nm) = 15 ± 3
SVR (m2
/g) = 165 ± 17
Purity (%) > 99.9
Khotbehsara et al. 2018 SCM 0, 1, 2, 3, 4, 5 700 0.4 3, 7, 28, 90 days D (nm) = 20 ± 3
SVR (m2
/g) = 200
Purity (%) > 99
Miyandehi et al. 2014 SCM 0, 1, 3, 5 700 0.4 3, 7, 28, 90 days D (nm) = 15
SVR (m2
/g) = 200
Purity (%) > 99.8
Nasr et al. 2019 SCM 0, 1, 2, 3, 4 550 0.5 3, 7, 28, 90 days D (nm) = 20–30
SVR (m2
/g) = 230
Purity (%) > 99
Rao et al. 2015 SCM 0, 0.5, 0.75, 1 700 0.43 7, 28, 90 days D (nm) = 20
SVR (m2
/g) = 260
0, 0.75, 1.5, 3 D (nm) = 20
SVR (m2
/g) = 50
Yang et al. 2015 SCM 0, 1, 2, 3, 4, 5 700 0.4 3, 7, 28, 90 days D (nm) = 15
SVR (m2
/g) = 200 ± 30
SVR = Surface to volume ratio, D = diameter.
Fig. 1. NCu particles observed using TEM (Khotbehsara et al. 2015).
R.H. Faraj et al. Cleaner Materials 4 (2022) 100086
3
4. Fig. 2. Rheological tests for measuring fresh properties of SCM: (a) mini slump, (b) v-funnel (Jalal et al. 2019).
Fig. 3. Slump flow values versus replacement amount of NPs reported in previous studies.
R.H. Faraj et al. Cleaner Materials 4 (2022) 100086
4
5. to reduce the slump diameter, and a higher amount of water is
required to hydrate the particles. However, adding a higher dosage
of superplasticizer compensated the effect of surface area and made
the mixtures higher slump values (Rao et al. 2015).
3.1.2. V-funnel Flow time
Fig. 4 reports the experimental results for the V‐funnel flow time of
SCMs containing different dosages of NPs obtained from past studies.
Opposite to slump flow diameter, higher times of V‐ funnel flow test
represents less workability because the mixture needs more time to
empty the funnel, which also means lower filling ability. As seen from
the Figure, different results were reported in the literature. Some
researchers reported that V‐funnel flow time was decreased with
increasing NPs content (Mohseni et al. 2015; Mohseni and
Tsavdaridis, 2016a; Kadhim et al. 2020; Miyandehi et al. 2014). How-
ever, the opposite results were also presented by other scholars (Rao
et al. 2015; Khotbehsara et al. 2018). Moreover, the fluctuated behav-
ior was also recorded by some investigators (Khotbehsara et al. 2015;
Madandoust et al. 2015). These different behaviors may be attributed
to different studies having different mixture variables and the amount
of NPs. For example, if the amount of superplasticizer was kept con-
stant, the V‐funnel flow time was elevated due to increasing the NPs
content because the mixture's viscosity was increased and the mixture
was more sticky, which requires higher time to empty the funnel (Rao
et al. 2015). However, if the superplasticizer dosage was increased
along with increasing the NPs content, the superplasticizer could com-
pensate for the effects of NPs; consequently, the V‐funnel flow time
was decreased, and the workability of the mixture increased
(Kadhim et al. 2020; Miyandehi et al. 2014).
3.2. Compressive and flexural strength
The compression strength (CS) results for the SCMs made with dif-
ferent NPs obtained from past studies are shown in Fig. 5. The results
demonstrated that the CS of SCMs was slightly improved with increas-
ing the NPs content up to a particular percentage replacement, regard-
less of the NPs type. Generally, Increasing NPs content beyond 3%
replacement by cement weight was no longer beneficial for improving
the CS. This can be explained since, when the amount of NPs is high,
the NPs cannot be dispersed well inside the matrix, and as a result,
weak zones are formed due to NPs agglomeration and aggregation,
causing the reduction of CS (Madandoust et al. 2015). The 28 days
CS was in the range of 37 to 49 MPa, which is suitable for most struc-
tural applications. The main reason behind the enhancement of CS
with the addition of NPs is that higher specific surface area of NPs
and their reaction with undesirable C–H which present in the cement
paste matrix to produce additional C‐S‐H, the microstructure of SCMs
was considerably enhanced, and the number of pores was reduced;
thus the compressive strength increased (Mohseni et al. 2015).
Fig. 6 shows the 28‐day flexural strength results of SCMs containing
various types and amounts of NPs. Research on the flexural strength of
SCMs made with NPs is limited compared to compressive strength, and
similar behavior for compressive strength was also reported for flexu-
ral strength. The addition of NPs slightly increased the flexural
strength (Kadhim et al. 2020; Miyandehi et al. 2014). Miyandehi
et al. 2014 found that the flexural strength was improved by about
13.8% when 3% of NA particles were added to the SCM mixture. They
also reported that this improvement might be because NA particles
could arrest cracks and interlocking influences between the slip planes;
as a result, the flexural strength was enhanced.
To find an empirical relationship between the flexural and CS,
the results obtained in the past studies are plotted in Fig. 7. As
can be seen from the Figure, a strong polynomial relationship with
the R2
equal to 0.79 existed between the compressive and flexural
strength. This empirical model can be helpful from the practical
point of view for determining flexural strength from compressive
strength since the flexural tests are not conducted commonly for
SCMs containing NPs.
Fig. 4. V-funnel flow times versus replacement amount of NPs reported in previous studies.
R.H. Faraj et al. Cleaner Materials 4 (2022) 100086
5
6. 3.3. Durability performance
3.3.1. Water absorption
Generally, the water absorption (WA) test evaluated the perfor-
mance against the penetration and retaining water. This test can be
performed according to the procedures reported in (ASTM C642,
2013). The procedure required that the samples be cured for 28 days,
then dried in an oven at a degree of 110 °C. Then the samples were
required to be immersed in water at nearly 21 °C for 48 h. Finally,
the saturated mass can be measured, and the WA can be determined.
The results of the previous studies regarding the water absorption
of SCMs containing NPs are presented in Fig. 8. The previous results
demonstrated that with the addition of NPs into SCM, the percentage
of water absorption was reduced slightly. Madandoust et al. 2015
Fig. 5. Compressive strength versus replacement amount of NPs reported in previous studies at 28 days.
Fig. 6. Flexural strength versus replacement amount of NPs reported in
previous studies at 28 days.
Fig. 7. Flexural strength versus compressive strength for SCMs containing
NPs.
R.H. Faraj et al. Cleaner Materials 4 (2022) 100086
6
7. investigated the impact of NS, NF and NC on the durability perfor-
mance of SCMs. They found that the inclusion of NPs reduced the
WA of the samples, excluding the samples made with 5% NS and 4%
NF. Compared to the reference sample, the highest percentage
decrease of WA was 6% for the samples included 4% NS, 4% for the
mixture containing 3% NF, and 9% for the mixture containing 3%
NC. This behavior demonstrated that for different types of NPs an opti-
mum percentage should be determined since further increase will not
be beneficial regarding the improvement of WA. The explanation for
this phenomenon is that, since the SVR was very high for all NP types,
aggregation and agglomeration of the particles occurred at higher per-
centage contents, causing non‐homogeneous dispersion of the NPs
inside the SCM mixes (Madandoust et al. 2015).
Moreover, Mohseni et al. 2015 found that the inclusion of 5% NT
resulted in the highest depletion of water absorption compared to
the same percentage replacements of NS and NA. Similar findings
for other types of NPs were also reported in different studies
(Khotbehsara et al. 2015; Nasr et al. 2019; Yang et al. 2015). The
reduction of water absorption due to the addition of NPs can be related
to the fact that the NPs had a very small particles diameter compared
to cement particles; thus, during hydration, they fill the small voids
between cement particles, resulting in the denser matrix.
3.3.2. Electrical resistivity
One of the most important tests that can measure concrete's dura-
bility is the electrical resistivity test. The electrical resistivity test
can measure and assess the sensitivity and resistance of SCMs to corro-
sion when a metal such as rebars is present inside the matrix. This test
can be conducted following the guidelines of (ACI 222, 2001) on cubic
samples with 50 mm dimensions, preferably after 90 days of curing.
The apparatus used for the test consisted of an electrical resistance
device for measurements and two electrodes connected to opposite
sides of the specimen. The electrical resistivity (ρ) is determined using
the following formula:
ρ = RA
L
(1).
where R, A and L are the resistance (Ω), area of the specimen (cm2
),
and length of the specimen (cm), respectively. Moreover, The electri-
cal resistivity values and corrosion rate relationship is given in Table 2
to assess the durability performance of SCMs. As seen from the table,
the higher electrical resistivity indicated a lower corrosion rate and
better performance for the mixes.
The results of previous research regarding the influence of NPs on
the electrical resistivity values of SCMs are presented in Fig. 9. The
results can be used to indicate the corrosion probability level of the
mixtures. The results demonstrated that mixtures containing 0% NPs
(control mixtures) are located in the high corrosion rate level, while
the addition of NPs shifted the corrosion rate level from high to low
depending on the amount of NPs replacement. Different types of NPs
had a dissimilar influence on electrical resistivity values, and the fluc-
tuated behavior was observed for the majority of NP types. Mohseni
Fig. 8. Percentage of water absorption versus replacement amount of NPs reported in previous studies.
Table 2
Corrosion rate and electrical resistivity relation-
ship (ACI 222, 2001).
Corrosion rate Electrical resistivity (kΩ cm)
Low > 20
Low to moderate 10–20
High 5–10
Very high < 5
R.H. Faraj et al. Cleaner Materials 4 (2022) 100086
7
8. and Tsavdaridis (2016a) found that the optimum percentage of the NA
particles regarding the electrical resistivity is 1%, compared to other
percentages from 0% to 5%. They observed that the electrical resistiv-
ity value increased by about 143% percent when 1% of NA particles
were added to the mixture, which shifts the corrosion rate category
from high to low‐to‐moderate.
Moreover, Khotbehsara et al. 2015 reported that the probability of
corrosion rate was low for the mixtures made with 4% of NC particles.
This can be explained by the fact that the inclusion of NC particles
decreases porosity and, therefore, decreases the content of pore water
solution in the samples. Predictably, the pore water behaves as an elec-
trolyte for the current, causing a reduction in the pore water solution
due to the utilization of NC particles, thus reducing the probability of
corrosion. This can be very beneficial for the reinforced concrete struc-
tures exposed to chemical and sulfate attacks.
3.3.3. Rapid chloride permeability test (RCPT)
ASTM C1202 standard can be followed to perform the RCPT test.
During the test, the amount of charge passed through the specimen
is recorded for 6 h by rapid chloride penetration, then the electrical
conductance of SCM samples is evaluated. This procedure relies on
electrical conductivity, which can be used as an indication to reveal
the resistance of the SCMs to chloride ion penetration. ASTM C1202
reported five different performance categories for mixtures according
to the charge passed through the specimens as presented in Table 3.
The results extracted from previous studies regarding the impact of
NPs on the chloride ion penetration of SCMs are shown in Fig. 10. As
shown from the Figure, the addition of NPs changed the chloride per-
meability category from moderate to low, regardless of NPs type and
content. Miyandehi et al. 2014 reported that using NPs has positively
impacted the chloride ion penetration of SCMs. They found that SCMs
made with 3% of NA particles gave minimum charge passed amongst
other combinations and can be located in a category with low chloride
permeability. Even though the mixture with 5% NA showed the worst
performance compared to other samples, it still belongs to a category
with moderate chloride permeability and has more resistance than the
control sample (Miyandehi et al. 2014). Moreover, Mohseni et al. 2015
observed that the mixture containing 5% NT provided the minimum
charge passed and can be treated with low chloride permeability.
Other scholars also presented similar findings (Khotbehsara et al.
2015; Yang et al. 2015). The reduction of chloride ion penetration
with the addition of NPs may be attributed to refining the pore struc-
ture of the mortar matrix compared to the mixtures without NPs.
4. Modeling the compressive strength of SCMs modified with NPs
As previously mentioned, other mechanical and durability proper-
ties can be obtained from compressive strength (CS). Since CS is the
most commonly evaluated property among other properties, this sec-
tion is devoted to predicting the CS of SCMs modified with NPs. In this
regard, 292 experimental data from previous papers reported in
Table 1 were collected and split into three groups. The first and bigger
group comprised 200 datasets utilized to create the models. Each with
46 data points, the second and third groups were utilized to test and
validate the models (Faraj et al. 20121b; Ahmed et al. 2021). Since
the compressive strength is affected by all mixture ingredients, there-
Fig. 9. Electrical resistivity values versus replacement amount of NPs reported in previous studies.
Table 3
Chloride permeability based on charge passed (ASTM C1202, 2000).
Chloride permeability category Charge passed (Coulombs)
High > 4000
moderate 2000–4000
Low 1000–2000
Very low 100–1000
negligible < 100
R.H. Faraj et al. Cleaner Materials 4 (2022) 100086
8
9. fore, to develop the models, several independent variables were
extracted from previously published papers, including NP% content,
cement (C) content in kg/m3
, w/b ratio, Superplasticizer (SP) content
in kg/m3
, fine aggregate (FA) content in kg/m3
, and curing time (t)
from 3 days to 90 days.
The models developed in this paper are used to estimate the CS of
SCMs and choose the best one that offers a better estimate of CS with
regard to the CS from measured data. The following assessment crite-
ria were used to compare the predictions of different models: the
model had to be scientifically accurate, have a smaller percentage
error between observed and measured data, have a lower Mean Abso-
lute Error (MAE), Root Mean Squared Error (RMSE), Objective (OBJ),
Scatter Index (SI), and a higher coefficient of determination (R2
) value.
4.1. NLR model
The following Equation (2) may be used to create a nonlinear
regression model in general (A. Mohammed et al. 2020; Sarwar
et al. 2019) To estimate the CS of typical SCM mixes and SCM mixtures
enhanced with NP, the connection between different variables can be
expressed in Equation (2) to estimate the CS.
σc ¼ a C
ð ÞC
w=b
ð Þd
t
ð Þe
SP
ð Þf
FA
ð Þg
þ b C
ð Þh
w=b
ð Þi
t
ð Þj
SP
ð Þk
FA
ð Þl
NP
ð Þm
ð2Þ
Where: C stands for the cement content (kg/m3
), w/b stands for the
water to binder ratio (%), t stands for curing time (days), SP stands for
the superplasticizer content (kg/m3
), FA stands for fine aggregate (kg/
m3
), and NP stands for the nanoparticle content (%). Moreover, the
model parameters are a, b, c, d, e, f, g, h, I, j, k, l, and calculated based
on the least square method.
4.2. MLR model
The MLR, also a regression procedure, can be employed when the
predictable variable has a parameter greater than two stages. MLR is
a statistical approach that is comparable to multiple linear regressions.
Equation (3) can be used to find the variance between a predictable
variable and independent variables.
σc ¼ aðNPÞb
C
ð Þ
C
ðw=bÞd
ðtÞe
ðSPÞf
ðFAÞg
ð3Þ
Equation (3), on the other hand, has a drawback in that it cannot be
used to forecast the CS of SCM without NPs content. As a result, the NP
content in this model should be larger than zero (NP content > 0%).
The least‐square approach was used to find the model parameters (a, b,
c, d, e, f, and g) as well as model variables.
4.3. ANN model
ANN is a powerful simulation software designed for data analysis
and computation to think like a human brain in processing and analy-
ses. This machine learning tool is widely used in construction engi-
neering to predict several numerical problems' future behavior
(Sihag et al. 2018; Demircan et al. 2011; Mohammed, 2018). ANN
model is generally divided into three main layers: input, hidden, and
output layers. Each input and output layer can be one or more layers
depending on the proposed problem. However, the hidden layer is usu-
ally ranged for two or more layers. Although the input and output lay-
ers generally depend on the collected data and the designed model
purpose, the hidden layer is determined by rated weight, transfer func-
tion, and the bias of each layer to other layers. A multi‐layer feed‐
forward network is built based on a mixture of proportions, weight/
bias, and several parameters (NP, Cement, w/b, Curing time, SP, and
Fine aggregate) as inputs and output ANN here is the CS. There is
no standard approach to designing the network architecture. There-
fore, the number of hidden layers and neurons is determined based
on a trial and error test. One of the main objectives of the training pro-
cess of the network is to determine the optimum number of iteration
(epochs) that provide the minimum mean absolute error (MAE), and
root mean square error (RMSE), and best R2
‐value that is close to
Fig. 10. Charge passed in coulombs versus replacement amount of NPs reported in previous studies.
R.H. Faraj et al. Cleaner Materials 4 (2022) 100086
9
10. one. The effect of several iterations on reducing the MAE and RMSE
has been studied. The collected data set (a total of 292 data) has been
divided into three parts for the training purpose of the designed ANN.
About 70 percent of the collected data was used as trained data for
training the network. The 15 percent of overall data was used to test
the data set, and the rest of the remaining data was used to validate
the trained network (Faraj et al. 2021b). The designed ANN was
trained and tested for various hidden layers to determine optimal net-
work structure based on the fitness of the predicted CS of SCM contain-
ing NPs with the CS of the actual collected data. It was observed that
the ANN structure with one hidden layer, six neurons, and a hyper-
bolic tangent transfer function was a best‐trained network that pro-
vides a maximum R2
and minimum both MAE and RMSE (shown in
Table 4). The general Equation of the ANN model is shown in Equation
4, Equation 5, and 6.
From linear node 0:
fc
0
¼ Threshold þ
Node1
1 þ eB1
þ
Node2
1 þ eB2
þ 4
ð Þ
From sigmoid node 1:
B1 ¼ Threshold þ Attribute Variable
ð Þ 5
ð Þ
From sigmoid node 2:
B2 ¼ Threshold þ Attribute Variable
ð Þ 6
ð Þ
5. Assessment criteria for models
Various performance metrics, including the coefficient of determi-
nation (R2
), Root Mean Squared Error (RMSE), Mean Absolute Error
(MAE), Scatter Index (SI), and OBJ were utilized to analyze and assess
the effectiveness of the suggested models, which can be computed
using the formulae below:
R2
¼
∑
p
p¼1
tpt
0
ð Þ ypy
0
ð Þ
ffiffiffiffiffiffiffiffiffiffiffiffiffiffiffiffiffiffiffiffiffiffiffiffiffiffiffiffiffiffiffiffiffiffiffiffiffiffiffiffiffiffiffiffiffiffiffiffiffiffi
∑
p
p¼1
tpt
0
ð Þ
2
∑
p
p¼1
ypy
0
ð Þ
2
q
0
@
1
A
2
(7).
RMSE ¼
ffiffiffiffiffiffiffiffiffiffiffiffiffiffiffiffiffiffiffiffiffiffiffiffiffiffi
∑
p
p¼1
ðyp tpÞ2
p
v
u
u
u
t
ð8Þ
MAE ¼
∑
p
p¼1jðyp tpÞj
p
ð9Þ
SI ¼
RMSE
t
0 ð10Þ
OBJ ¼
ntr
nall
RMSEtr þ MAEtr
R2
tr þ 1
þ
ntst
nall
RMSEtst þ MAEtst
R2
tst þ 1
þ
nval
nall
RMSEval þ MAEval
R2
val þ 1
ð11Þ
Where yp and tp are, respectively, the expected and measured val-
ues of the path pattern, and t0
and y0
are the averages of the measured
and forecasted values. Training, testing, and validating datasets are
referred to as tr, tst, and val, respectively, and n is the number of pat-
terns (collected data) in the associated dataset.
Except for R2
, the optimum value for all other assessment factors is
zero; nevertheless, R2
has the best value of one. When it comes to the
SI parameter, a model has (bad performance) when it is 0.3, (fair
performance) when it is between 0.2 and 0.3, (good performance)
when it is between 0.1 and 0.2, and (great performance) when it
is0.1 (Li et al. 2013; Golafshani et al. 2020; Ahmed et al., 2022b).
In addition, the OBJ parameter was employed as an integrated perfor-
mance parameter in Equation (11) to measure the efficiency of the sug-
gested models.
6. Results and analysis
6.1. Relationships among forecasted and actual CS
6.1.1. NLR model
Fig. 11a, 11b, and 11c represent the forecasted compressive
strength against actual compressive strength obtained from experi-
mental programs of SCM mixes enhanced with NPs for training, test-
ing, and validating datasets, respectively. According to this model,
the w/b ratio, cement amount, and SP content are the most critical ele-
ments determining SCM mixes' CS. Several experimental programs
from previous research confirmed this, reducing the w/b ratio and
increasing the amount of cement considerably improving the compres-
sive strength of SCC mixes. The following (Equation (12)) is the pro-
posed Equation for the NLR model with various variable parameters:
σc ¼ 5:63 C
ð Þ3:13
w=b
ð Þ5:7
t
ð Þ0:283
SP
ð Þ0:40
FA
ð Þ1:95
þ 0:396 C
ð Þ13:58
w=b
ð Þ2:608
t
ð Þ0:046
SP
ð Þ10:26
FA
ð Þ14:78
NP
ð Þ0:032
ð12Þ
The R2
, RMSE, and MAE assessment parameters for this model are
0.944, 4.26 MPa, and 3.37 MPa, respectively. Furthermore, the current
model's OBJ and SI values for the training dataset are 4.08 and 0.091,
respectively.
6.1.2. MLR model
Fig. 12a, 12b, and 12c demonstrate the comparison of estimated CS
versus actual CS obtained from experimental programs of SCM mixes
enhanced with NPs for training, testing, and validating datasets,
respectively. Previous research shows that the most influential param-
eter that influences the CS of SCM mixes modified with NS is the w/b
ratio, similar to the NLR model. The following is the created model for
the MLR model with different variable parameters: (Equation (13)):
σc ¼ 8:6 106
NP
ð Þ0:052
C
ð Þ
3:307
w=b
ð Þ1:953
t
ð Þ0:250
SP
ð Þ0:653
FA
ð Þ0:232
ð13Þ
The assessment parameters for this model, such as R2
, RMSE, and
MAE are 0.87, 6.51, MPa and 4.95 MPa, respectively. Moreover, the
OBJ and SI values for the current model are 6.05 and 0.136 for the
training dataset.
Table 4
The tested ANN architectures.
No. of Hidden layers No. of Neurons in left side No. of Neurons in right side R2
MAE (MPa) RMSE (MPa)
1 1 0 0.9126 8.7263 10.6682
1 3 0 0.9873 2.2704 3.001
1 5 0 0.9876 2.3084 3.0413
1 6 0 0.9881 2.3073 3.0369
1 7 0 0.9862 2.631 3.4082
2 1 1 0.9057 9.297 11.3664
2 3 3 0.9866 2.3683 3.1282
2 5 5 0.9871 2.3944 3.1471
2 6 6 0.9874 2.3357 3.0753
2 7 7 0.9864 2.4254 3.2108
R.H. Faraj et al. Cleaner Materials 4 (2022) 100086
10
11. Fig. 11. Comparison between measured and predicted compressive strength of NP modified SCM mixtures using Non-Linear Regression model (NLR) (a) training
data, (b) testing data, and (c) validating data.
Fig. 12. Comparison between measured and predicted compressive strength of NP modified SCM mixtures using Multi-Linear Regression model (MLR) (a)
training data, (b) testing data, and (c) validating data.
R.H. Faraj et al. Cleaner Materials 4 (2022) 100086
11
12. 6.1.3. ANN model
In this study, the authors tried a lot to get the high efficiency of the
ANN by applying different numbers of the hidden layer, neurons,
momentum, learning rate, and iteration. Lastly, they observed that
when the ANN has one hidden layer, 6 neurons on the left side (as
shown in Fig. 13), 0.1 momentum, 0.2 learning rate, and 2000 itera-
tion give best‐predicted values of the CS of the SCM. The ANN model
was equipped with the training datasets, accompanied by testing and
validating datasets to predict the compression strength values for the
correct input parameters. The comparison between predicted and mea-
sured CS of SCM for training, testing, and validating datasets are pre-
sented in Fig. 14a, 14b, and 14c. The studied datasets have a + 20%
and −15% error line for the training testing, and validating datasets,
which is better than the other developed models. Furthermore, this
model has a better performance compared to other models to predict
the CS of SCM based on the value of OBJ and SI that illustrated in
Fig. 20 and Fig. 21, also, the value of R2
= 0.9881, MAE = 2.3073
MPa, and RMSE = 3.0369 MPa.
6.2. Comparison between developed models
As previously stated, five different statistical methods were used to
evaluate the efficacy of the suggested models, including RMSE, MAE,
SI, OBJ, and R2
. In comparison to the NLR and MLR models, the
ANN model has a higher R2
and lower RMSE and MAE values, as
shown in Fig. 15, Fig. 16, and Fig. 17 for R2
values, RMSE, and
MAE, respectively. Fig. 18 also compares model CS estimates for
SCM mixtures including NPs based on all data. In addition, Fig. 19
depicts the residual error for all models that use training, testing,
and validating datasets. The predicted and measured values of CS for
the ANN model are closer in Figs. 18 and 19, indicating that the
ANN model outperforms other models.
Fig. 20 shows the OBJ values for all suggested models. The NLR,
MLR, and ANN models have 4.08, 6.05, and 3.18, respectively. The
OBJ value of the ANN model is 22 percent less than MLR model,
and it is also 47.43 percent less than that of the NLR model. This also
shows that the ANN model is more efficient when estimating the CS of
SCM mixes, including NPs.
Fig. 21 depicts the SI assessment parameter values for the proposed
models throughout the training, validating, and testing stages. Fig. 21
shows that the SI values for MLR model for all stages (training, testing,
and validating) were between 0.1 and 0.2, suggesting good perfor-
mance for this model. However, the SI values for the ANN and NLR
models were between 0 and 0.1, suggesting that the ANN and NLR
models performed excellently. Furthermore, the ANN model, like the
other performance factors, has lower SI values when compared to
other models. Compared to the MLR model, the ANN model had lower
SI values in all stages, for example, 42 percent lower in training and
Fig. 13. Optimal Network Structures of the ANN Model.
R.H. Faraj et al. Cleaner Materials 4 (2022) 100086
12
13. Fig. 14. Comparison between measured and predicted compressive strength of NP modified SCM mixtures using Artificial Neural Network model (ANN) (a)
training data, (b) testing data, and (c) validating data.
Fig. 15. R2
values for different proposing models including training, testing, and validating datasets.
R.H. Faraj et al. Cleaner Materials 4 (2022) 100086
13
14. Fig. 16. RMSE values for different proposing models including training, testing, and validating datasets.
Fig. 17. MAE values for different proposing models including training, testing, and validating datasets.
R.H. Faraj et al. Cleaner Materials 4 (2022) 100086
14
15. Fig. 18. Comparison between model predictions of compressive strength of SCM mixtures containing NPs using all data.
Fig. 19. Variation in predicted values of compressive strength for SCM mixtures containing NPs based on four different approaches in comparison to observed
values.
R.H. Faraj et al. Cleaner Materials 4 (2022) 100086
15
16. 26.86 percent lower in testing. This also demonstrated that the ANN
model is more efficient and performed better when predicting the CS
of SCM mixes, including NPs than the NLR and MLR models.
7. Conclusion
A systematic critical review and modeling were done to highlight
the effects of different NPs on the most essential fresh, strength, and
durability performance of SCMs. Based on the results available in
the literature and the modeling provided in this study, the following
conclusions can be drawn:
• Among the different NPs used in the production of SCMs, the NS
type is the most common one.
• Different NPs had similar influences on the fresh behavior of SCMs.
Generally, increasing the amount of NPs was increased the slump
flow diameter and decreased the V‐funnel flow time due to higher
demand for superplasticizer content.
• Both compressive and flexural strength was slightly increased with
increasing NPs content. The optimum percentage for the NPs con-
tent was 3% replacement by cement weight, regardless of NPs type.
Improving the microstructure due to additional chemical reactions
that increase the C‐S‐H gel is the main factor contributing to
improving the strength of SCMs made with NPs.
• The water absorption percentage was considerably decreased due
to the addition of NPs. This was related to the fact that the NPs
had a very small particle diameter compared to cement particles;
thus, during hydration, they fill the small voids between cement
particles, resulting in a denser matrix.
• A low probability of corrosion was observed due to the addition of
NPs, because with increasing the NP content, the electrical resistiv-
ity of SCMs was reduced, which made the composite more corro-
sion resistant. Regardless of NPs type, the addition of NPs shifted
the corrosion rate category from high to low.
• The chloride ion penetration was significantly improved due to the
addition of NPs, regardless of their type and content.
• The NLR, MLR, and ANN models were established in this research
to predict the CS of SCM mixes. According to the various evaluation
criteria, the ANN model outperformed other models with higher R2
values, lower RMSE, lower MAE, lower OBJ values, and lower SI
values for the training, testing, and validating data sets.
• The overall results obtained and reviewed from past studies demon-
strated that different types of NPs can efficiently be used to
improve the fresh, strength, and durability performance of SCMs;
this helps the construction industry further apply nanotechnology
for different types of cement‐based materials.
Fig. 20. The OBJ values for all developed models.
Fig. 21. Comparing the SI performance parameter of different developed models.
R.H. Faraj et al. Cleaner Materials 4 (2022) 100086
16
17. Declaration of Competing Interest
The authors declare that they have no known competing financial
interests or personal relationships that could have appeared to influ-
ence the work reported in this paper.
References
Ahmed, H.U., Mohammed, A.A., Mohammed, A.S., 2022a. The role of nanomaterials in
geopolymer concrete composites: A state-of-the-art review. Journal of Building
Engineering 49, 104062.
Ahmed, H. U., Mohammed, A. S., Mohammed, A. A., Faraj, R. H. (2021). Systematic
multiscale models to predict the compressive strength of fly ash-based geopolymer
concrete at various mixture proportions and curing regimes. Plos one, 16(6),
e0253006. https://doi.org/10.1371/journal.pone.0253006.
Ahmed, H.U., Abdalla, A.A., Mohammed, A.S., Mohammed, A.A., Mosavi, A., 2022b.
Statistical Methods for Modeling the Compressive Strength of Geopolymer Mortar.
Materials 15, 1868. https://doi.org/10.3390/ma15051868.
Balapour, M., Joshaghani, A., Althoey, F., 2018. Nano-SiO2 contribution to mechanical,
durability, fresh and microstructural characteristics of concrete: A review.
Construction and Building Materials 181, 27–41. https://doi.org/10.1016/
j.conbuildmat.2018.05.266.
Demircan, E., Harendra, S., Vipulanandan, C., 2011. Artificial neural network and
nonlinear models for gelling time and maximum curing temperature rise in polymer
grouts. Journal of materials in civil engineering 23 (4), 372–377. https://doi.org/
10.1061/(ASCE)MT.1943-5533.0000172.
Efnarc, 2002. Specifications and guidelines for self-consolidating concrete. Surrey, UK:
European Federation of Suppliers of Specialist Construction Chemicals (EFNARC).
Faraj, R.H., Hama Ali, H.F., Sherwani, A.F.H., Hassan, B.R., Karim, H., 2020. Use of
recycled plastic in self-compacting concrete: A comprehensive review on fresh and
mechanical properties. Journal of Building Engineering 30, 101283.
Faraj, R.H., Mohammed, A.A., Omer, K.M., 2022. Self-compacting concrete composites
modified with nanoparticles: A comprehensive review, analysis and modeling.
Journal of Building Engineering 50, 104170.
Faraj, R.H., Mohammed, A.A., Mohammed, A., Omer, K.M., Ahmed, H.U., 2021a.
Systematic multiscale models to predict the compressive strength of self-compacting
concretes modified with nanosilica at different curing ages. Engineering with
Computers 1–24. https://doi.org/10.1007/s00366-021-01385-9.
Faraj, R.H., Sherwani, A.F.H., Daraei, A., 2019. Mechanical, fracture and durability
properties of self-compacting high strength concrete containing recycled
polypropylene plastic particles. Journal of Building Engineering 25,. https://doi.
org/10.1016/j.jobe.2019.100808 100808.
Faraj, R.H., Sherwani, A.F.H., Jafer, L.H., Ibrahim, D.F., 2021b. Rheological behavior
and fresh properties of self-compacting high strength concrete containing recycled
PP particles with fly ash and silica fume blended. Journal of Building Engineering
34, 101667.
Golafshani, E.M., Behnood, A., Arashpour, M., 2020. Predicting the compressive
strength of normal and High-Performance Concretes using ANN and ANFIS
hybridized with Grey Wolf Optimizer. Construction and Building Materials 232,.
https://doi.org/10.1016/j.conbuildmat.2019.117266 117266.
Jalal, M., Teimortashlu, E., Grasley, Z., 2019. Performance-based design and
optimization of rheological and strength properties of self-compacting cement
composite incorporating micro/nano admixtures. Composites Part B: Engineering
163, 497–510. https://doi.org/10.1016/j.compositesb.2019.01.028.
Kadhim, A.S., Atiyah, A.A., Salih, S.A., 2020. Properties of self-compacting mortar
containing nano cement kiln dust. Materials Today: Proceedings 20, 499–504.
https://doi.org/10.1016/j.matpr.2019.09.177.
Khotbehsara, M.M., Miyandehi, B.M., Naseri, F., Ozbakkaloglu, T., Jafari, F., Mohseni,
E., 2018. Effect of SnO2, ZrO2, and CaCO3 nanoparticles on water transport and
durability properties of self-compacting mortar containing fly ash: Experimental
observations and ANFIS predictions. Construction and Building Materials 158,
823–834. https://doi.org/10.1016/j.conbuildmat.2017.10.067.
Khotbehsara, M.M., Mohseni, E., Yazdi, M.A., Sarker, P., Ranjbar, M.M., 2015. Effect of
nano-CuO and fly ash on the properties of self-compacting mortar. Construction and
Building Materials 94, 758–766. https://doi.org/10.1016/
j.conbuildmat.2015.07.063.
Courard, L., Darimont, A., Willem, X., Geers, C., Degeimbre, R., 2002. Repairing
concretes with self-compacting concrete: testing methodology assessment, in. In:
Proceeding of the 1st North American Conference on the Design and Use of Self-
consolidating Concrete, pp. 267–274.
Lazaro, A., Yu, Q.L., Brouwers, H.J.H., 2016. Nanotechnologies for sustainable
construction. In Sustainability of construction materials. Woodhead Publishing,
pp. 55–78.
Li, M.F., Tang, X.P., Wu, W., Liu, H.B., 2013. General models for estimating daily global
solar radiation for different solar radiation zones in mainland China. Energy
conversion and management 70, 139–148. https://doi.org/10.1016/j.
enconman.2013.03.004.
Madandoust, R., Mohseni, E., Mousavi, S.Y., Namnevis, M., 2015. An experimental
investigation on the durability of self-compacting mortar containing nano-SiO2,
nano-Fe2O3 and nano-CuO. Construction and Building Materials 86, 44–50.
https://doi.org/10.1016/j.conbuildmat.2015.03.100.
Miyandehi, B.M., Behforouz, B., Khotbehsara, E.M., Balgouri, H.A., Fathi, S.,
Khotbehsara, M.M., 2014. An experimental investigation on nano-Al2O3 based
self-compacting mortar. J. Am. Sci 10 (11), 229–233.
Mohammed, A.S., 2018. Vipulanandan models to predict the electrical resistivity,
rheological properties and compressive stress-strain behavior of oil well cement
modified with silica nanoparticles. Egyptian journal of petroleum 27 (4),
1265–1273. https://doi.org/10.1016/j.ejpe.2018.07.001.
Mohammed, A., Mahmood, W., Ghafor, K., 2020. TGA, rheological properties with
maximum shear stress and compressive strength of cement-based grout modified
with polycarboxylate polymers. Construction and Building Materials 235,. https://
doi.org/10.1016/j.conbuildmat.2019.117534 117534.
Mohseni, E., Miyandehi, B.M., Yang, J., Yazdi, M.A., 2015. Single and combined effects
of nano-SiO2, nano-Al2O3 and nano-TiO2 on the mechanical, rheological and
durability properties of self-compacting mortar containing fly ash. Construction and
Building Materials 84, 331–340.
Mohseni, E., Naseri, F., Amjadi, R., Khotbehsara, M.M., Ranjbar, M.M., 2016b.
Microstructure and durability properties of cement mortars containing nano-TiO2
and rice husk ash. Construction and Building Materials 114, 656–664. https://doi.
org/10.1016/j.conbuildmat.2016.03.136.
Mohseni, E., Tsavdaridis, K.D., 2016a. Effect of nano-alumina on pore structure and
durability of Class F Fly ash self-compacting mortar. American Journal of
Engineering and Applied Sciences 9 (2), 323–333. https://doi.org/10.3844/
ajeassp.2016.323.333.
Nasr, D., Behforouz, B., Borujeni, P.R., Borujeni, S.A., Zehtab, B., 2019. Effect of nano-
silica on mechanical properties and durability of self-compacting mortar containing
natural zeolite: Experimental investigations and artificial neural network modeling.
Construction and Building Materials 229,. https://doi.org/10.1016/
j.conbuildmat.2019.116888 116888.
Rao, S., Silva, P., De Brito, J., 2015. Experimental study of the mechanical properties
and durability of self-compacting mortars with nano materials (SiO2 and TiO2).
Construction and Building Materials 96, 508–517. https://doi.org/10.1016/
j.conbuildmat.2015.08.049.
Sarwar, W., Ghafor, K., Mohammed, A., 2019. Modeling the rheological properties with
shear stress limit and compressive strength of ordinary Portland cement modified
with polymers. Journal of Building Pathology and Rehabilitation 4 (1), 1–12.
https://doi.org/10.1007/s41024-019-0064-6.
Shahbazpanahi, S., Faraj, R.H., 2020. Feasibility study on the use of shell sunflower ash
and shell pumpkin ash as supplementary cementitious materials in concrete. Journal
of Building Engineering 30,. https://doi.org/10.1016/j.jobe.2020.101271 101271.
Shahbazpanahi, S., Manie, S., Faraj, R.H., Seraji, M., 2021a. Feasibility study on the use
of tagouk ash as pozzolanic material in concrete. Clean Technologies and
Environmental Policy 23 (4), 1283–1294. https://doi.org/10.1007/s10098-020-
02021-8.
Shahbazpanahi, S., Tajara, M.K., Faraj, R.H., Mosavi, A., 2021b. Studying the C-H
crystals and mechanical properties of sustainable concrete containing recycled
coarse aggregate with used nano-silica. Crystals 11 (2), 122. https://doi.org/
10.3390/cryst11020122.
Sharif, H.H., 2021. Fresh and Mechanical Characteristics of Eco-efficient Geopolymer
Concrete Incorporating Nano-silica: An Overview. Kurdistan Journal of Applied
Research, 64–74 https://doi.org/10.24017/science.2021.2.6.
Sihag, P., Jain, P., Kumar, M., 2018. Modelling of impact of water quality on recharging
rate of storm water filter system using various kernel function based regression.
Modeling earth systems and environment 4 (1), 61–68. https://doi.org/10.1007/
s40808-017-0410-0.
Thomas, B.S., Kumar, S., Arel, H.S., 2017. Sustainable concrete containing palm oil fuel
ash as a supplementary cementitious material–A review. Renewable and Sustainable
Energy Reviews 80, 550–561. https://doi.org/10.1016/j.rser.2017.05.128.
Yang, J., Mohseni, E., Behforouz, B., Khotbehsara, M.M., 2015. An experimental
investigation into the effects of Cr2O3 and ZnO2 nanoparticles on the mechanical
properties and durability of self-compacting mortar. International Journal of
Materials Research 106 (8), 886–892. https://doi.org/10.3139/146.111245.
Zhu, W., Bartos, P. J., Porro, A. (2004). Application of nanotechnology in
construction. Materials and structures, 37(9), 649-658. https://doi.org/10.1007/
BF02483294.
R.H. Faraj et al. Cleaner Materials 4 (2022) 100086
17