2. Case Studies in Construction Materials 16 (2022) e01036
2
1. Introduction
Concrete, after water, is the second most useful material for the construction industry [1,2]. Every year, 25 billion tons of concrete
are produced worldwide, acquiring 2.6 billion tons of cement, which will increase by 25% over the next ten years [3]. Cement pro
duction has a negative impact on the environment because one ton of cement emits one ton of CO2 into the atmosphere, alarming the
ecology [4]. However, cement-based concrete remains the most widely used material in the global building industry [5]. Therefore, all
nations have become mandatory to consider CO2 emission regulations and reductions [6]. As a result, extensive research has been
conducted to develop a new material that can be used as an alternative to Portland cement [7]; among them, geopolymer technology
was developed in France by Professor Davidovits [8]. Due to the high consumption of waste materials in mixed proportions, GPC emits
approximately 70% less green gas than conventional concrete [9].
Geopolymers are an inorganic alumino-silicate polymer family produced through alkaline activation of various aluminosilicate
virgin or waste materials rich in silicon and aluminum [10,11]. The mixed proportions of the GPC consist of aluminosilicate source
binder materials, fine and coarse aggregates, alkaline solutions, and water [12]. The polymerization process consists of four main steps:
dissolution, condensation, polycondensation, and crystallization of the gels, between the alkaline solutions and source binder mate
rials, produced solid concrete, like traditional concrete composites [13,14]. Sodium hydroxide and sodium silicate are commonly used
alkaline activators to create geopolymer composites. These two activators were produced commercially, so they have adverse effects
on environmental issues; therefore, it is essential to use activators that were made cleanly and environmentally friendly such as a
mixture of NaOH and glass waste and a mixture of olive biomass ash and water [15]. In addition, de Azevedo et al. [16] successfully
used lapidating waste of flat glasses as a precursor in geopolymer materials to manufacture ecological ceramic roof tiles with satisfied
properties; furthermore, the use of this waste opens up a new way of using this material, which is typically discarded in landfills, which
is an environmental benefit of its application and can lead to a reduction in the economic costs of this process [17].
The molarity of NaOH, the ratio of Na2SiO3/NaOH, the curing regime and ages, the water to solids ratio, the alkaline solution to
binder ratio, the elemental composition and type of source binder materials, the ratio of Si to Al in the geopolymer system, the mixing
time and rest period, the superplasticizer dosage and extra water contents, and the coarse and fine aggregate contents were all factors
that influenced the properties and performances of GPC [18].
Nanotechnology and nanomaterials have recently sparked a lot of interest worldwide due to their high performance in a variety of
fields. The construction industry, for example, can benefit from nanotechnology by using nanoparticle (NP) materials in the concrete
industry to create high-performance and innovative concrete composites. Nanotechnology is the ability to monitor and restructure
matter at the atomic and molecular levels in the range of 1–100 nm, as well as the contribution to the distinct properties and phe
nomena at that size that are equivalent to those associated with individual atoms and molecules or bulk behavior [19,20]. The primary
reason for incorporating NPs into all types of concrete composites, including GPC, is to improve the microstructural properties of the
concrete composite. As a result, all other composite properties, such as mechanical and physical properties, as well as the durability of
concrete composites, would be enhanced [21]. In the literature, a wide range of NPs like nano-silica (nS) [22], nano-clay (nC) [23],
nano-alumina (nA) [24], carbon nanotubes (CNT) [25], nano-metakaolin (nM) [26], nano-titanium (nT) [27] were consumed to
improve various properties of the geopolymer composites, with nS being the most frequent [21]. Since nano-silica was the most
frequently used material among all types of NPs, this study focused on developing various models for estimating the CS of GPC
composites incorporating nS.
All concrete composites, including GPC, need to be strong when compressed. The CS gives a general idea of how good the concrete
is [28]. However, the concrete’s CS at 28 days is very important for building structures. As a result, getting a good model for figuring
out the CS of concrete is very important for changing or verifying the concrete mix proportions [29]. Many factors affect the CS of GPC,
which leads to a wide range of compressive strength results. This makes it hard to figure out the CS, which is a problem for both
scholars and engineers. As a result, new numerical and mathematical models are needed to understand this issue [30] better. Machine
learning methods have been used in the literature to model different aspects of concretes, such as the CS of green concrete [31], the CS
of nS-modified self-compacting concrete [32], the CS of fly ash-based GPC composites [33], the CS of fly ash-based geopolymer mortar
[34], and so on.
The current study is divided into three phases: the first phase provides a detailed review of the effect of adding nS on the CS of GPC;
the second phase extracts a large amount of mixed design data from literature studies to create five different models for forecasting the
CS of GPC incorporated nS, including artificial neural network, M5P-tree, linear regression, nonlinear regression, and multi logistic
regression models. Finally, the developed models were validated in the final phase through experimental laboratory work.
2. Methodology
This study is divided into three sections: review, modeling, and experimental work. To gather information about geopolymer
concrete incorporated NPs, an extensive search of several databases, including Research Gate, Science Direct, Google Scholar, Scopus,
and the Web of Science, was conducted. It was discovered that a wide variety of NPs, including nS, nC, nA, CNT, nM, and nT, were used
to improve various properties of GPC composites, with nS being the most commonly used. As a result, in this study, the authors use
articles that used nS to improve various properties of GPC composites to create the models. However, all GPC papers containing NPs
were taken into account for the review process. In the modeling process, eleven input parameters were used, limiting the authors’
ability to utilize a more significant number of data in the created models. The gathered datasets (207) were statistically analyzed and
classified into three groups. The models (LR, NLR, MLR, ANN, and M5P) were built using the larger group, including 135 datasets. The
H.U. Ahmed et al.
4. Case Studies in Construction Materials 16 (2022) e01036
4
second group is made up of 36 datasets that were used to test the created models, and the final group is made up of 36 datasets that
were consumed to validate the suggested models [29,32]. Table 1 summarizes the dataset ranges, including all significant parameters
and the observed CS of the GPC incorporated nS. While Table 2 shows some statistical characteristics of the collected datasets. The
developed models were evaluated using statistical criteria such as R2
, RMSE, MAE, SI, and OBJ to determine the most reliable and
accurate model. Finally, five different GPC mixtures with varying nS concentrations were prepared; the prepared specimens were
tested after 28 days. The proposed models were validated using test results with mixed proportions. Additional details about this
work’s methodology are shortened in a flow chart, as illustrated in Fig. 1.
3. Reviewing phase
The literature examined the CS property of various geopolymer composite types incorporating dissimilar NPs in detail. Fig. 2 il
lustrates the effect of NPs incorporation on the CS of geopolymer concrete at a curing age of 28 days. In general, the figures
demonstrate that adding NPs increases the CS of geopolymer composites up to a certain NPs dosage.
The fresh, mechanical, and microstructural properties of geopolymer concrete at various volume fractions of nS have been
investigated. They discovered that all mixtures containing nS had greater compressive strength than a virgin mixture devoid of nS. At
28 days ambient curing temperature, the highest CS was obtained at 1.5% of nS dosage, which increased the CS by 11% compared to
the control mix. The increased strength is attributed to the filling of nanopores within the geopolymer concrete matrix with silica
nanoparticles, which densifies and compacts the matrix. Additionally, the chemical composition of the nS, which is high in silica,
accelerates the geopolymer reactions and strengthens the geopolymer binder, thereby increasing the specimens’ strength. Addition
ally, they prefer a concentration of nS of 1.5% as the optimal concentration for improving the compressive strength; above that
concentration, the CS slightly decreases due to the overflowing availability of unreacted nS particles in the matrix, and the excess
amount of nS causes agglomerations between the nS particles, preventing silica dissolution and resulting in the formation of voids,
lowering the compressive strength of the geopolymer concrete [22]. Similarly, [38,39,44,45,47,49] discovered that adding nS im
proves the CS of geopolymer concrete. Additionally, Nuaklong et al. [43] discovered that incorporating nS improves the CS of geo
polymer concrete by up to 2%; and then, a decrease in the CS was observed above that dosage. Furthermore, Angelin Lincy and
Velkennedy [46] observed that the addition of nS enhanced the CS of geopolymer concrete up to 0.5% of nS dosage, and then a
reduction in the CS was recorded. However, Ibrahim et al. [50] and Janaki et al. [51] revealed that the CS of geopolymer concrete
increased as the dosage of NPs increased up to 5% and then decreased. For instance, the CS was increased by 1.5%, 13.6%, and 1.3% at
2%, 5%, and 10% of CNT, respectively, at the age of 28 days [51], while this increment in the CS was 0%, 8.2%, 23.3%, and 19.8% at
1%, 2.5%, 5%, and 7.5% of nS, correspondingly, at the age of 28 days [50]. Further, the CS enhancement of about 81% and 57% was
recorded when 0.02% of CNTs added to the geopolymer concrete mixtures among geopolymer concrete mixtures with various CNTs
inclusion compared to the control mixes at the curing age of 28 and 60 days, respectively [25]. This strength enhancement was argued
that the CNTs act as bridges for reducing micro and macro cracks propagation [52]. The alkaline liquid influences CNTs dispersion as
the CNTs were surfactant by sodium hydroxide, letting them produce well-dispersed CNTs and de-bundle within the geopolymer
concrete matrix [53,54]. In the same manner, Kotop et al. [25] reported that the largest CS improvement was 99% and 70% at 28 and
60 days, respectively, for the geopolymer concrete mixtures incorporating a hybrid of 2.5% of nS and 0.01% of CNTs, as compared to
the control geopolymer concrete mixture without any NPs inclusion.
In the same context, experimental work has been carried out by Khater [55] to investigate the physio-mechanical properties of nS
effects on the geopolymer concrete. Various volume fractions of nS range from (0–8%) were used. The output of this research reported
that the inclusion of nS improves the CS of the geopolymer concrete up to 3%. In contrast, a further increase in nS dosage decreases the
CS due to the accumulations of the nS particles. The maximum CS was 36 MPa for 3% of nS content compared to the 25 MPa of the
control mix without incorporating nS. Also, this optimum dosage (3%) of nS was reported in other studies [37,41]. However, Rabiaa
et al. [26] observed that 4% of nS was optimum content among (0–8%) of nS dosages. Behfarnia and Rostami [37] reported that
substituting 3% nS enhances the 28-day CS by 12%. Meanwhile, beyond this dosage, a reduction in the CS was observed. This result
may be argued to the fact that nS participate in the pozzolanic reaction to produce extra C-S-H gel and fill the pores inside the matrix in
Table 2
Summary of statistical analysis of input model parameters.
Model parameters No. of data Average Median St.Div. Min. Max. Variance Skewness Kurtosis
l/b 207 0.49 0.5 0.1 0.4 0.6 0.0 0.66 -0.25
B (kg/m3
) 207 417.22 400 51.9 300 500 2689.5 0.11 -0.81
FA (kg/m3
) 207 680.96 650 135.3 490 990 18,294.6 0.63 -0.10
CA (kg/m3
) 207 1113.85 1170 183.3 810 1470 33,580.8 -0.20 -0.72
SH (kg/m3
) 207 71.36 60 33.9 18.17 159.75 1150.6 1.10 0.49
SS (kg/m3
) 207 134.43 150 35.6 40.8 187.5 1268.2 -1.43 1.56
M 207 11.97 12 3.3 4 16 11.1 -1.43 1.31
SS/SH 207 2.06 2.5 0.8 0.33 3 0.6 -1.26 0.22
nS (kg/m3
) 207 11.65 8 14.6 0 60 211.8 1.85 3.09
T (◦
C) 207 42.06 31.5 17.4 23 70 304.0 0.12 -1.93
A (days) 207 28.30 28 31.8 0.5 180 1012.9 2.37 6.96
CS (MPa) 207 36.18 35.8 17.5 3.2 81.3 307.0 0.15 -0.75
H.U. Ahmed et al.
5. Case Studies in Construction Materials 16 (2022) e01036
5
the range of nanoscale, while the reduction in strength was attributed to agglomerations of nS particles in the geopolymer concrete
mixture followed by the formation of voids in the concrete matrix [37].
Moreover, another research study was carried out on the influence of nS on the microstructure and strength of natural pozzolan-
based geopolymer concrete, and they used 0, 1%, 2.5%, 5%, and 7.5% of NS. They observed that the nS increases the CS of the
geopolymer concrete, and the highest value (about 18%) is for the specimens with 5% of nS dosage. In contrast, the minimum values
Fig. 1. The flow chart diagram process followed in this study.
H.U. Ahmed et al.
6. Case Studies in Construction Materials 16 (2022) e01036
6
were measured in the reference geopolymer concrete mixture without any nS content [40]. Similarly, the inclusion of nS particles
improves the structural performance of the geopolymer concrete [36]. On the other hand, fewer studies [27,42] have been conducted
in the literature to investigate the effects of nT on the various properties of geopolymer concrete. Sastry et al. [27] claimed that CS was
significantly improved with nT increment. For instance, the CS was increased by 21%, 23%, 31%, 33%, and 36% at the age of 7 days
and 16%, 20%, 26%, 32%, and 37% at the age of 28 days, when the dosage of nT was 1%, 2%, 3%, 4% and 5% dosage, correspondingly,
in comparison to the corresponding concrete mixtures without the any nT. Moreover, the outcome of the other experimental research
work revealed that adding 1% of nT improves CS by 32.96% and 46.65% at 7 and 28 days, respectively, compared to the control
mixture without any nT content [42].
Few researchers dealt with the influences of adding nano-clay (nC) and nano-metakaolin (nM) on the strength and durability
properties of geopolymer concrete mixtures [23,26,41]. A research study was conducted to investigate the effects of nC additions on
the durability properties of geopolymer concrete composites. The outputs of this study indicated that the CS was increased with the
increment of nC contents. The CS of 3% content of nC geopolymer concrete specimens improved by 1.39 and 1.44 times compared to
Fig. 2. CS versus NPs content of different geopolymer composites and NP types – 28 Days.
Fig. 3. CS of geopolymer concrete incorporating different dosages of nS at different curing ages.
H.U. Ahmed et al.
7. Case Studies in Construction Materials 16 (2022) e01036
7
the reference sample at the age of 7 and 28 days, respectively [41]. Similarly, Ravitheja and Kumar [23] reported that the inclusion of
nC improves the CS of the geopolymer concrete mixtures up to 6% nC; beyond that dosage, a slight reduction in the strength was
recorded. Also, they showed that the maximum CS took place at the 6% of nC content, which is 32, 37.5, and 47.5 MPa, compared to
the control geopolymer concrete mixture, which is 26, 32, and 39 MPa, at the age of 3, 7 and 28 days, correspondingly.
Moreover, an experimental research study has been carried out to investigate the effect of nM on the properties of geopolymer
concrete. They used 0%, 2%, 4%, 6%, and 8% of nM to improve the characteristics of the geopolymer concrete. CS was improved about
12% and 16% at 6% nM in the age of 7 and 28 days, respectively, compared to the control mixture, whereas, after 6% of nM slight
decrease in the CS was reported [26]. This CS enhancement is attributed to the fact that the interfacial transition zone improved with
the presence of the required content of nM, which reduces the amount of porosity and increases the compactness of the specimens.
Consequently, CS was improved. However, the reduction of CS beyond 6% dosage of nM could be argued that agglomerations among
NPs of metakaolin were taken place, which leads to producing pores, which could also be attributed to the incomplete hydration
reactions [26]. Furthermore, Shahrajabian and Behfarnia [24] observed that the addition of nC and nA led to a slight decrease in the CS
of GGBFS-based geopolymer concrete at the age of 7 and 28 days, while, at the later ages of 90 and 120 days, improvement in the CS
was recorded. Also, they observed that the inclusion of nS in the geopolymer concrete mixtures improves the CS at 7, 28, 90, and 120
days.
Lastly, experimental research work has been carried out by Ibrahim et al. [48] to investigate the effect of nS inclusions on the
engineering characteristics and microstructure of alkali-activated concrete. They reported that the addition of nS has a slightly
negative effect on the CS of the concrete mixtures at the age of 3, 7, and14 days, and then at the later ages of 28, 56, 90, and 180 days,
CS was improved up to 5% of nS content, after that the CS was slightly declined as depicted in Fig. 3 which is adapted from [48]. For
example, at the age of 7-day, the CS was decreased by 0%, 19.7%, 53.5%, and 45% at 1%, 2.5%, 5%, and 7.5% of nS dosages,
correspondingly. This result was argued to be the decline in the PH of the concrete mixture due to the inclusion of colloidal nS. While,
at the age of 90-day, CS was increased by 12.1%, 30%, 117%, and 110% at 1%, 2.5%, 5%, and 7.5% of nS inclusion, respectively. This
result was attributed to the fact that at the later ages of the geopolymer concrete mixture, the aluminosilicate species of the source
binder materials contributed to the gel formation and, subsequently, the poly-condensation to form an increasingly larger
three-dimensional network, particularly due to the availability of reactive nS.
4. Experimental phase
4.1. Materials
This study was carried out by defining five mix designs: four with varying amounts of nano-silica (1%, 2%, 3%, and 4%.) and a
control design. Table 3 shows the compositions of these mixes in detail. This study used ground granulated blast furnace slag (GGBFS)
with a specific gravity of 2.9 and a specific surface (Blaine) of 5800 cm2
/g as the primary source binder materials. The chemical
composition and the SEM of the GGBFS are shown in Table 4 and Fig. 4a, respectively. Further, a constant amount of silica fume (SF)
with a specific gravity of 2.25 was used as the GGBFS replacement to prepare the geopolymer concrete mixtures. The chemical
composition and the SEM of the SF are shown in Table 4 and Fig. 4b, respectively. In addition, nano-silica (nS) with the size of 30 nm,
bulk density 0.18 g/cm3
, purity of 99.5%, and the surface area of 185 ± 20 m2
/g are used. The XRD and FTIR of the nS are presented in
Fig. 5a, and b. the nS replaced the GGBFS by four different percentages of 1%, 2%, 3%, and 4%.
Sodium hydroxide and sodium silicate mixtures are used as alkaline solutions. The sodium hydroxide with a purity of 98% is
dissolved in water to prepare the required molarity, and the sodium silicate solution consisting of 37.5% SiO2, 16.5% Na2O, and 46%
H2O is consumed. The alkaline solution to the total binder ratio was fixed at 0.5, and sodium silicate to sodium hydroxide was 2.5.
Natural fine and crushed coarse aggregates with specific gravities of 2.77 and 2.69 are utilized, respectively. The gradations of the
fine and coarse aggregates are shown in Fig. 6a and b, correspondingly.
The chemical and mineralogical compositions of nano-silica were investigated using X-ray diffraction (Angstrom Advanced ADX-
2700, ADX-2700 SSC). The test patterns were generated using (Cu-Kα radiation, λ = 1.55046 Å) on an Angstrom Advanced XRD
platform ADX-2700 diffractometer (USA) equipped with a graphite monochromator. The test was conducted at a 40 kV accelerating
voltage, 30 mA, and 0.050 per phase-scanning system with a 5 s/phase step and an acquisition time of 2 thetas in the angle range of
0–70.
The infrared spectrum of absorption of the nano-silica in powder condition was identified and characterized using FTIR. The
spectral resolution was set to 1/cm, and the number of scans was set to 32, with the optical frequency space selected between 400 and
Table 3
GPC mixtures proportions.
Mix proportions (kg/m3
)
Mix ID GGBFS SF nS SH SS Gravel Sand nS%
G1 400 50 0 64.3 160.7 1099.83 609.83 0
G2 395.5 50 4.5 64.3 160.7 1091.30 605.10 1
G3 391 50 9 64.3 160.7 1082.78 600.37 2
G4 386.5 50 13.5 64.3 160.7 1074.25 595.64 3
G5 382 50 18 64.3 160.7 1065.72 590.92 4
H.U. Ahmed et al.
8. Case Studies in Construction Materials 16 (2022) e01036
8
1/cm 4000 1/cm.
The SEM quanta 400 from FEI Company, a high-quality field emission gun scanning electron microscope suitable for imaging and
identifying nano-scale particles, was used in this study. The samples were collected by first applying conductive tape to the stamp
surface and then placing the samples (GGBFS and SF) on it. The specimen holder was inserted into the corresponding hole on the
sample holder mount. In fine-grained powder, the GGBFS and SF are tested.
4.2. Mixing, specimens preparation, and testing
Firstly, to prepare the geopolymer concrete mixtures, the fine and coarse aggregates were dry mixed in a concrete mixer for about
30 s, then, in the second stage, a blend of GGBFS, SF, and NS was added to the mixer and further mixed with aggregates for about 60 s.
After that, in the third stage, the alkaline solution, which was prepared 24 hr before mixing added to the concrete mixer slowly,
followed by 180 s of mixing. Following the mixing step, the slump test was used to determine the workability of the fresh geopolymer
concrete based on the ASTM C143.
When the fresh concrete was put into molds, a vibrating table was used to make it even denser and get rid of air bubbles. After 24 hr,
the specimens were removed from the mold and cured in the lab at 23 ± 2 ◦
C until they were ready for the test. Finally, three
Table 4
Chemical composition of GGBFS and SF.
Elements GGBFS SF
wt% wt%
Na2O 1.7800 –
MgO 6.675 0.33
Al2O3 11.641 –
SiO2 38.159 92.4
SO3 1.93 –
K2O 0.8045 –
CaO 30.966 0.143
TiO2 1.51 –
Fe2O3 1.591 0.13
MnO 2.295 –
Ba 0.517 –
Sr 0.07 –
Cu 0.07 –
LOI 2 7
Fig. 4. SEM images; (a): GGBFS; (b): SF.
H.U. Ahmed et al.
9. Case Studies in Construction Materials 16 (2022) e01036
9
Fig. 5. (a): XRD pattern of nS; (b): FTIR spectra of nS.
Fig. 6. Gradation of aggregates; (a): fine aggregate; (b): coarse aggregate.
H.U. Ahmed et al.
10. Case Studies in Construction Materials 16 (2022) e01036
10
100 * 200 mm cylinder specimens were examined under compression at the ages of 3, 7, and 28 days to assess the compressive strength
of geopolymer concrete, according to ASTM C39. Additional details about the experimental laboratory works are presented in Fig. 7.
5. Modeling phase
5.1. Statistical assessment
Sufficient information about each variable input model parameter is provided in the following sections through 5.1.1 to 5.1.12. A
histogram was plotted to discover and show the underlying frequency distribution (shape) of a set of continuous material properties
datasets. This allows the inspection of the data for its underlying distribution (e.g., normal distribution), outliers, and skewness [34]. In
addition, the statistical criteria such as standard deviation, variance, skewness, and kurtosis were determined to illustrate the dis
tribution of each variable with compressive strength. The kurtosis is a statistical indicator that explains how heavily the tails of a
distribution of a set of data differ from the tails of the normal distribution. In addition, the kurtosis finds the heaviness of the dis
tribution tails, while skewness measures the symmetry of the distribution. On the other hand, the skewness could be quantified as an
impersonation of the range to which a given distribution differs from a normal distribution. For instance, the skew of zero value was
measured for normal distribution, while the right skew is an indication of the lognormal distribution; further, the variance informed of
the degree of spread in the dataset, the greater the spread of the data, the greater the variance is about the mean [33].
5.1.1. The alkaline solution to binder ratio (l/b)
The alkaline solution is the total amount of alkaline activator (both sodium silicate solution and sodium hydroxide solution with
required molarities) which were used to activate the source binder materials. Based on the collected datasets, the ratio of l/b of the GPC
mixtures modified with nS was in the range of 0.4–0.6, with the average and standard deviations of 0.49 and 0.05, respectively. Also,
regarding other statistical analyses, it was found that the variance was 0.002, skewness was 0.66, and the kurtosis was − 0.25. Fig. 8
depicts the relationship between CS and l/b with histograms of GPC mixtures incorporated nS.
5.1.2. Binder content (B)
Fly ash, GGBFS, MK, SF, RHA, and NP are those ashes that scholars used as source binder materials to produce GPC composites. The
Fig. 7. Experimental laboratory procedure works.
H.U. Ahmed et al.
11. Case Studies in Construction Materials 16 (2022) e01036
11
ranges of these binders were between 300 and 500 kg/m3
, with the average and standard deviations of 417 kg/m3
and 51.8 kg/m3
,
correspondingly. At the same time, other statistical assessment tools like variance, skewness, and kurtosis were 2689, 0.11, and − 0.81,
respectively, for the collected datasets. Fig. 9 illustrates the CS and b content variation and frequencies of the gathered data of GPC
mixtures incorporated nS.
5.1.3. Fine aggregate content (FA)
Natural and crushed sands were used as the FA in GPC mixtures like traditional concrete mixtures. The FA should be satisfied with
the requirements of ASTM C33 standards. According to gathered datasets from the literature article, it was found that the range of FA
was between 490 and 990 kg/m3
, with an average of 681 kg/m3
and standard deviations of 135.2 kg/m3
. More information regarding
other statistical assessment tools can be found in Fig. 10.
5.1.4. Coarse aggregate content (CA)
Natural, crushed, and recycled aggregates are those forms of aggregates that were used as the CA in geopolymer concrete mixtures,
just like conventional concrete mixtures. Same as FA, the CA should have all the properties which are required by ASTM C33 standards.
Regarding the ranges of CA, it was concluded that the contents of CA in past research varied between 810 and 1470 kg/m3
with an
average of 1113.8 kg/m3
and standard deviations of 183.2 kg/m3
. On the other hand, the variance, skewness, and kurtosis were
33,580, − 0.19, − 0.71, respectively. Also, the correlations between the CS of tested datasets and the CA contents can be found in
Fig. 11.
5.1.5. NaOH content (SH)
Pellets and flakes are two forms of SH in a solid-state with a purity above 97%. This material is mixed with the required amount of
water to prepare a solution of SH with the required molarity. In this study, according to the collected datasets, the amount of SH in a
1 m3
of GPC mixture incorporated nS was in the range between 18.1 and 159.7 kg/m3
, with an average of 71.3 kg/m3
and a standard
deviation of 33.9 kg/m3
. Extra information about other statistical assessment criteria and correlations between the CS and SH content
Fig. 8. Marginal plot between CS and l/b ratio of GPC mixtures incorporated nS.
Fig. 9. Marginal plot between CS and binder content of GPC mixtures incorporated nS.
H.U. Ahmed et al.
12. Case Studies in Construction Materials 16 (2022) e01036
12
can be found in Fig. 12.
5.1.6. Na2SiO3 content (SS)
Water glass or sodium silicate is present in a liquid form which mainly consists of Na2O, SiO2, and H2O. Based on the previous
research conducted on the GPC mixtures incorporated nS, the range of SS was found in between 40.8 and 187.5 kg/m3
, with an average
Fig. 10. Marginal plot between CS and FA content of GPC mixtures incorporated nS.
Fig. 11. Marginal plot between CS and CA content of GPC mixtures incorporated nS.
Fig. 12. Marginal plot between CS and SH content of GPC mixtures incorporated nS.
H.U. Ahmed et al.
13. Case Studies in Construction Materials 16 (2022) e01036
13
of 134.4 kg/m3
and the standard deviations of 35.6 kg/m3
. In comparison, other stats information like variance, skewness, and
kurtosis were 1268, − 1.42, 1.55, correspondingly. Furthermore, the correlations between the CS and the SS contents of GPC can be
found in Fig. 13.
5.1.7. Molarity (M)
In GPC science, the concentrations of sodium hydroxide inside water were called molarity. The authors of this study found that the
molarity of SH in the collected papers was in the range between 4 and 16 M, with an average of 11.9 M and standard deviations of
3.3 M. Also, it was found that the variance of the reviewed datasets was 11.1, the skewness was − 1.4, and kurtosis was 1.3. The
variations between the CS and M with the frequency of their datasets of GPC incorporated nS are presented in Fig. 14.
5.1.8. Na2SiO3/NaOH (SS/SH)
This parameter consists of a mixture of SS and SH with the required molarity. Usually, it is prepared about 24 hrs before mixing the
GPC ingredients. According to the gathered datasets, this parameter was used between 0.33 and 3, with an average of 2.05 and
standard deviations of 0.76. Also, the other statistical criteria were found to be 0.59, − 1.2, and 0.22 for the variance, skewness, and
kurtosis, respectively. Moreover, correlations between the CS and the SS/SH are illustrated in Fig. 15, with the frequencies of their
datasets.
5.1.9. Nano-silica content (nS)
As mentioned earlier, nS was the most frequently NPs that scholars used to improve various properties of GPC composites. It was
used as a binder replacement or just by the addition. Regarding the values of this input model parameter, it was found that the range of
nS was used to improve GPC composites in the range between 0 and 60 kg/m3
, with an average of 11.6 kg/m3
, and the standard
deviations of 14.5 kg/m3
. Similarly, other statistical criteria with the correlations between the CS and the nS content can be found in
Fig. 16.
5.1.10. Curing temperatures (T)
Ambient, steam, and oven curing regimes were commonly used to cure GPC composites. One of the reasons behind using NPs in
GPC composites is to take away from the oven and steam curing methods and go toward ambient curing methods. Based on the
collected datasets, GPC specimens modified with nS were cured in the temperature ranges between 23 and 70 ◦
C, with an average of
42.05 ◦
C and the standard deviations of 17.4 ◦
C. Also, other statistical assessment tolls like variance, skewness, and kurtosis were
303.9, 0.11, and − 1.92, respectively. The variations of the CS with the nS content and the frequencies of nS datasets are presented in
Fig. 17.
5.1.11. Age of specimens (A)
To gain sufficient early and late CS, the curing ages should be extended to promote the polymerization process, which strengthens
geopolymers. Thus, based on the collected datasets, the cure time for GPC incorporated nS ranged from 0.5 to 180 days, with an
average of 28 days and standard deviations of 31.8 days. Similarly, the published datasets’ variance, skewness, and kurtosis were
1012.8, 2.36, and 6.96, respectively. The relationships between the CS and the specimen ages with the frequencies of collected data are
shown in Fig. 18.
5.1.12. Compressive strength (CS)
An applied vertical load per unit area of the GPC specimens was known as normal stress or compressive strength. This property is
one of the critical mechanical properties of GPC composites. As shown in Table 2, the range of the CS for the gathered datasets was in
Fig. 13. Marginal plot between CS and SS content of GPC mixtures incorporated nS.
H.U. Ahmed et al.
14. Case Studies in Construction Materials 16 (2022) e01036
14
Fig. 14. Marginal plot between CS and molarity of SH of GPC mixtures incorporated nS.
Fig. 15. Marginal plot between CS and SS/SH ratio of GPC mixtures incorporated nS.
Fig. 16. Marginal plot between CS and nS content of GPC mixtures incorporated nS.
H.U. Ahmed et al.
15. Case Studies in Construction Materials 16 (2022) e01036
15
the range between 3.2 o 81.3 MPa, with an average of 36.2 MPa and standard deviations of 17.52 MPa. At the same time, other
statistical criteria like variance, skewness, and kurtosis were 307, 0.15, and − 0.75, respectively. The histogram of the compressive
strengths of the collected datasets can be found in Fig. 19.
Fig. 17. Marginal plot between CS and T of GPC mixtures incorporated nS.
Fig. 18. Marginal plot between CS and A of GPC mixtures incorporated nS.
Fig. 19. The histogram of the CS of the collected datasets at different curing ages from 0.5 to 180 days.
H.U. Ahmed et al.
16. Case Studies in Construction Materials 16 (2022) e01036
16
5.2. Modeling
Based on the coefficients of the determinations (R2
) of the collected input model parameters, as shown in Figs. 8–18, there is no
direct relationship between the CS and any individual input model parameters. Therefore, multiscale model techniques, including
M5P, MLR, ANN, LR, and NLR, are employed to develop empirical models to forecast the CS of GPC composites incorporated nS in
different mix proportion parameters curing regimes, and specimens ages.
For creating the models, the collected datasets are split into three categories. The models were built using the larger group, which
included 135 datasets. The second group is made up of 36 datasets that were utilized to test the created models, and the final group is
made up of 36 datasets that were consumed to validate the suggested models [29,32]. The forecasts of various models were compared
employing these criteria: (1) The model’s validity should be established scientifically; (2) Between estimated and tested data, it should
have a lower percentage of error; (3) The RMSE, OBJ, and SI values of the suggested equations should be low, while R2
value should be
high.
5.2.1. Linear regression model (LR)
LR is one of the standard methods that scholars use to estimate and forecast the CS of concrete composites [32]. This model has a
general form, as depicted in Eq. (1) [33].
CS = a + b(x1) (1)
where CS, x1, a and b represents the compressive strength, one of the variable input parameters, and models parameters, respectively.
This equation contains just one variable of input data, so to have more practical and reliable investigations, Eq. (2) is suggested, which
contains a wide range of input variable data parameters that can cover all of the geopolymer concrete mixture proportions and curing
conditions, as well as curing ages.
CS = a + b
(
l
b
)
+ c(b) + d(FA) + e(CA) + f(SH) + g(SS) + h(M) + i
(
SS
SH
)
+ j(nS) + k(T) + l(A) (2)
As mentioned earlier, all these main variables in Eq. (2) were described except that the a, b, c, d, e, f, g, h, i, j, k, and l are the model
parameters. Eq. (2) is a one-of-a-kind equation because it incorporates several independent variables to generate GPC-incorporated nS
that may be extremely useful in the construction industry. On the other hand, because all variables can be adjusted linearly, the
proposed Eq. (2) can be considered an extension of Eq. (1).
5.2.2. Nonlinear regression model (NLR)
In terms of the NLR, Eq. (3) may be regarded as a general form for proposing an NLR model [56]. The interrelationships between the
variables in Eqs. (1) and (2) can be used to calculate the CS of normal geopolymer concrete mixtures and geopolymer concrete mixtures
modified with nS using Eq. (3).
CS = a ∗
(
l
b
)b
∗ (b)c
∗ (FA)d
∗ (CA)e
∗ (SH)f
∗ (SS)g
∗ (M)h
∗
(
SS
SH
)i
∗ (T)j
∗ (A)k
+ l ∗
(
l
b
)m
∗ (b)n
∗ (FA)o
∗ (CA)p
∗ (SH)q
∗ (SS)r
∗ (M)s
∗
(
SS
SH
)t
∗ (T)u
∗ (A)v
∗ (nS)w
(3)
where: all of the variables in this equation were provided earlier, except that the a, b, c, d, e, f, g, h, i, j, k, l, m, n, o, p, q, r, s, t, u, and v
are described as a model parameter.
5.2.3. Multi-logistic regression model (MLR)
As with the previous models, the collected datasets were subjected to multi-logistic regression analysis, and the general form of the
MLR is shown in Eq. (4) based on the research conducted by Mohammed et al. [57] and Faraj et al. [32]. MLR is used to distinguish a
nominal predictor variable from one or more independent variables.
CS = a47208een model predictions of compressive strength of fly ash based geopolymer concrete mixtures
using training data ∗
(
l
b
)b
∗ (b)c
∗ (FA)d
∗ (CA)e
∗ (SH)f
∗ (SS)g
∗ (M)h
∗
(
SS
SH
)i
∗ (nS)j
∗ (T)k
∗ (A)l
(4)
where: all of the variables in this equation were provided earlier. Moreover, in this equation, the value of nS should be greater than 0.
5.2.4. Artificial neural network (ANN)
ANN is a powerful simulation software designed for data analysis and computation that processes and analyzes data similarly to a
human brain. This machine learning tool is widely used in construction engineering to forecast the future behavior of various nu
merical problems [58].
An ANN model is generally divided into three main layers: input, hidden, and output. Each input and output layer can be one or
more layers depending on the proposed problem. On the other hand, the hidden layer is usually ranged for two or more layers.
H.U. Ahmed et al.
17. Case Studies in Construction Materials 16 (2022) e01036
17
Although the input and output layers are generally determined by the collected data and the purpose of the designed model, the hidden
layer is determined by the rated weight, transfer function, and bias of each layer to other layers. A multi-layer feed-forward network is
constructed using a combination of proportions, weight/bias, and several parameters as inputs, including (l/b, b, FA, CA,.), and the
output ANN is compressive strength.
There is no standardized method for designing network architecture. As a result, the number of hidden layers and neurons is
determined through a trial and error procedure. One of the primary goals of the network’s training process is to determine the optimal
number of iterations (epochs) that provide the lowest MAE, RMSE, and best R2
-value close to one. The effect of several epochs on
lowering the MAE and RMSE has been studied. To train the designed ANN, the collected data set (a total of 207 data) was divided into
three parts. Approximately 70% of the collected data was used as training data to train the network. The data set was tested with 15%
of the total data, and the remaining data were used to validate the trained network [59]. The designed ANN was trained and tested for
various hidden layers to determine optimal network structure based on the fitness of the predicted CS of GPC incorporated nS with the
CS of the actual collected data. It was observed that the ANN structure with two hidden layers, 24 neurons, and a hyperbolic tangent
transfer function was a best-trained network that provides a maximum R2
and minimum both MAE and RMSE (shown in Fig. 20). As a
part of this work, an ANN model has been used to estimate the future value of the CS of GPC incorporated nS. The general equation of
the ANN model is shown in Eqs. (5)–(7).
From linear node 0:
CS = Threshold +
(
Node 1
1 + e− B1
)
+
(
Node 2
1 + e− B2
)
+ (5)
From sigmoid node 1:
B1 = Threshold + Ʃ (Attribute ∗ Variable) (6)
From sigmoid node 2:
B2 = Threshold + Ʃ (Attribute ∗ Variable) (7)
5.2.5. M5P-tree model (M5P)
The M5P model tree reconstructs Quinlan’s M5P-tree algorithm [60], a decision tree added to the leaves nodes with a linear
regression function. The decision tree encapsulates the algorithms in a tree structure formed by nodes formed during training on data.
The decision tree nodes are classified as root nodes, internal nodes, and leaf nodes. Nodes are interconnected through branches until
the leaves are reached [61]. Mohammed [62] also introduced the M5P-tree as a robust decision tree learner model for regression
analysis. This learner algorithm places the linear regression functions at the terminal nodes. Classifying all data sets into multiple
sub-spaces assigns a multivariate linear regression model to each sub-space. The M5P-tree algorithm operates on continuous class
problems rather than discrete segments and can handle tasks with a high number of dimensions. It reveals the developed information of
each linear model component constructed to estimate the nonlinear correlation of the data sets. The information about division criteria
for the M5-tree model is obtained through the error calculation at each node. The standard deviation of the class entering that node at
each node is used to analyze errors. At each node, the attribute that maximizes the reduction of estimated error is used to evaluate any
task performed by that node. As a result of this division in the M5P tree, a large tree-like structure will be generated, which will result in
Fig. 20. Choosing best-hidden layer and neurons for ANN model based on R2
, MAE, and RMSE values.
H.U. Ahmed et al.
18. Case Studies in Construction Materials 16 (2022) e01036
18
overfitting. The enormous tree is trimmed in the followed step, and linear regression functions restore the pruned subtrees. The general
equation form of the M5P-tree model is the same as the linear regression equation, as shown in Eq. (8).
CS = a + b
(
l
b
)
+ c(b) + d(FA) + e(CA) + f(SH) + g(SS) + h(M) + i
(
SS
SH
)
+ j(nS) + k(T) + l(A) (8)
where: the descriptions of all of the variables in this Eq. (8) were provided earlier.
5.3. Model efficiencies
To rate and assess the proposed models’ accuracy, various performance stats tools such as R2
, RMSE, MAE, SI, and OBJ were used,
which they have the following equations:
R2
=
⎛
⎜
⎜
⎜
⎜
⎜
⎜
⎝
∑
p
p=1
(
yp − y
)(
xp − x
′ )
̅̅̅̅̅̅̅̅̅̅̅̅̅̅̅̅̅̅̅̅̅̅̅̅̅̅̅̅̅̅̅̅̅̅̅̅̅̅̅̅̅̅̅̅̅̅̅̅̅̅̅̅̅̅̅̅̅̅̅̅̅̅̅̅̅̅̅
[
∑
p
p=1
(
yp − y′
)2
][
∑
p
p=1
(
xp − x′
)2
]
√
√
√
√
⎞
⎟
⎟
⎟
⎟
⎟
⎟
⎠
2
(9)
RMSE =
̅̅̅̅̅̅̅̅̅̅̅̅̅̅̅̅̅̅̅̅̅̅̅̅̅̅
∑
p
p=1
(xp − yp)2
n
√
√
√
√
√
(10)
MAE =
∑
p
p=1
|(xp − yp)|
n
(11)
SI =
RMSE
y′ (12)
OBJ =
(
ntr
nall
∗
RMSEtr + MAEtr
R2
tr + 1
)
+
(
ntst
nall
∗
RMSEtst + MAEtst
R2
tst + 1
)
+
(
nval
nall
∗
RMSEval + MAEval
R2
val + 1
)
(13)
where:
xp and yp are estimated and tested CS values, y′
and x′
are averages of experimentally tested and the estimated values from the
models, respectively. tr, tst, and val are referred to the training, testing, and validating datasets, respectively, and n is the number of
datasets. Except for the R2
value, zero is the optimal value for all other evaluation parameters. However, one is the highest benefit for
R2
. Regarding the SI parameter, it can be said that a model has a (poor performance) when SI > 0.3, a (fair performance) when 0.2 < SI
< 0.3, a (good performance) when 0.1 < SI < 0.2, and an (excellent performance) when SI < 0.1 [32]. Furthermore, the OBJ
parameter was employed as a performance measurement parameter in Eq. (13) to measure the efficiency of the suggested models.
Fig. 21. Compressive strength of geopolymer concrete at various nS dosages at 28 days (current study).
H.U. Ahmed et al.
19. Case Studies in Construction Materials 16 (2022) e01036
19
6. Results and analysis
6.1. Experimental
The influences of adding nano-silica on the compressive strength of GGBFS-based geopolymer concrete is illustrated in Fig. 21. This
test has been carried out on a 100 * 200 mm cylinder based on ASTM C39. It was found that the compressive strength was improved as
the dosage on nano-silica increased up to 3%, and then it was decreased. For instance, the compressive strength was improved by 9.4%,
14.43%, and 20.47% at 1%, 2%, and 3% of nS dosages, respectively, compared to the control GPC mixture without any dosages of nS.
This result was attributed to filling nanopores inside the geopolymer concrete with silica nanoparticles that make the matrix denser
and more compact. In addition, the chemical composition of the nS, which is rich in silica, accelerates the geopolymer reactions and
makes the geopolymer binder stronger, which eventually enhances the strength of the specimens [21]. On the other hand, the
compressive enhancement was decreased by 7% at 4% of nS dosage, compared to the optimum (3%) dosages of the nS content. This
reduction in the compressive strength was attributed to the overflowing availability of unreacted nS particles in the matrix. The excess
amount of nS causes agglomerations between the nS particles that could have prohibited the silica dissolution, thereby leading to
producing of voids. Also, poor dispersion of nS inside geopolymer concrete mixture negatively affects the performance of GPC mix
tures, as a consequence decreasing the compressive strength of the geopolymer concrete [22,63].
Fig. 22. Comparison between tested and predicted CS of GPC mixtures incorporated nS using LR model, (a) training data with current study results,
(b) testing and validating data with current study results.
H.U. Ahmed et al.
20. Case Studies in Construction Materials 16 (2022) e01036
20
6.2. Modeling
6.2.1. LR model
The output of this model revealed that the l/b, SS/SH, and M are those parameters that have a greater impact on the CS of GPC
incorporated nS than other parameters. This result was confirmed by a wide range of published experimental works in the literature
[64–66]. Eq. (14) with the weight of each model parameter is the output of this model. Optimizing the sum of error squares and the
least square method, which were implemented in an Excel program using Solver to calculate the ideal value for the equation in one cell
designated the objective cell, were used to determine the weighting of each parameter on the CS of GPC mixtures incorporating nS. The
values of other equation cells constrained this object cell in the worksheet [32,57].
CS=110.06− 66.6
(
l
b
)
+0.06(b)− 0.01(FA)+0.005(CA)− 0.34(SH)+0.12(SS)− 3.12(M)− 13.9
(
SS
SH
)
− 0.18(nS)+0.11(T)+0.23(A)
(14)
Fig. 22a and b depict the relationship between estimated and real CS of GPC mixtures incorporated nS for training, testing, vali
dating, and current experimental datasets. Moreover, this model was evaluated by some statistical assessment tools, and it was
observed that the R2
and RMSE for the training datasets were equal to 0.7989 7.65MPa, respectively. As illustrated in Figs. 23 and 24,
the other statistical criteria like OBJ and SI were 8.05MPa and 0.209. Finally, utilizing the training, testing, validating, and current
study datasets normalized forecasted CS/ measured CS versus the number of datasets for all the models were evaluated, as shown in
Fig. 25.
6.2.2. NLR model
The correlations between the actual and forecasted CS of GPC mixtures incorporated nS are presented in Fig. 26a and b for the
training, testing, validating, current study datasets. As shown in Eq. (15), the weight of the model parameters demonstrated that the l/
b, SH, and M are those input variable parameters that significantly affect the CS of geopolymer concrete mixtures modified with nS.
This result was also well-validated in the previous experimental laboratory research works [64,67,68].
CS = − 4643005 ∗
(
l
b
)3.78
∗ (b)1.34
∗ (FA)− 1.87
∗ (CA)0.08
∗ (SH)5.5
∗ (SS)− 7.85
∗ (M)2.72
∗
(
SS
SH
)− 6.06
∗ (T)− 0.53
∗ (A)0.02
+ 73.89
∗
(
l
b
)0.37
∗ (b)− 0.03
∗ (FA)− 0.45
∗ (CA)0.44
∗ (SH)− 0.15
∗ (SS)− 0.001
∗ (M)− 0.02
∗
(
SS
SH
)− 0.15
∗ (T)0.0002
∗ (A)0.15
∗ (nS)0.002
(15)
Similar to the LR model, this model was also assessed by some statistical criteria, and it was found that the R2
, RMSE, OBJ, and SI of
the training datasets were equal to 0.8792, 5.92 MPA 5.80 MPa, and 0.162, respectively.
6.2.3. MLR model
Eq. (16) shows the generated models for the MLR model with various variable parameters. The most significant independent factors
that impact the CS of the geopolymer concrete mixtures modified with nS in the MLR model were SS content, age of the specimens, and
curing temperatures, which are matched with some experimental studies published in the past articles [68,69].
CS = 29.0347208een model predictions of compressive strength of fly ash based geopolymer concrete mixtures
using training data ∗
(
l
b
)− 1.47
∗ (b)0.04
∗ (FA)− 0.21
∗ (CA)− 0.26
∗ (SH)− 0.09
∗ (SS)0.56
∗ (M)− 0.49
∗
(
SS
SH
)− 0.22
∗ (nS)− 0.005
∗ (T)0.13
∗ (A)0.2
(16)
Fig. 27a was created by utilizing training datasets to depict the anticipated and measured CS correlations for the GPC mixtures
incorporated nS. Furthermore, similar to the earlier models, this model was tested using two parts of data (validating and testing data)
to demonstrate its efficacy for variables not included in the model data (training data). The findings indicate that by substituting the
independent variables into the established equation, this model can predict the CS of GPC, as illustrated in Fig. 27b. the value of R2
RMSE for this developed model are 0.7787 8.02 MPa, respectively, for the training datasets. Also, as depicted in Figs. 23 and 24, other
statistical assessment tools like OBJ and SI values were observed at 8.8 MPa and 0.22, respectively.
6.2.4. ANN model
In this study, the authors tried a lot to get the high efficiency of the ANN by applying different numbers of the hidden layer, neurons,
momentum, learning rate, and iteration, as can be seen in Fig. 20. Lastly, it was observed that when the ANN has two hidden layers, 24
neurons (12 for left side and 12 for the right side as shown in Fig. 28), 0.2 momenta, 0.1 learning rate, and 2000 iterations give best-
predicted values of the CS of the GPC mixtures incorporated nS. The ANN model was equipped with the training datasets, accompanied
by testing and validating datasets to predict the compression strength values for the correct input parameters. The comparison between
estimated and experimentally tested CS of GPC mixtures incorporated nS for training, testing, validating, and current study datasets
are presented in Fig. 29a and b. The consumed data have a + 10% and − 20% error line for the training and testing datasets, and
± 10% for the validating datasets, which is better than the other developed models. Furthermore, this model has a better performance
H.U. Ahmed et al.
21. Case Studies in Construction Materials 16 (2022) e01036
21
than other models to predict the CS of the GPC incorporated nS based on the value of OBJ and SI illustrated in Figs. 23 and 24. Also, the
value of R2
= 0.9771, MAE = 2.83 MPa, and RMSE = 3.89 MPa. Finally, utilizing the training, testing, validating, and current study
datasets normalized forecasted CS/ measured CS versus the number of datasets for all the models were evaluated, as shown in Fig. 25.
Fig. 23. The OBJ values of all developed models.
Fig. 24. Comparing the SI performance parameter of different developed models.
Fig. 25. Residual error diagram of CS of GPC mixtures incorporated nS using the whole datasets for all models.
H.U. Ahmed et al.
22. Case Studies in Construction Materials 16 (2022) e01036
22
6.2.5. M5P-tree model
The predicted and observed CS of the GPC mixtures incorporated nS for whole the datasets are shown in Fig. 30a and b. Similar to
the other models, it was discovered that the l/b and M of the GPC mixtures incorporated nS has the greatest impact on the CS of the GPC
mixtures incorporated nS, which agrees with experimental findings in the past studies [64,67,68]. Fig. 31 shows the tree-shaped
branch correlations. Also, the model (in Eq. (17)) parameters are summarized in Table 5, and the model variables will be selected
based on the linear tree registration function.
CS = a + b
(
l
b
)
+ c(b) + d(FA) + e(CA) + f(SH) + g(SS) + h(M) + i
(
SS
SH
)
+ j(nS) + k(T) + l(A) (17)
For all of the training, testing, and validation datasets, there is a 20% error line. Furthermore, this model’s R2
, RMSE, MAE, OBJ,
and SI evaluation criteria are 0.9454, 5.59 MPa, 4.45 MPa, 6.0 MPa, and 0.153, respectively, for the training datasets.
6.3. Experimental results and proposed models
The developed models were evaluated and tested by using current experimental laboratory results. All input model parameters
were employed to get the predicted compressive strength of current geopolymer concrete specimens. As shown in Figs. 22, 26, 27, 29,
and 30) and Table 6, the developed models could be used to predict the compressive strength of current experimental results. For
example, the experimental compressive strength results at 0%, 1%, 2%, 3%, and 4% dosages of nS was 29.8, 32.6, 34.1, 35.9, and
33.4 MPa, respectively; on the other hand, when the model parameter of these mixtures were employed in LR model, the predicted
compressive strength became 37.8, 36.74, 35.68, 34.61, and 33.55 MPa. This result revealed that this model overestimate the
compressive strength of current GPC mixtures by 8, 4.14, 1.58, and 0.15 MPa for dosages of nS 0%, 1%, 2%, and 4%, correspondingly,
Fig. 26. Comparison between tested and predicted CS of GPC mixtures incorporated nS using NLR model, (a) training data with current study
results, (b) testing and validating data with current study results.
H.U. Ahmed et al.
23. Case Studies in Construction Materials 16 (2022) e01036
23
Fig. 27. Comparison between tested and predicted CS of GPC mixtures incorporated nS using MLR model, (a) training data with current study
results, (b) testing and validating data with current study results.
Fig. 28. Optimal network structures of the ANN model.
H.U. Ahmed et al.
24. Case Studies in Construction Materials 16 (2022) e01036
24
and underestimate the compressive strength by 1.29 MPa, at 3% nS percent. However, the difference between experimental and
predicted compressive strength of geopolymer concrete mixtures incorporated previous dosages of nS were 0.5, 0.9, − 1.5, 0.2, and
0.7 MPa, respectively, for the ANN model, and 5.5, 3.5, 7.4, 7.77, and 2.58 MPa, for NLR model. Finally, it can be concluded that these
models could be used for preliminary forecasting of the compressive strength of geopolymer concrete composites incorporated
different dosages of nano-silica.
6.4. Proposed models performance
As early mentioned, the efficiency of the developed models was evaluated by employing these five stats tools: RMSE, MAE, SI, OBJ,
and R2
. Compared to the LR, NLR, MLR, and M5P models, the ANN model has a higher R2 with lower RMSE and MAE values and lower
OBJ and SI values.
In addition, Fig. 32 shows a comparison of model predictions of the CS of GPC mixtures incorporated nS based on the testing
datasets. Furthermore, Fig. 25 displays the normalized forecasted CS/ measured CS versus the number of datasets for all the models.
The whole figures show that the estimated and tested CS values for the ANN model are close, indicating that the ANN model is more
accurate than other models.
Fig. 23 shows the OBJ values for all of the proposed models. The OBJ is 8.05, 5.8, 8.8, 3.59, and 6.0 for LR, NLR, MLR, ANN, and
M5P, respectively. The ANN model has a lower OBJ value, about 124% less than the LR model, 61.5% less than the NLR model, 145%
less than the MLR model, and 67% less than the M5P model. This also emphasized that the ANN model better forecasts the CS of GPC
incorporated nS.
In addition, Fig. 24 shows the SI values for the created models during the training, validating, and testing phases. The SI values for
Fig. 29. Comparison between tested and predicted CS of GPC mixtures incorporated nS using ANN model, (a) training data with current study
results, (b) testing and validating data with current study results.
H.U. Ahmed et al.
25. Case Studies in Construction Materials 16 (2022) e01036
25
NLR and ANN models for the entire training, testing, and validating datasets were between 0.1 and 0.2, signalizing good accuracy for
these models. While, for the other remaining models, the values of SI were between 0.2 and 0.3, this result revealed that the per
formance of the LR, MLR and M5P models is in fair condition. Similar to other statistical assessment criteria, the ANN model has
smaller SI values among the entire model. The ANN model has lower SI values (for training datasets) than the LR, NLR, MLR, and M5P
Fig. 30. Comparison between tested and predicted CS of GPC mixtures incorporated nS using M5P-tree model, (a) training data with current study
results, (b) testing and validating data with current study results.
Fig. 31. M5P-tree Pruned model tree.
H.U. Ahmed et al.
26. Case Studies in Construction Materials 16 (2022) e01036
26
models by 97.2%, 52.8%, 107.5%, and 44.3%, respectively. This also demonstrated that when forecasting the CS of GPC mixtures
incorporated nS, the ANN model is more efficient and performs better than the other models.
7. Conclusions
Based on the results of this study, the following conclusions are drawn:
1. NPs used in GPC mixtures include nano-silica, nano-clay, nano-alumina, carbon nanotubes, nano-titanium, and nano-metakaolin.
The most common of these was nano-silica.
2. Most of the time, all types of NPs were used as binder replacements in the production of different geopolymer composites, with
small percentage substitutions mostly less than 5%.
Table 5
M5P-tree model parameters (Eq. (17)).
(LM) num: 1 2 3 4 5 6
a - 93.696 +32.7126 +32.8862 - 2.7578 - 166.0773 - 13.196
b 274.4776 38.4951 38.4951 38.4951 141.2642 53.0334
c +0.0488 - 0.0138 - 0.0138 +0.0534 +0.1562 +0.0806
d +0.0655 +0.024
e +0.0029 +0.0077 +0.0077 +0.0174 - 0.0269
f +0.2796 - 0.0513 - 0.0513 - 0.1534 - 0.0386 - 0.0386
g - 0.0501 +0.0119 +0.0119 - 0.0114 - 0.0154 - 0.0154
h - 0.5772 - 0.8632 - 0.8632 - 0.8632 - 0.4692 - 0.4692
i
j - 0.0307 - 0.0307 +0.0683 +0.0516 - 0.0282 - 0.0282
k +0.3218 +0.077
l +0.1921 +0.1625 +0.1575 +0.2233 +0.9407 +0.181
Table 6
Comparsion between current experimental CS results and predicted CS of proposed models.
Experimental Results (ER) 29.8 32.6 34.1 35.9 33.4
Predicted-LR 37.80 36.74 35.68 34.61 33.55
ER-LR -8.00 -4.14 -1.58 1.29 -0.15
Predicted-NLR 24.3 29.1 26.7 28.13 30.82
ER-NLR 5.5 3.5 7.4 7.77 2.58
Predicted-MLR 38.14 35.94 35.91 35.95 36.01
ER-MLR -8.34 -3.34 -1.81 -0.05 -2.61
Predicted-ANN 29.3 31.7 35.6 35.7 32.7
ER-ANN 0.5 0.9 -1.5 0.2 0.7
Predicted-M5P 27.5 33.9 36.1 35.1 30.4
ER-M5P 2.3 -1.3 -2 0.8 3
Fig. 32. Compression between model predictions of CS of GPC mixtures incorporated nS using testing datasets.
H.U. Ahmed et al.
27. Case Studies in Construction Materials 16 (2022) e01036
27
3. The average percentage of nS used in GPC mixtures was approximately 3% of the binder content.
4. In the GPC, NPs do three things: They fill in the pores and voids, speed up chemical reactions between the ingredients in GPC
mixtures, and improve the transition zones between them.
5. Based on the current experimental results, 3% of nS dosage was the optimum content for getting the maximum compressive
strength of GPC.
6. The LR, NLR, MLR, ANN, and M5P-tree models have been used successfully to develop predictive models for the CS of nS-
containing GPC mixtures. The estimated CS of GPC mixtures containing nS was close to the experimentally determined CS.
7. According to statistical evaluation and sensitivity analysis, the ANN model outperforms the other four models. R2
values are
0.9771, 0.9777, and 0.9923 for training, testing, and validating datasets. The training dataset’s RMSE, MAE, OBJ, and SI statistics
are 3.892 MPa, 2.832 MPa, 3.59 MPa, and 0.106, respectively.
8. The obtained results indicate that the most significant variable parameters for estimating the CS of GPC mixtures contained nS are
the l/b, SS/SH, M, T, and A.
Declaration of Competing Interest
The authors declare that they have no known competing financial interests or personal relationships that could have appeared to
influence the work reported in this paper.
References
[1] N. Hamah Sor, N. Hilal, R.H. Faraj, H.U. Ahmed, A.F.H. Sherwani, Experimental and empirical evaluation of strength for sustainable lightweight self-compacting
concrete by recycling high volume of industrial waste materials, Eur. J. Environ. Civ. Eng. (2021) 1–18, https://doi.org/10.1080/19648189.2021.1997827.
[2] R.H. Faraj, H.U. Ahmed, A.F.H. Sherwani, Fresh and mechanical properties of concrete made with recycled plastic aggregates. Handbook of Sustainable
Concrete and Industrial Waste Management, Woodhead Publishing, 2022, pp. 167–185, https://doi.org/10.1016/B978-0-12-821730-6.00023-1.
[3] M.A. Khan, S.A. Memon, F. Farooq, M.F. Javed, F. Aslam, R. Alyousef, Compressive strength of fly-ash-based geopolymer concrete by gene expression
programming and random forest, Adv. Civ. Eng. (2021) 2021, https://doi.org/10.1155/2021/6618407.
[4] N. Mahasenan, S. Smith, K. Humphreys, The cement industry and global climate change: current and potential future cement industry CO2 emissions, in:
Proceedings of the Greenhouse Gas Control Technologies-6th International Conference, Pergamon, 2003, pp. 995–1000.
[5] F.U.A. Shaikh, Mechanical and durability properties of fly ash geopolymer concrete containing recycled coarse aggregates, Int. J. Sustain. Built Environ. 5 (2)
(2016) 277–287, https://doi.org/10.1016/j.ijsbe.2016.05.009.
[6] G. Yildirim, M. Sahmaran, H.U. Ahmed, Influence of hydrated lime addition on the self-healing capability of high-volume fly ash incorporated cementitious
composites, J. Mater. Civ. Eng. 27 (6) (2015) 04014187, https://doi.org/10.1061/(ASCE)MT.1943-5533.0001145.
[7] J.L. Provis, A. Palomo, C. Shi, Advances in understanding alkali-activated materials, Cem. Concr. Res. 78 (2015) 110–125, https://doi.org/10.1016/j.
cemconres.2015.04.013.
[8] H.A. Abdel-Gawwad, S.A. Abo-El-Enein, A novel method to produce dry geopolymer cement powder, HBRC J. 12 (1) (2016) 13–24, https://doi.org/10.1016/j.
hbrcj.2014.06.008.
[9] M. Weil, K. Dombrowski, A. Buchwald, Life-cycle analysis of geopolymer. Geopolymers, Woodhead Publishing, 2009, pp. 194–210, https://doi.org/10.1533/
9781845696382.2.194.
[10] J. Davidovits, Geopolymer Chemistry and Applications, 4th ed., J. Davidovits.–Saint-Quentin, France, 2015.
[11] S.M. Qaidi, B.A. Tayeh, A.M. Zeyad, A.R. de Azevedo, H.U. Ahmed, W. Emad, Recycling of mine tailings for the geopolymers production: a systematic review,
Case Stud. Constr. Mater. (2022), e00933, https://doi.org/10.1016/j.cscm.2022.e00933.
[12] H.U. Ahmed, A.A. Mohammed, S. Rafiq, A.S. Mohammed, A. Mosavi, N.H. Sor, S. Qaidi, Compressive strength of sustainable geopolymer concrete composites: a
state-of-the-art review, Sustainability 13 (24) (2021) 13502, https://doi.org/10.3390/su132413502.
[13] M.T. Marvila, A.R.G.D. Azevedo, C.M.F. Vieira, Reaction mechanisms of alkali-activated materials, Rev. IBRACON Estrut. Mater. (2021) 14, https://doi.org/
10.1590/S1983-41952021000300009.
[14] S.M. Qaidi, B.A. Tayeh, H.F. Isleem, A.R. de Azevedo, H.U. Ahmed, W. Emad, Sustainable utilization of red mud waste (bauxite residue) and slag for the
production of geopolymer composites: a review, Case Stud. Constr. Mater. (2022), e00994, https://doi.org/10.1016/j.cscm.2022.e00994.
[15] B.C. Mendes, L.G. Pedroti, C.M.F. Vieira, M. Marvila, A.R. Azevedo, J.M.F. de Carvalho, J.C.L. Ribeiro, Application of eco-friendly alternative activators in
alkali-activated materials: a review, J. Build. Eng. 35 (2021), 102010, https://doi.org/10.1016/j.jobe.2020.102010.
[16] A.R. de Azevedo, M.T. Marvila, H.A. Rocha, L.R. Cruz, C.M.F. Vieira, Use of glass polishing waste in the development of ecological ceramic roof tiles by the
geopolymerization process, Int. J. Appl. Ceram. Technol. 17 (6) (2020) 2649–2658, https://doi.org/10.1111/ijac.13585.
[17] A.R. De Azevedo, M. Teixeira Marvila, L. Barbosa de Oliveira, W. Macario Ferreira, H. Colorado, S. Rainho Teixeira, C. Mauricio Fontes Vieira, Circular economy
and durability in geopolymers ceramics pieces obtained from glass polishing waste, Int. J. Appl. Ceram. Technol. 18 (6) (2021) 1891–1900, https://doi.org/
10.1111/ijac.13780.
[18] A.A. Mohammed, H.U. Ahmed, A. Mosavi, Survey of mechanical properties of geopolymer concrete: a comprehensive review and data analysis, Materials 14
(16) (2021) 4690, https://doi.org/10.3390/ma14164690.
[19] M.C. Roco, R.S. Williams, P. Alivisatos (Eds.), Nanotechnology Research Directions: IWGN Workshop Report: Vision for Nanotechnology in the Next Decade,
Springer Science & Business Media, 2000.
[20] H.H. Sharif, Fresh and mechanical characteristics of eco-efficient geopolymer concrete incorporating nano-silica: an overview, Kurd. J. Appl. Res. (2021) 64–74,
https://doi.org/10.24017/science.2021.2.6.
[21] H.U. Ahmed, A.A. Mohammed, A.S. Mohammad, The role of nanomaterials in geopolymer concrete composites: A state-of-the-art review, J. Build. Eng. (2022),
104062, https://doi.org/10.1016/j.jobe.2022.104062.
[22] S.M. Mustakim, S.K. Das, J. Mishra, A. Aftab, T.S. Alomayri, H.S. Assaedi, C.R. Kaze, Improvement in fresh, mechanical and microstructural properties of fly ash-
blast furnace slag based geopolymer concrete by addition of nano and micro silica, Silicon (2020) 1–14, https://doi.org/10.1007/s12633-020-00593-0.
[23] A. Ravitheja, N.K. Kumar, A study on the effect of nano clay and GGBS on the strength properties of fly ash based geopolymers, Mater. Today Proc. 19 (2019)
273–276, https://doi.org/10.1016/j.matpr.2019.06.761.
[24] F. Shahrajabian, K. Behfarnia, The effects of nano particles on freeze and thaw resistance of alkali-activated slag concrete, Constr. Build. Mater. 176 (2018)
172–178, https://doi.org/10.1016/j.conbuildmat.2018.05.033.
[25] M.A. Kotop, M.S. El-Feky, Y.R. Alharbi, A.A. Abadel, A.S. Binyahya, Engineering properties of geopolymer concrete incorporating hybrid nanomaterials, Ain
Shams Eng. J. (2021), https://doi.org/10.1016/j.asej.2021.04.022.
[26] E. Rabiaa, R.A.S. Mohamed, W.H. Sofi, T.A. Tawfik, Developing geopolymer concrete properties by using nanomaterials and steel fibers, Adv. Mater. Sci. Eng.
(2020) 2020, https://doi.org/10.1155/2020/5186091.
H.U. Ahmed et al.
28. Case Studies in Construction Materials 16 (2022) e01036
28
[27] K.G.K. Sastry, P. Sahitya, A. Ravitheja, Influence of nano TiO2 on strength and durability properties of geopolymer concrete, Mater. Today Proc. 45 (2021)
1017–1025, https://doi.org/10.1016/j.matpr.2020.03.139.
[28] H.U. Ahmed, R.H. Faraj, N. Hilal, A.A. Mohammed, A.F.H. Sherwani, Use of recycled fibers in concrete composites: a systematic comprehensive review, Compos.
Part B Eng. (2021), 108769, https://doi.org/10.1016/j.compositesb.2021.108769.
[29] E.M. Golafshani, A. Behnood, M. Arashpour, Predicting the compressive strength of normal and high-performance concretes using ANN and ANFIS hybridized
with Grey Wolf Optimizer, Constr. Build. Mater. 232 (2020), 117266, https://doi.org/10.1016/j.conbuildmat.2019.117266.
[30] A.A. Shahmansouri, H.A. Bengar, S. Ghanbari, Compressive strength prediction of eco-efficient GGBS-based geopolymer concrete using GEP method, J. Build.
Eng. (2020), 101326, https://doi.org/10.1016/j.jobe.2020.101326.
[31] M. Velay-Lizancos, J.L. Perez-Ordoñez, I. Martinez-Lage, P. Vazquez-Burgo, Analytical and genetic programming model of compressive strength of eco concretes
by NDT according to curing temperature, Constr. Build. Mater. 144 (2017) 195–206, https://doi.org/10.1016/j.conbuildmat.2017.03.123.
[32] R.H. Faraj, A.A. Mohammed, A. Mohammed, K.M. Omer, H.U. Ahmed, Systematic multiscale models to predict the compressive strength of self-compacting
concretes modified with nanosilica at different curing ages, Eng. Comput. (2021) 1–24, https://doi.org/10.1007/s00366-021-01385-9.
[33] H.U. Ahmed, A.S. Mohammed, A.A. Mohammed, R.H. Faraj, Systematic multiscale models to predict the compressive strength of fly ash-based geopolymer
concrete at various mixture proportions and curing regimes, PLoS One 16 (6) (2021), e0253006, https://doi.org/10.1371/journal.pone.0253006.
[34] H.U. Ahmed, A.A. Abdalla, A.S. Mohammed, A.A. Mohammed, A. Mosavi, Statistical methods for modeling the compressive strength of geopolymer mortar,
Materials 15 (2022) 1868, https://doi.org/10.3390/ma15051868.
[35] A. Çevik, R. Alzeebaree, G. Humur, A. Niş, M.E. Gülşan, Effect of nano-silica on the chemical durability and mechanical performance of fly ash based
geopolymer concrete, Ceram. Int. 44 (11) (2018) 12253–12264, https://doi.org/10.1016/j.ceramint.2018.04.009.
[36] D. Adak, M. Sarkar, S. Mandal, Structural performance of nano-silica modified fly-ash based geopolymer concrete, Constr. Build. Mater. 135 (2017) 430–439,
https://doi.org/10.1016/j.conbuildmat.2016.12.111.
[37] K. Behfarnia, M. Rostami, Effects of micro and nanoparticles of SiO2 on the permeability of alkali activated slag concrete, Constr. Build. Mater. 131 (2017)
205–213, https://doi.org/10.1016/j.conbuildmat.2016.11.070.
[38] P. Nuaklong, P. Jongvivatsakul, T. Pothisiri, V. Sata, P. Chindaprasirt, Influence of rice husk ash on mechanical properties and fire resistance of recycled
aggregate high-calcium fly ash geopolymer concrete, J. Clean. Prod. 252 (2020), 119797, https://doi.org/10.1016/j.jclepro.2019.119797.
[39] Y. Patel, I.N. Patel, M.J. Shah, Experimental investigation on compressive strength and durability properties of geopolymer concrete incorporating with nano
silica, Int. J. Civ. Eng. Technol. 6 (5) (2015) 135–143.
[40] M. Ibrahim, M.A.M. Johari, M. Maslehuddin, M.K. Rahman, Influence of nano-SiO2 on the strength and microstructure of natural pozzolan based alkali
activated concrete, Constr. Build. Mater. 173 (2018) 573–585, https://doi.org/10.1016/j.conbuildmat.2018.04.051.
[41] B. Mahboubi, Z. Guo, H. Wu, Evaluation of durability behavior of geopolymer concrete containing Nano-silica and Nano-clay additives in acidic media, J. Civ.
Eng. Mater. Appl. 3 (3) (2019) 163–171, https://doi.org/10.22034/JCEMA.2019.95839.
[42] S. Naskar, A.K. Chakraborty, Effect of nano materials in geopolymer concrete, Perspect. Sci. 8 (2016) 273–275, https://doi.org/10.1016/j.pisc.2016.04.049.
[43] P. Nuaklong, V. Sata, A. Wongsa, K. Srinavin, P. Chindaprasirt, Recycled aggregate high calcium fly ash geopolymer concrete with inclusion of OPC and nano-
SiO2, Constr. Build. Mater. 174 (2018) 244–252, https://doi.org/10.1016/j.conbuildmat.2018.04.123.
[44] S. Vyas, S. Mohammad, S. Pal, N. Singh, Strength and durability performance of fly ash based geopolymer concrete using nano silica, Int. J. Eng. Sci. Technol. 4
(2) (2020) 1–12, https://doi.org/10.29121/ijoest.v4.i2.2020.73.
[45] M. Etemadi, M. Pouraghajan, H. Gharavi, Investigating the effect of rubber powder and nano silica on the durability and strength characteristics of geopolymeric
concretes, J. Civ. Eng. Mater. Appl. 4 (4) (2020) 243–252, https://doi.org/10.22034/jcema.2020.119979.
[46] G. Angelin Lincy, R. Velkennedy, Experimental optimization of metakaolin and nanosilica composite for geopolymer concrete paver blocks, Struct. Concr.
(2020), https://doi.org/10.1002/suco.201900555.
[47] M.C. Roco, R.S. Williams, P. Alivisatos (Eds.), Nanotechnology Research Directions: IWGN Workshop Report: Vision for Nanotechnology in the Next Decade,
Springer Science & Business Media, 2000.
[48] M. Ibrahim, M.A.M. Johari, M.K. Rahman, M. Maslehuddin, H.D. Mohamed, Enhancing the engineering properties and microstructure of room temperature
cured alkali activated natural pozzolan based concrete utilizing nanosilica, Constr. Build. Mater. 189 (2018) 352–365, https://doi.org/10.1016/j.
conbuildmat.2018.08.166.
[49] J.M. Their, M. Özakça, Developing geopolymer concrete by using cold-bonded fly ash aggregate, nano-silica, and steel fiber, Constr. Build. Mater. 180 (2018)
12–22, https://doi.org/10.1016/j.conbuildmat.2018.05.274.
[50] M. Ibrahim, M.K. Rahman, M.A.M. Johari, M. Maslehuddin, Effect of incorporating nano-silica on the strength of natural pozzolan-based alkali-activated
concrete, in: Proceedings of the International Congress on Polymers in Concrete, Springer, Cham, 2018, pp. 703–709. 〈https://doi.org/10.1007/978-3-319-
78175-4_90〉.
[51] A.M. Janaki, G. Shafabakhsh, A. Hassani, Laboratory evaluation of alkali-activated slag concrete pavement containing silica fume and carbon nanotubes, Eng. J.
25 (5) (2021) 21–31, https://doi.org/10.4186/ej.2021.25.5.21.
[52] A. Carriço, J.A. Bogas, A. Hawreen, M. Guedes, Durability of multi-walled carbon nanotube reinforced concrete, Constr. Build. Mater. 164 (2018) 121–133,
https://doi.org/10.1016/j.conbuildmat.2017.12.221.
[53] P. Jittabut, S. Horpibulsuk, Physical and microstructure properties of geopolymer nanocomposite reinforced with carbon nanotubes, Mater. Today Proc. 17
(2019) 1682–1692, https://doi.org/10.1016/j.matpr.2019.06.199.
[54] G. da Luz, P.J.P. Gleize, E.R. Batiston, F. Pelisser, Effect of pristine and functionalized carbon nanotubes on microstructural, rheological, and mechanical
behaviors of metakaolin-based geopolymer, Cem. Concr. Compos. 104 (2019), 103332, https://doi.org/10.1016/j.cemconcomp.2019.05.015.
[55] H.M.M. Khater, Physicomechanical properties of nano-silica effect on geopolymer composites, J. Build. Mater. Struct. 3 (1) (2016) 1–14.
[56] A. Mohammed, W. Mahmood, K. Ghafor, TGA, rheological properties with maximum shear stress and compressive strength of cement-based grout modified with
polycarboxylate polymers, Constr. Build. Mater. 235 (2020), 117534, https://doi.org/10.1016/j.conbuildmat.2019.117534.
[57] A. Mohammed, S. Rafiq, P. Sihag, R. Kurda, W. Mahmood, Soft computing techniques: systematic multiscale models to predict the compressive strength of HVFA
concrete based on mix proportions and curing times, J. Build. Eng. 33 (2021), 101851, https://doi.org/10.1016/j.jobe.2020.101851.
[58] P. Sihag, P. Jain, M. Kumar, Modelling of impact of water quality on recharging rate of storm water filter system using various kernel function based regression,
Model. Earth Syst. Environ. 4 (1) (2018) 61–68, https://doi.org/10.1007/s40808-017-0410-0.
[59] E. Demircan, S. Harendra, C. Vipulanandan, Artificial neural network and nonlinear models for gelling time and maximum curing temperature rise in polymer
grouts, J. Mater. Civ. Eng. 23 (4) (2011) 372–377, https://doi.org/10.1061/(ASCE)MT.1943-5533.0000172.
[60] J. Quinlan Ross, Learning with continuous classes, in: Proceedings of the 5th Australian Joint Conference on Artificial Intelligence, Singapore, 1992, pp.
343–348.
[61] D. Malerba, F. Esposito, M. Ceci, A. Appice, Top-down induction of model trees with regression and splitting nodes, IEEE Trans. Pattern Anal. Mach. Intell. 26
(5) (2004) 612–625, https://doi.org/10.1109/TPAMI.2004.1273937.
[62] A.S. Mohammed, Vipulanandan models to predict the electrical resistivity, rheological properties and compressive stress-strain behavior of oil well cement
modified with silica nanoparticles, Egypt. J. Pet. 27 (4) (2018) 1265–1273, https://doi.org/10.1016/j.ejpe.2018.07.001.
[63] N. Hamed, M.S. El-Feky, M. Kohail, E.S.A. Nasr, Effect of nano-clay de-agglomeration on mechanical properties of concrete, Constr. Build. Mater. 205 (2019)
245–256, https://doi.org/10.1016/j.conbuildmat.2019.02.018.
[64] D. Hardjito, S.E. Wallah, D.M. Sumajouw, B.V. Rangan, On the development of fly ash-based geopolymer concrete, Mater. J. 101 (6) (2004) 467–472.
[65] P.S. Deb, P. Nath, P.K. Sarker, The effects of ground granulated blast-furnace slag blending with fly ash and activator content on the workability and strength
properties of geopolymer concrete cured at ambient temperature, Mater. Des. 62 (1980–2015) (2014) 32–39, https://doi.org/10.1016/j.matdes.2014.05.001.
[66] S. Oyebisi, A. Ede, F. Olutoge, D. Omole, Geopolymer concrete incorporating agro-industrial wastes: Effects on mechanical properties, microstructural behaviour
and mineralogical phases, Constr. Build. Mater. 256 (2020), 119390, https://doi.org/10.1016/j.conbuildmat.2020.119390.
H.U. Ahmed et al.
29. Case Studies in Construction Materials 16 (2022) e01036
29
[67] A.A. Aliabdo, M. Abd Elmoaty, H.A. Salem, Effect of water addition, plasticizer and alkaline solution constitution on fly ash based geopolymer concrete
performance, Constr. Build. Mater. 121 (2016) 694–703, https://doi.org/10.1016/j.conbuildmat.2016.06.062.
[68] M.T. Ghafoor, Q.S. Khan, A.U. Qazi, M.N. Sheikh, M.N.S. Hadi, Influence of alkaline activators on the mechanical properties of fly ash based geopolymer
concrete cured at ambient temperature, Constr. Build. Mater. 273 (2021), 121752, https://doi.org/10.1016/j.conbuildmat.2020.121752.
[69] A. Hassan, M. Arif, M. Shariq, Effect of curing condition on the mechanical properties of fly ash-based geopolymer concrete, SN Appl. Sci. 1 (12) (2019) 1–9,
https://doi.org/10.1007/s42452-019-1774-8.
H.U. Ahmed et al.
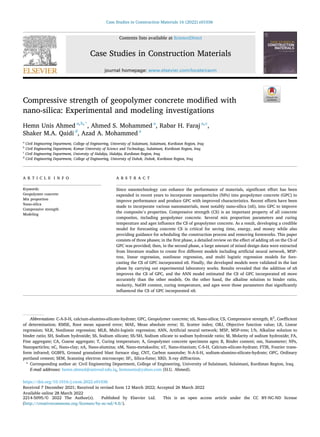
![Case Studies in Construction Materials 16 (2022) e01036
2
1. Introduction
Concrete, after water, is the second most useful material for the construction industry [1,2]. Every year, 25 billion tons of concrete
are produced worldwide, acquiring 2.6 billion tons of cement, which will increase by 25% over the next ten years [3]. Cement pro
duction has a negative impact on the environment because one ton of cement emits one ton of CO2 into the atmosphere, alarming the
ecology [4]. However, cement-based concrete remains the most widely used material in the global building industry [5]. Therefore, all
nations have become mandatory to consider CO2 emission regulations and reductions [6]. As a result, extensive research has been
conducted to develop a new material that can be used as an alternative to Portland cement [7]; among them, geopolymer technology
was developed in France by Professor Davidovits [8]. Due to the high consumption of waste materials in mixed proportions, GPC emits
approximately 70% less green gas than conventional concrete [9].
Geopolymers are an inorganic alumino-silicate polymer family produced through alkaline activation of various aluminosilicate
virgin or waste materials rich in silicon and aluminum [10,11]. The mixed proportions of the GPC consist of aluminosilicate source
binder materials, fine and coarse aggregates, alkaline solutions, and water [12]. The polymerization process consists of four main steps:
dissolution, condensation, polycondensation, and crystallization of the gels, between the alkaline solutions and source binder mate
rials, produced solid concrete, like traditional concrete composites [13,14]. Sodium hydroxide and sodium silicate are commonly used
alkaline activators to create geopolymer composites. These two activators were produced commercially, so they have adverse effects
on environmental issues; therefore, it is essential to use activators that were made cleanly and environmentally friendly such as a
mixture of NaOH and glass waste and a mixture of olive biomass ash and water [15]. In addition, de Azevedo et al. [16] successfully
used lapidating waste of flat glasses as a precursor in geopolymer materials to manufacture ecological ceramic roof tiles with satisfied
properties; furthermore, the use of this waste opens up a new way of using this material, which is typically discarded in landfills, which
is an environmental benefit of its application and can lead to a reduction in the economic costs of this process [17].
The molarity of NaOH, the ratio of Na2SiO3/NaOH, the curing regime and ages, the water to solids ratio, the alkaline solution to
binder ratio, the elemental composition and type of source binder materials, the ratio of Si to Al in the geopolymer system, the mixing
time and rest period, the superplasticizer dosage and extra water contents, and the coarse and fine aggregate contents were all factors
that influenced the properties and performances of GPC [18].
Nanotechnology and nanomaterials have recently sparked a lot of interest worldwide due to their high performance in a variety of
fields. The construction industry, for example, can benefit from nanotechnology by using nanoparticle (NP) materials in the concrete
industry to create high-performance and innovative concrete composites. Nanotechnology is the ability to monitor and restructure
matter at the atomic and molecular levels in the range of 1–100 nm, as well as the contribution to the distinct properties and phe
nomena at that size that are equivalent to those associated with individual atoms and molecules or bulk behavior [19,20]. The primary
reason for incorporating NPs into all types of concrete composites, including GPC, is to improve the microstructural properties of the
concrete composite. As a result, all other composite properties, such as mechanical and physical properties, as well as the durability of
concrete composites, would be enhanced [21]. In the literature, a wide range of NPs like nano-silica (nS) [22], nano-clay (nC) [23],
nano-alumina (nA) [24], carbon nanotubes (CNT) [25], nano-metakaolin (nM) [26], nano-titanium (nT) [27] were consumed to
improve various properties of the geopolymer composites, with nS being the most frequent [21]. Since nano-silica was the most
frequently used material among all types of NPs, this study focused on developing various models for estimating the CS of GPC
composites incorporating nS.
All concrete composites, including GPC, need to be strong when compressed. The CS gives a general idea of how good the concrete
is [28]. However, the concrete’s CS at 28 days is very important for building structures. As a result, getting a good model for figuring
out the CS of concrete is very important for changing or verifying the concrete mix proportions [29]. Many factors affect the CS of GPC,
which leads to a wide range of compressive strength results. This makes it hard to figure out the CS, which is a problem for both
scholars and engineers. As a result, new numerical and mathematical models are needed to understand this issue [30] better. Machine
learning methods have been used in the literature to model different aspects of concretes, such as the CS of green concrete [31], the CS
of nS-modified self-compacting concrete [32], the CS of fly ash-based GPC composites [33], the CS of fly ash-based geopolymer mortar
[34], and so on.
The current study is divided into three phases: the first phase provides a detailed review of the effect of adding nS on the CS of GPC;
the second phase extracts a large amount of mixed design data from literature studies to create five different models for forecasting the
CS of GPC incorporated nS, including artificial neural network, M5P-tree, linear regression, nonlinear regression, and multi logistic
regression models. Finally, the developed models were validated in the final phase through experimental laboratory work.
2. Methodology
This study is divided into three sections: review, modeling, and experimental work. To gather information about geopolymer
concrete incorporated NPs, an extensive search of several databases, including Research Gate, Science Direct, Google Scholar, Scopus,
and the Web of Science, was conducted. It was discovered that a wide variety of NPs, including nS, nC, nA, CNT, nM, and nT, were used
to improve various properties of GPC composites, with nS being the most commonly used. As a result, in this study, the authors use
articles that used nS to improve various properties of GPC composites to create the models. However, all GPC papers containing NPs
were taken into account for the review process. In the modeling process, eleven input parameters were used, limiting the authors’
ability to utilize a more significant number of data in the created models. The gathered datasets (207) were statistically analyzed and
classified into three groups. The models (LR, NLR, MLR, ANN, and M5P) were built using the larger group, including 135 datasets. The
H.U. Ahmed et al.](data:image/gif;base64,R0lGODlhAQABAIAAAAAAAP///yH5BAEAAAAALAAAAAABAAEAAAIBRAA7)