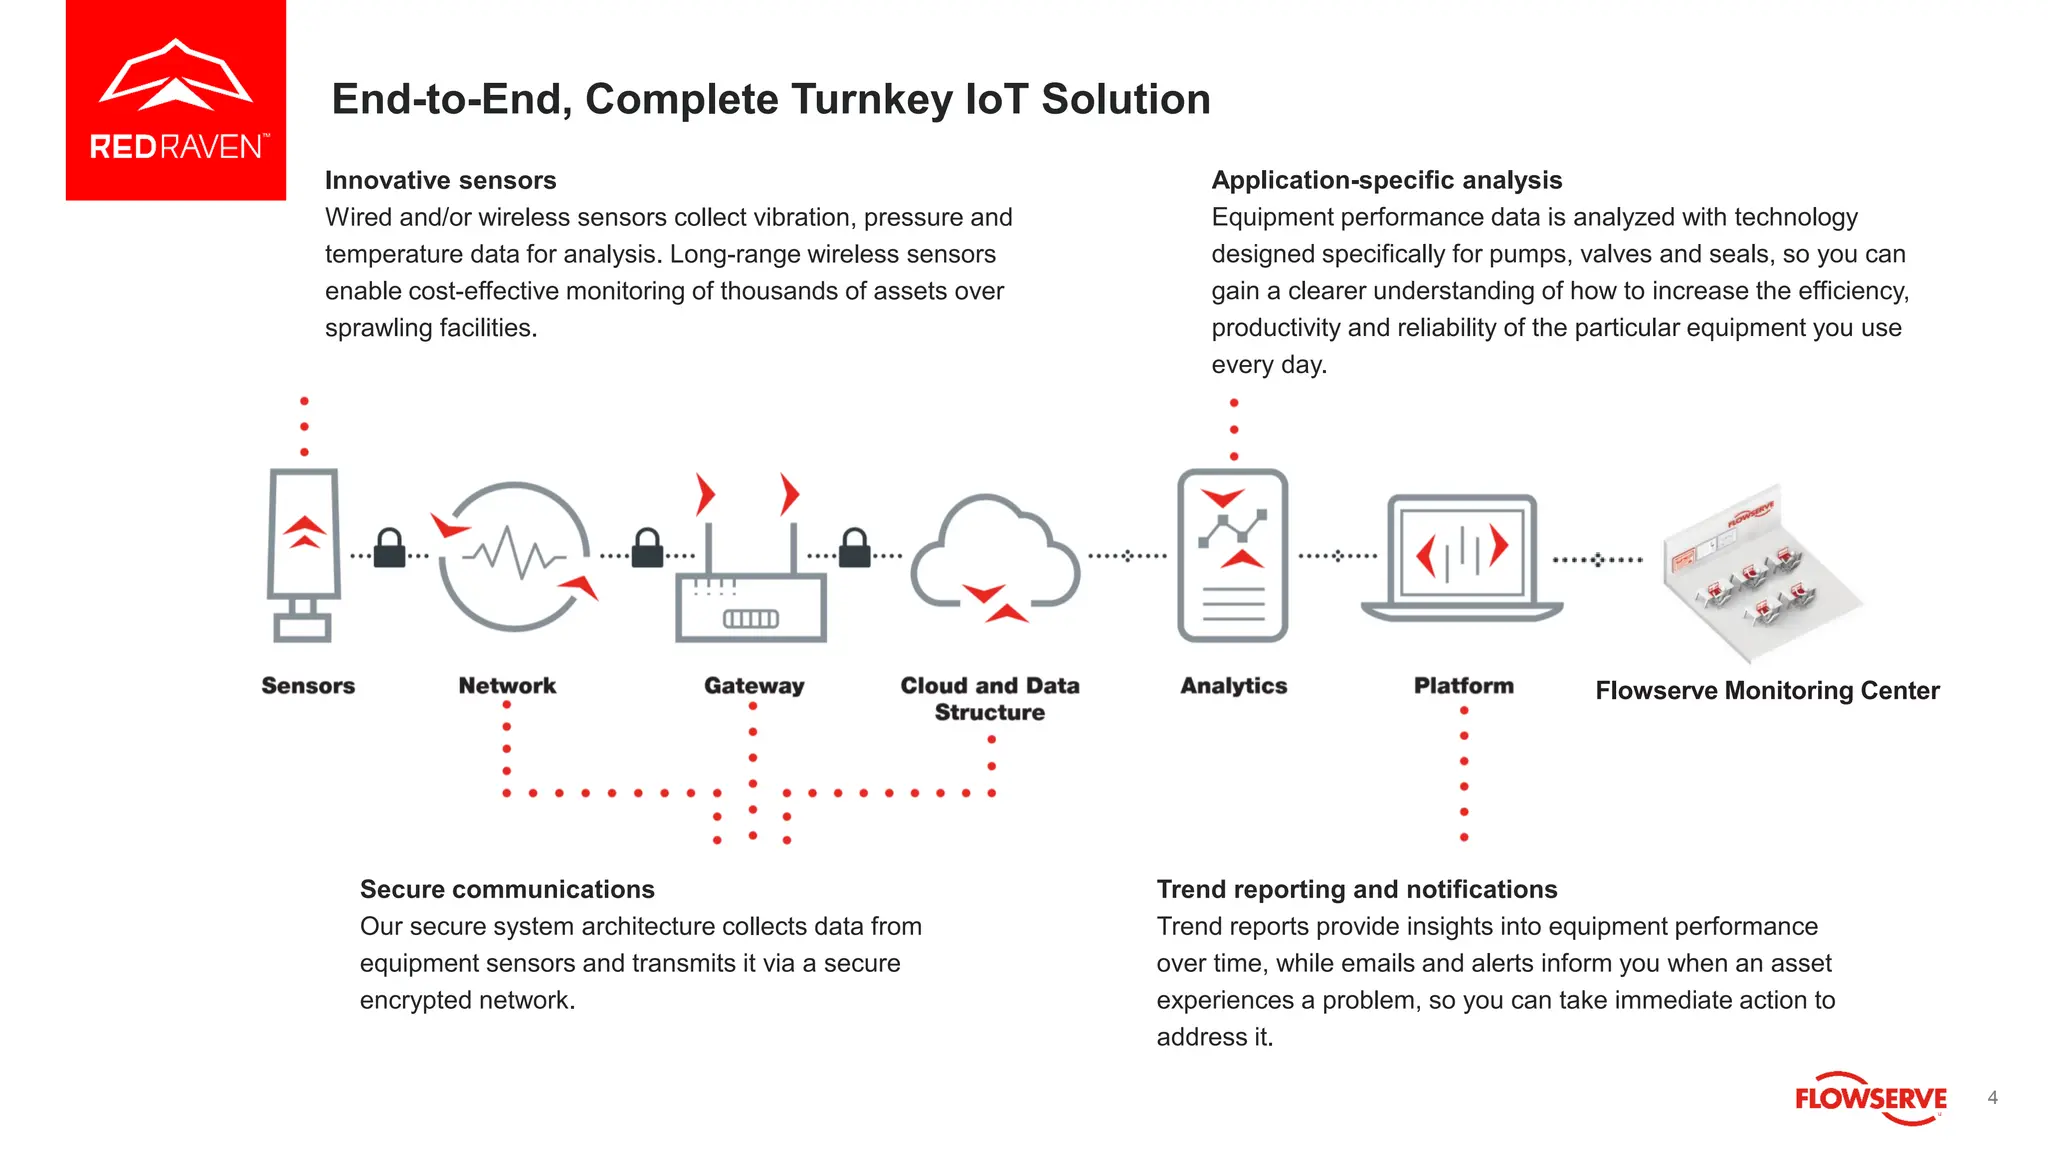
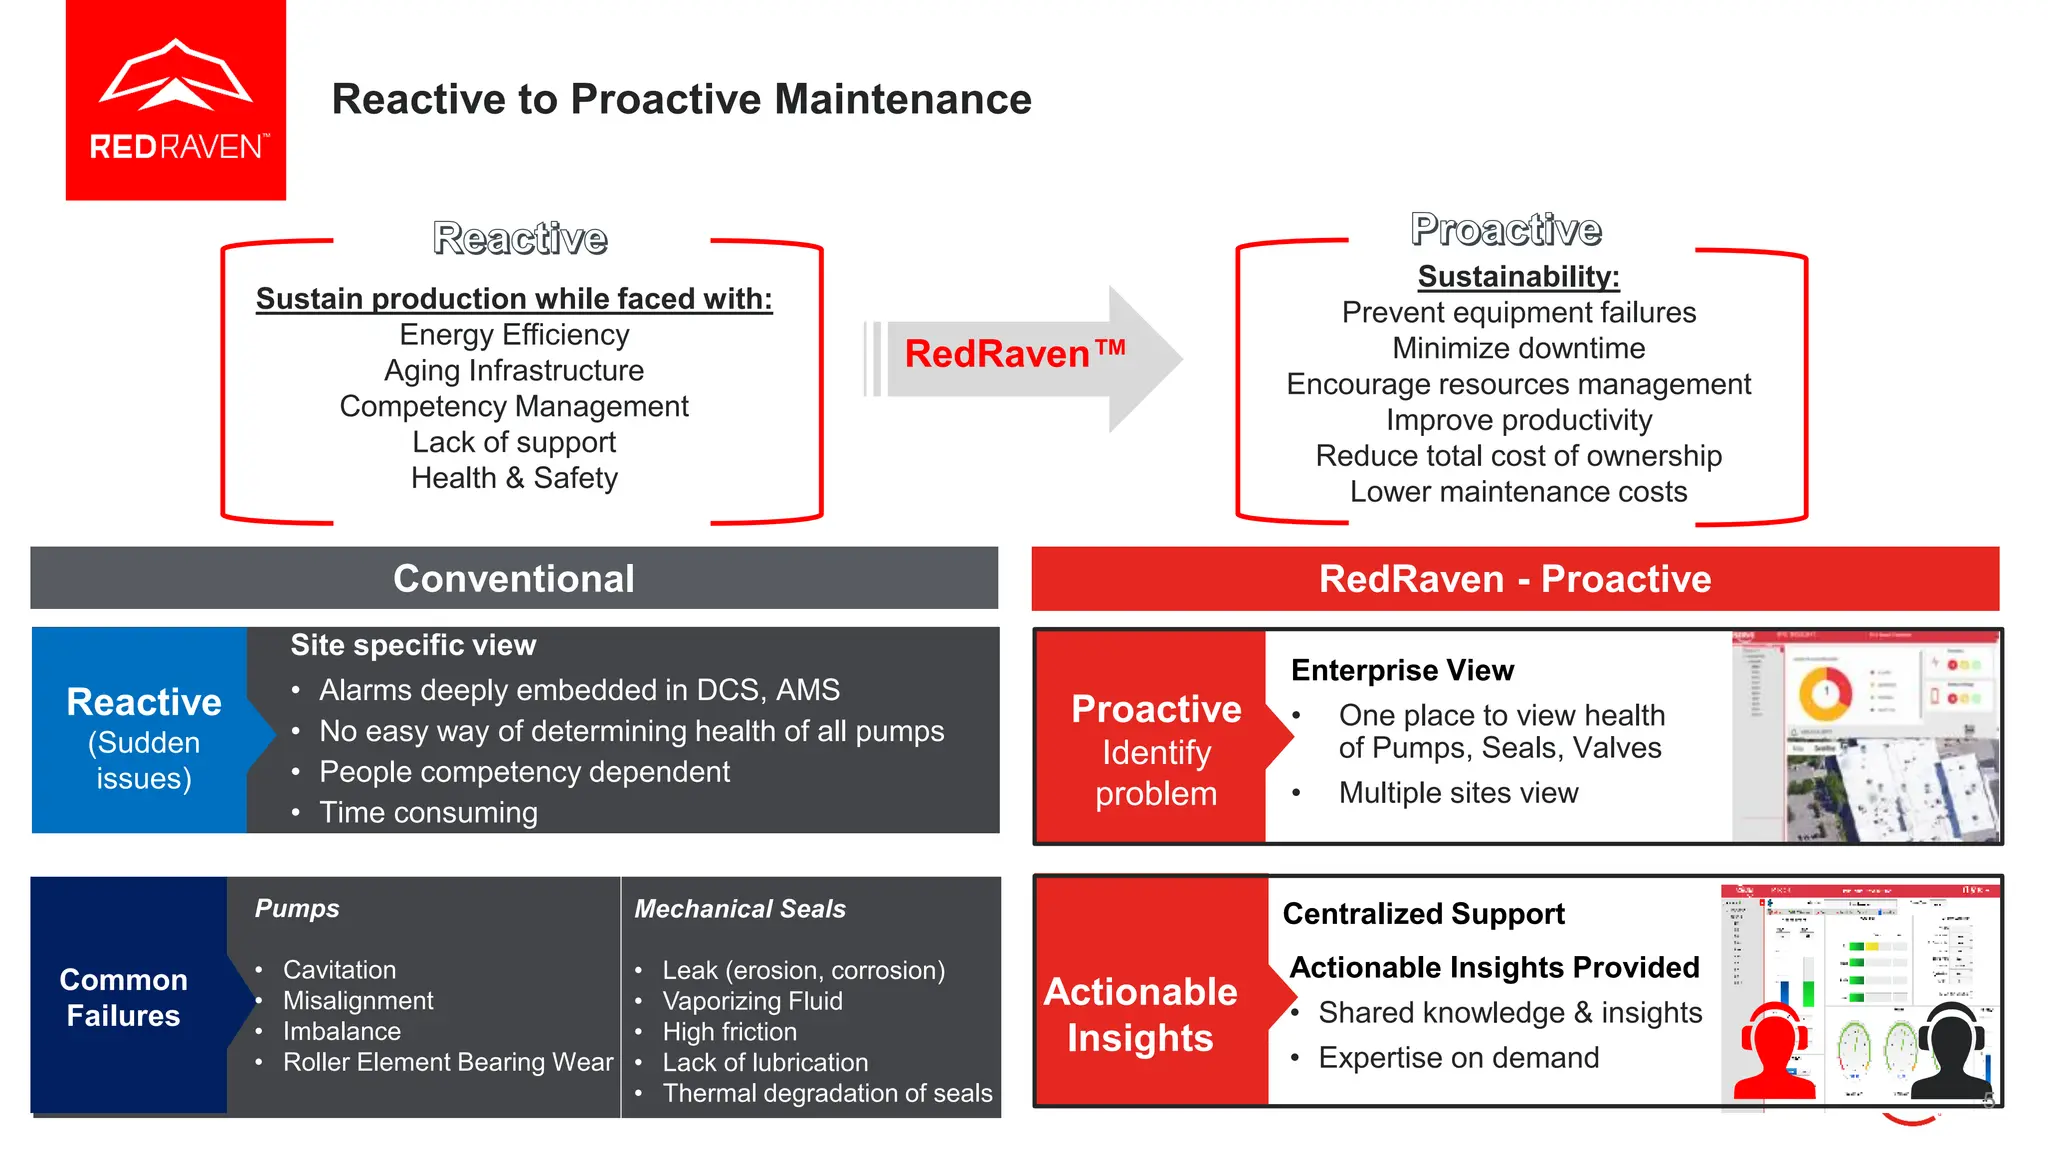
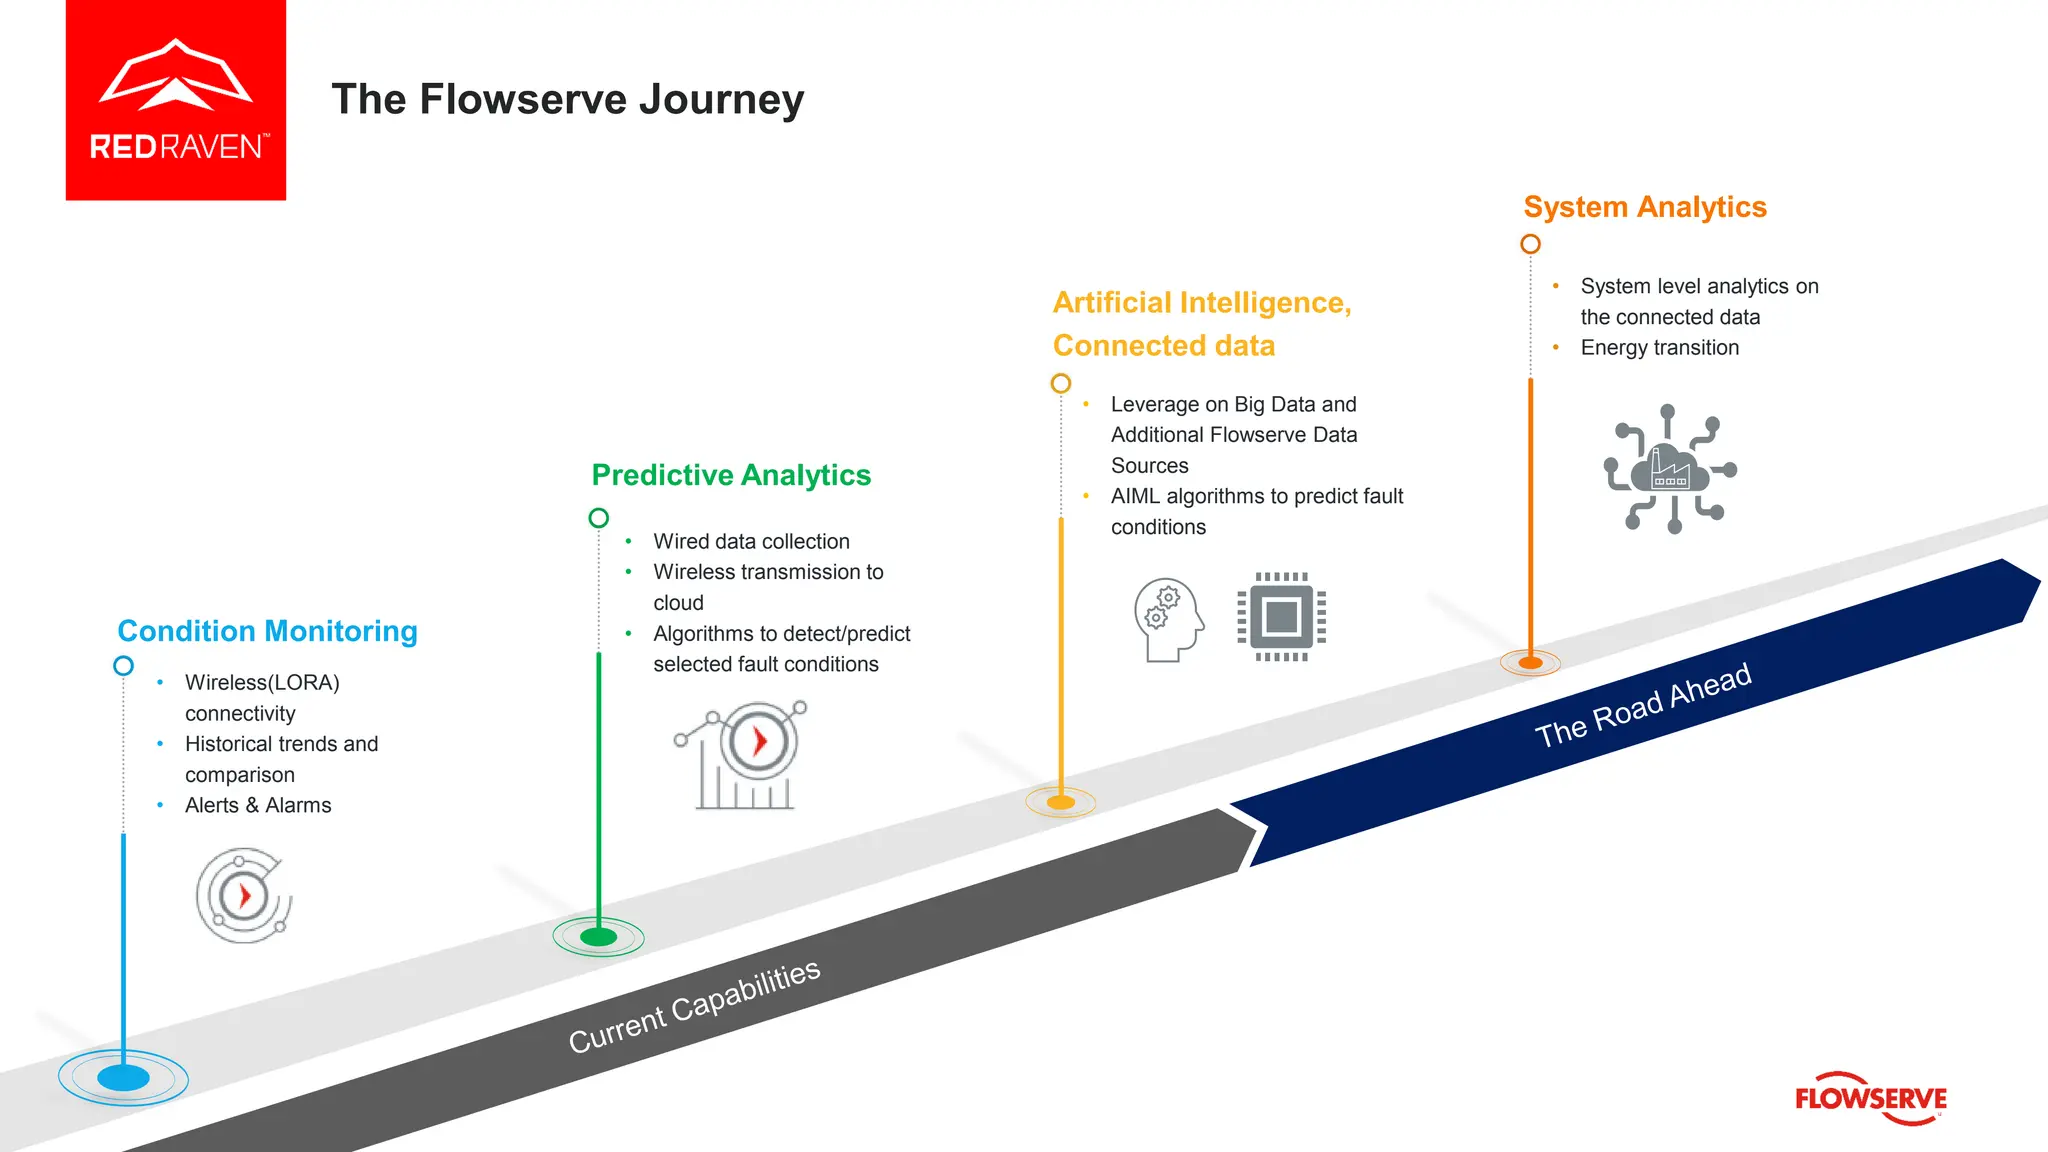
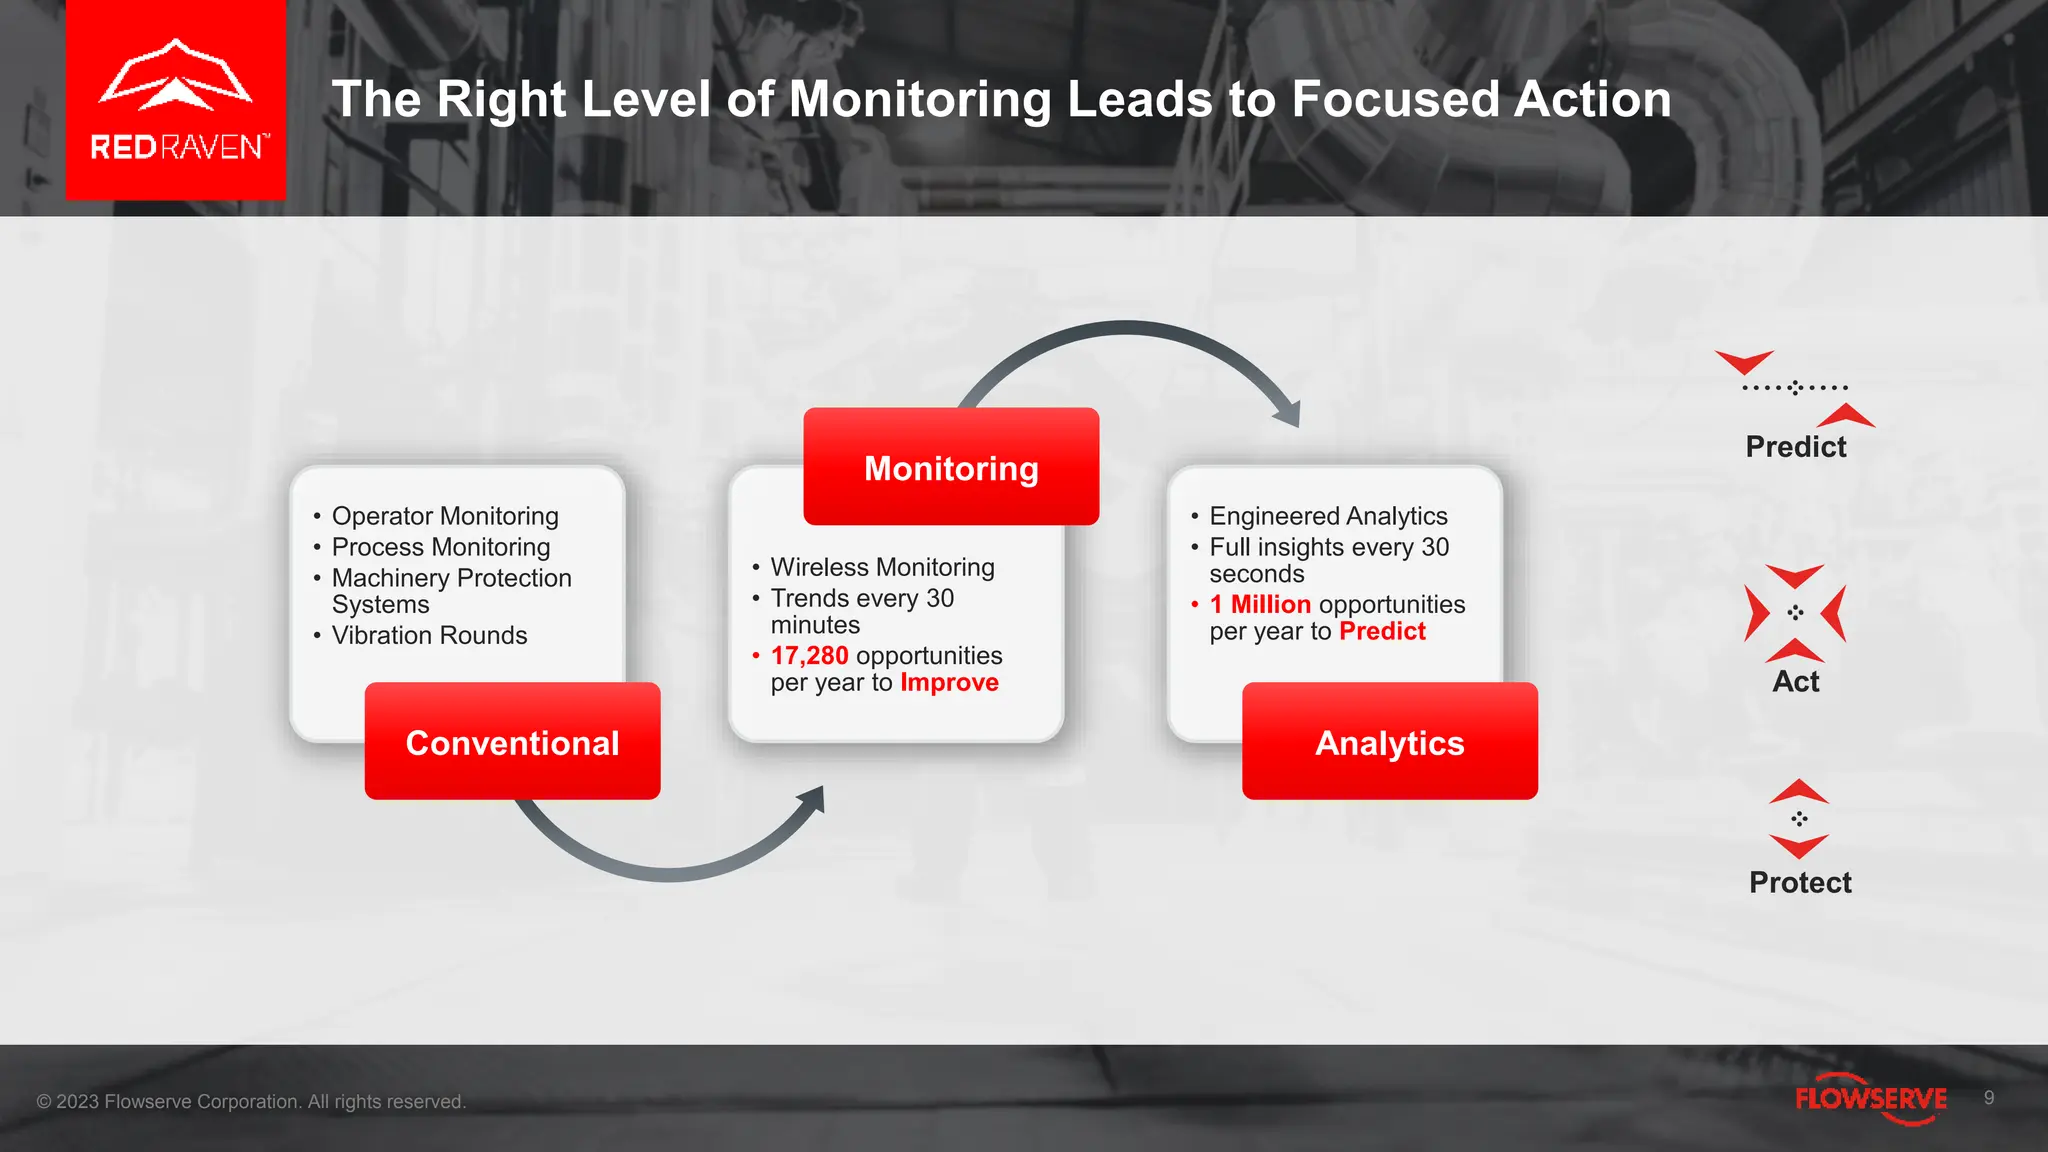
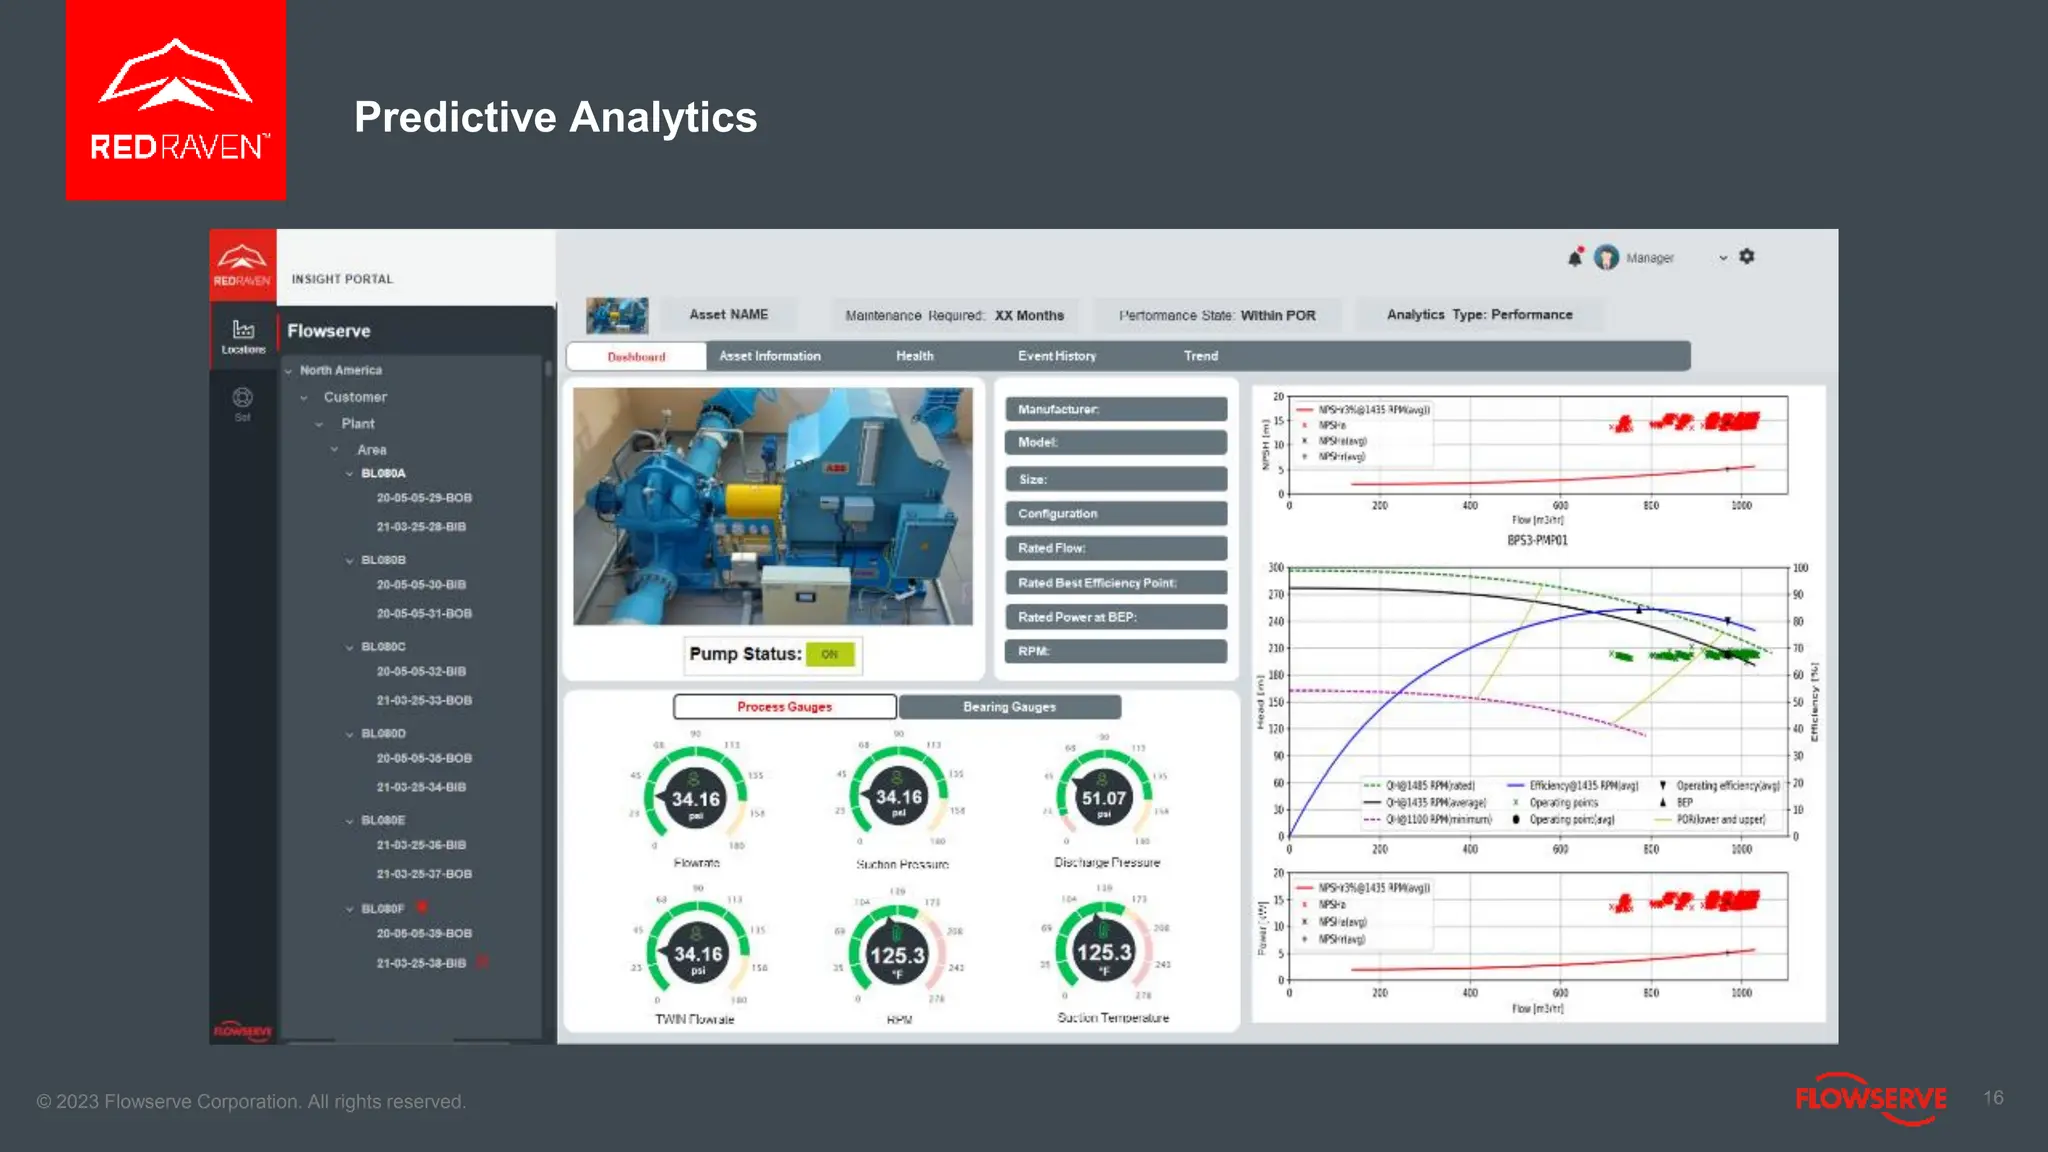
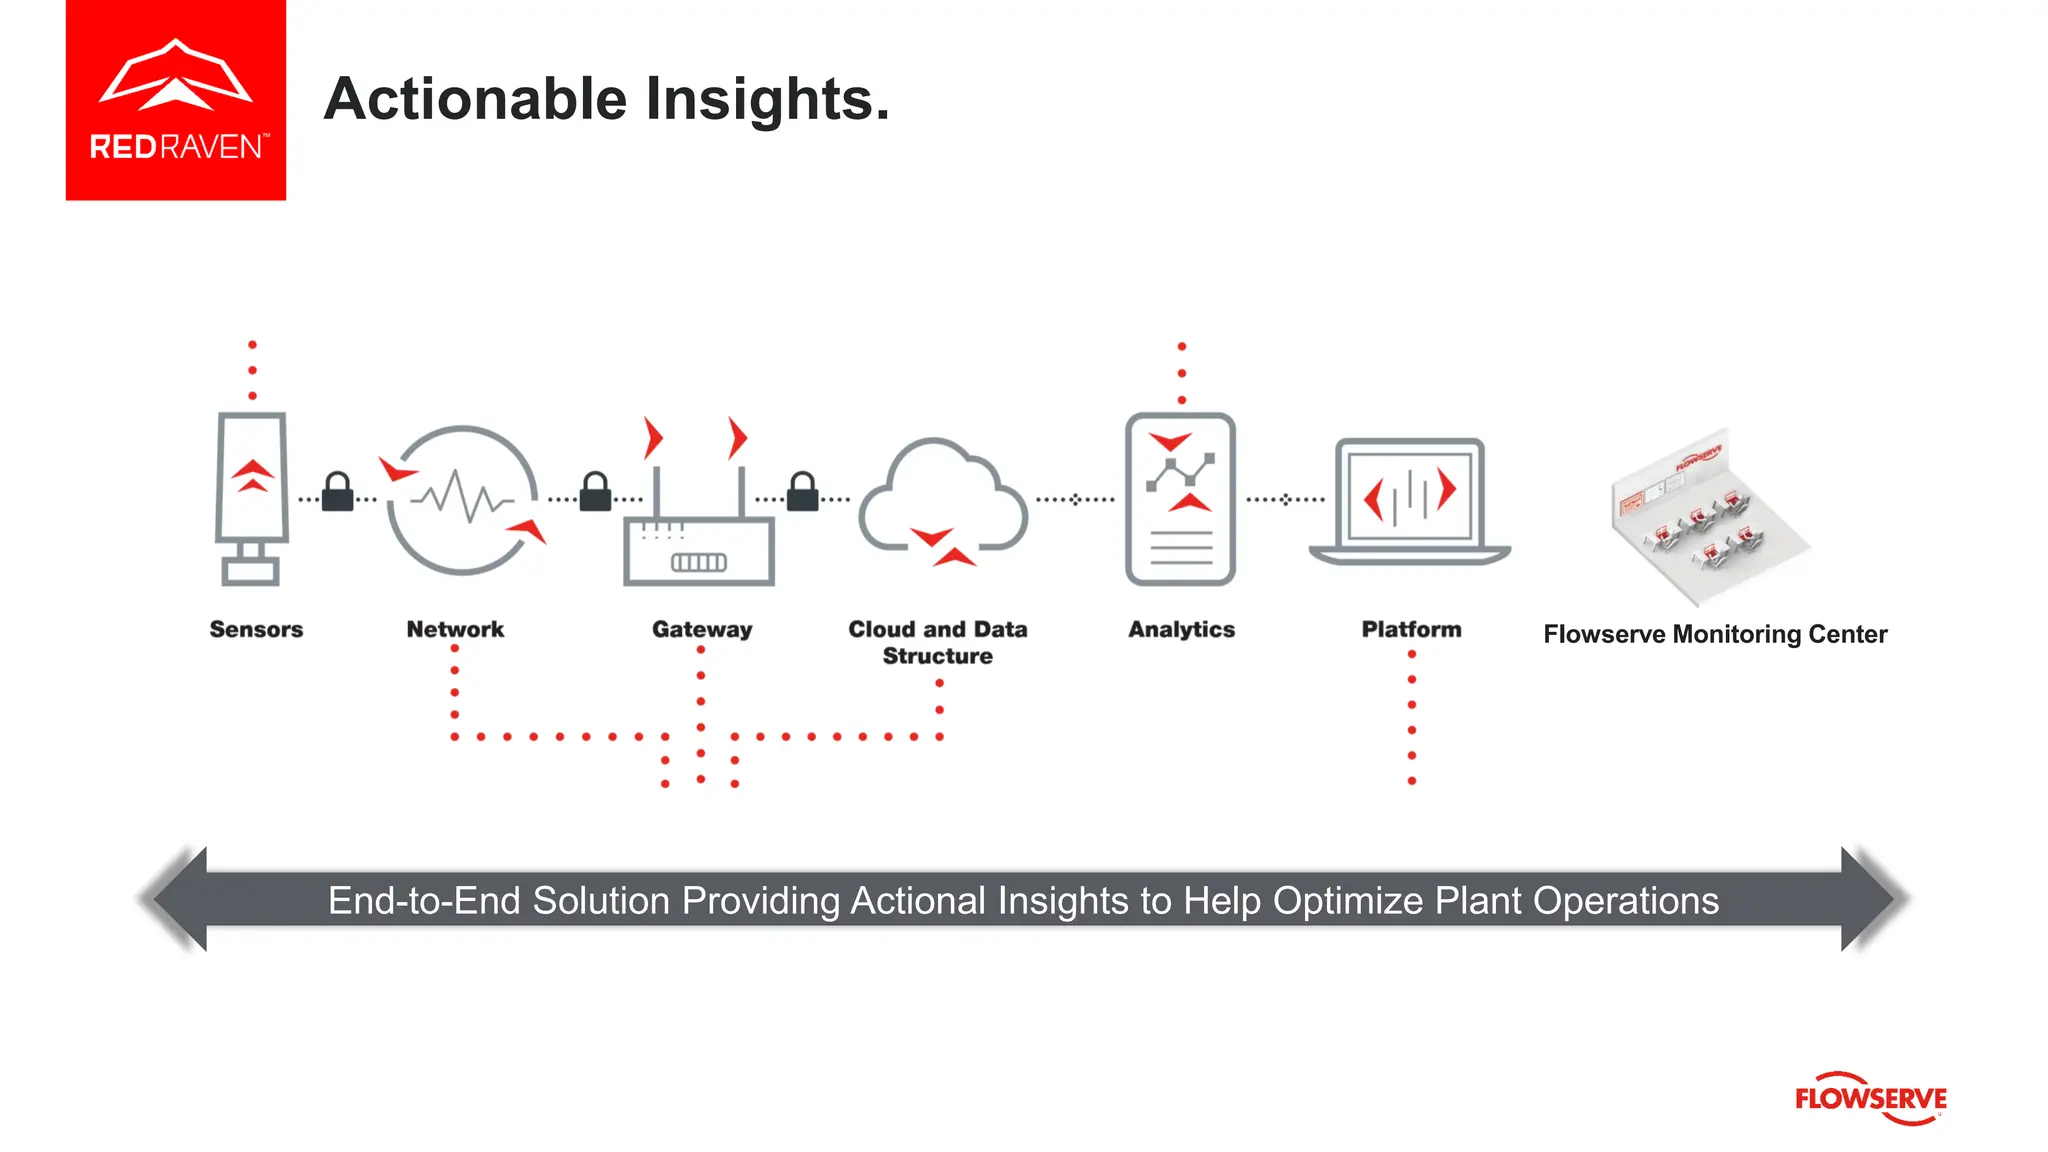
Predict Act Protect
1
How to develop effective plant maintenance and performance
optimization strategies for fluid control equipment
May 16, 2023
© 2023 Flowserve Corporation. All rights reserved.
About the viewer panel
Today’s Presenter
Michael Zimmerman is the Director of R&D for the Flowserve
RedRaven portfolio of Industrial Equipment Health Monitoring
solutions. Michael has been with Flowserve for over 12 years in
various engineering roles in the pump and digital R&D
organizations. He has worked as a pump mechanical and hydraulic
design engineer and R&D manager for Analytics and Additive
Manufacturing in Singapore before taking on the Director of R&D
role in Houston in early 2022. Michael is a graduate of the
University of Pittsburgh with a degree in Mechanical Engineering.
PRESENTER
Michael Zimmerman
Director, R&D
Flowserve
4
End-to-End, Complete Turnkey IoT Solution
4
Innovative sensors
Wired and/or wireless sensors collect vibration, pressure and
temperature data for analysis. Long-range wireless sensors
enable cost-effective monitoring of thousands of assets over
sprawling facilities.
Application-specific analysis
Equipment performance data is analyzed with technology
designed specifically for pumps, valves and seals, so you can
gain a clearer understanding of how to increase the efficiency,
productivity and reliability of the particular equipment you use
every day.
Secure communications
Our secure system architecture collects data from
equipment sensors and transmits it via a secure
encrypted network.
Trend reporting and notifications
Trend reports provide insights into equipment performance
over time, while emails and alerts inform you when an asset
experiences a problem, so you can take immediate action to
address it.
Flowserve Monitoring Center
Site specific view
• Alarms deeply embedded in DCS, AMS
• No easy way of determining health of all pumps
• People competency dependent
• Time consuming
Reactive
(Sudden
issues)
Conventional
Proactive
Identify
problem
Enterprise View
• One place to view health
of Pumps, Seals, Valves
• Multiple sites view
Centralized Support
Actionable Insights Provided
• Shared knowledge & insights
• Expertise on demand
Actionable
Insights
RedRaven - Proactive
5
Sustain production while faced with:
Energy Efficiency
Aging Infrastructure
Competency Management
Lack of support
Health & Safety
Reactive
Proactive
Sustainability:
Prevent equipment failures
Minimize downtime
Encourage resources management
Improve productivity
Reduce total cost of ownership
Lower maintenance costs
RedRaven™
Common
Failures
Mechanical Seals
• Leak (erosion, corrosion)
• Vaporizing Fluid
• High friction
• Lack of lubrication
• Thermal degradation of seals
Pumps
• Cavitation
• Misalignment
• Imbalance
• Roller Element Bearing Wear
30%
Reactive to Proactive Maintenance
The Flowserve Journey
Predictive Analytics
Artificial Intelligence,
Connected data
System Analytics
Condition Monitoring
• Wireless(LORA)
connectivity
• Historical trends and
comparison
• Alerts & Alarms
• Wired data collection
• Wireless transmission to
cloud
• Algorithms to detect/predict
selected fault conditions
• Leverage on Big Data and
Additional Flowserve Data
Sources
• AIML algorithms to predict fault
conditions
• System level analytics on
the connected data
• Energy transition
RedRaven™ Portfolio of Equipment Health Monitoring
CONDITION MONITORING
PREDICTIVE ANALYTICS
PUMPS
PUMPS
MECHANICAL
SEALS
POSITIONERS
ELECTRIC
ACTUATORS
VACUUM
PUMPS
EBULLATORS
For Critical Equipment
MECHANICAL
SEALS
8
Flowserve RedRaven™ Solutions for Your Entire Plant
WIRELESS CONDITION MONITORING
(80% of assets across balance of plant)
Near real-time wireless monitoring
(15/30 minutes) with alerts, trends
and instant notifications
PREDICTIVE ANALYTICS
(20% of assets that are
critical to production)
Near real-time monitoring
and diagnostics with
recommendations
Critical Systems: 5% Key Processes: 15% Balance of Plant: 80%
Predict
Act
Protect
The Right Level of Monitoring Leads to Focused Action
9
• Operator Monitoring
• Process Monitoring
• Machinery Protection
Systems
• Vibration Rounds
Conventional
• Wireless Monitoring
• Trends every 30
minutes
• 17,280 opportunities
per year to Improve
Monitoring
• Engineered Analytics
• Full insights every 30
seconds
• 1 Million opportunities
per year to Predict
Analytics
© 2023 Flowserve Corporation. All rights reserved.
Condition Monitoring vs Predictive Analytics vs Machine Learning
Predictive
Analytics
Machine
Learning
Condition
Monitoring
Condition
Monitoring
Condition Monitoring
11
© 2023 Flowserve Corporation. All rights reserved.
12
Pump Wireless LoRaWAN Condition Monitoring
© 2023 Flowserve Corporation. All rights reserved.
STRUCTURAL RESONANCE
ON VERTICAL PUMPS
• Intermittent high vibrations measured
• FMC analyzed the FFT data and determined that high
vibrations occurred at 1x rotating speed, with speed
range between 1350 and 1470 rpm.
• Customer provided speed logs from DCS, confirming
that high vibrations are caused by structural resonance.
• FMC and Customer are evaluating how to change the
logic for pumps operation to avoid critical speeds.
WATER, UK
EARLY IDENTIFICATION OF
POTENTIAL MISALIGNMENT
OR SOFTFOOT CONDITION
• High vibrations in horizontal and axial axis
• FMC analyzed the FFT data and determined that high
vibrations occurred at 1x, 2x, & 3x rotating speed
• Customer to check shaft alignment and soft foot.
• FMC and Customer are continuing to monitor as
process conditions and operation changes over time
Food & Beverage, UK
Condition Monitoring vs Predictive Analytics vs Machine Learning
Predictive
Analytics
Machine
Learning
Condition
Monitoring
Condition
Monitoring
Predictive
Analytics
Predictive Analytics
16
© 2023 Flowserve Corporation. All rights reserved.
17
Data Transfer Box - Wired Solution
© 2023 Flowserve Corporation. All rights reserved.
Predictive Analytics — Detect & Performance Program
18
• Sensors:
– 1 Detect on each bearing housing
– 2 pressure sensors (suction/discharge)
– 1 temperature sensor (pumped fluid temp)
– 1 flow meter (optional)
# Fault Group Failure Modes
1 Mechanical Rotor Imbalance
2 Mechanical Pump & Motor Misalignment
3 Mechanical Excessive Pipe Strain
4 Mechanical Mechanical Looseness
5 Hydraulic Suction Recirculation
6 Hydraulic Cavitation
7 Hydraulic Dry Running Condition
8 Tribology Internal Rubbing
9 Tribology Roller Element Bearing Wear
10 Tribology Mag Coupling Slip or Disengagement
11 Tribology Coupling Pin Wear
12 Dynamic Structural Resonance
13 Hydraulic Live Performance Operating Points (Q-H, Eff, P, NPSH)
14 Hydraulic Internal Flow Recirculation
15 Prognostics Flow Capacity – Time to Maintenance for Wear Parts
16 Energy Waste Internal Pump Wear & Off BEP Operations
Performance Program
Detect Program
19
Mechanical Seals
MONITORING THE SEAL CHAMBER AND
SUPPORT SYSTEM
• Seal chamber conditions are directly related to seal
health.
• Support system conditions give early warning
information on deterioration of the seal chamber
environment.
• Support systems are grouped by their function.
• Sensor packages are tailored to the support system
group.
• Best, earliest indicator of overall system health
• Used on the same equipment
• Taking the same type of readings
SEALS CONDITION MONITORING CLOSELY
FOLLOWS PUMPS
Predictive Analytics — Mechanical Seal & Piping Plan 11, 13, 14
20
• Sensors:
– 2 pressure sensors - Seal Chamber (R) Flush In (O)
– 2 temperature sensor - Seal Chamber (R) & Flush In (O)
– 1 flow meter – Flush (O)
# Fault Group Failure Modes
1 Tribology Coefficient of friction at seal face
2 Tribology Seal chamber fluid vaporization
3 Mechanical O-ring temperature rating
4 Mechanical O-ring extrusion
5 Mechanical Seal rating
6 Mechanical Drive collar slipping
7 Hydraulic Lubrication film vaporization
8 Hydraulic Piping plan 11 performance
9 Hydraulic Piping plan 13 performance
10 Hydraulic Piping plan 14 performance
Temp
Press
Level
Flow
21
Predictive Analytics – SIHI Vacuum Systems
SIHI Dry - ACD2
SIHI Dry Control SIHI Boost Compact SIHI Dry SIHI Boost
All sensors for IoT are part of the SIHI Dry / Boost System. No further sensor installations required!
Predictive Analytics — SIHI Dry / Boost
22
# Failure Group Failure Modes and Fault Conditions
1 Pump Pump load index
2 Pump Pump cooling jacket temperature
3 Drive Drive ambient temperature
4 Drive Drive output stage temperature
5 Pressure Inlet pressure PT1 out of range
6 Pressure High dynamic pressure PT2 at outlet
7 Pressure Low back pressure PT3 at outlet
8 Pressure High back pressure PT3 at outlet
9 Dirt Dirt detection
10 Tribology Early failure detection
11 Tribology Pump failure
12 Tribology Maintenance Service Needed
13 Condition Monitoring Performance Monitoring / Status
> 1500 Detail Trouble Codes
Detail / Impact / Recommendation
SIHI BOOST APPLICATION
If the SIHI Boost is equipped with RedRaven and the unit
is operated within the allowable operational range and
design parameters, the following can be confidently
improved:
✓ Increase in pump uptime and availability
✓ Reduction in spindle replacement and/or parts repair
related to the spindle and/or other components
✓ Reduction of unplanned maintenance and as a result
overall maintenance costs are reduced when
considering maintenance & repair costs without
RedRaven
✓ Remote Flowserve Monitoring Center team support
saves precious time used up due to site survey & on call
service engineer visits for diagnosis
F&B, INDIA
Yearly production
loss & spindle
replacement
costs
RedRaven
Investment
Return on
investment (%)
Payback period
USD 61,000 per
line
USD 17,500 per
line per year
348
0.3 years or 3.5
months
THE POWER OF
PREDICTIVE ANALYTICS
AND DETECT
ALGORITHMS
• A 132KW Direct driven (impeller mounted on motor shaft) Primary
Air Fan running at constant speed of 990 RPM, had developed a
minor increase in vibration levels. Though the values were within
threshold levels,1/3rd octave band spectrum identified 75% of the
dominant frequency corresponding to the produced vibration
values were related to 1X of the operating speed confirming the
root cause to be minor imbalance in the impeller.
• Boiler Feed Water Pump, running at 2950 RPM was suddenly
facing higher vibration levels occurring at intermittent time interval.
Detect algorithm confirmed vibration levels occurring at higher
frequency ranges (above 3200 Hz) confirming it to flow related
issue which was later confirmed by the customer.
Power Plant, UK
EARLY IDENTIFICATION OF
ABNORMAL CONDITIONS
DURING PUMP START UP
• Customer performed routine restart
• Higher than normal vibration detected - alert issued
w/recommendation
• Customer investigating process conditions (strainer)
• Also notified of less than optimal efficiency conditions
WATER, OMAN
Anomaly
detected,
customer
informed Performance
degradations,
opportunity for
improvement
ENERGY SAVINGS
OPPORTUNITY
$32,000 energy
savings per year
with pump rerate
• Several pumps in a potable water pumping station in Oman are operated most
of the time away from the Best Efficiency Point (BEP), resulting in a significant
efficiency drop.
• Flowserve’s specialists estimated that customer could save $32,000 per pump
per year if the pump impeller is rerated to move the BEP closer to the most
frequent operating conditions.
• Flowserve’s Engineering and Commercial teams are now evaluating this
rerate opportunity in details, to help our customer to justify the investment.
WATER, OMAN
Condition Monitoring vs Predictive Analytics vs Machine Learning
Predictive
Analytics
Machine
Learning
Condition
Monitoring
Condition
Monitoring
Predictive
Analytics
Machine
Learning
• Anomaly Detected highlighted – close coordination with Flowserve Monitoring Center and Analytics Development Teams
• Overall values are still within manual alarm threshold in both these cases, but behavioral change was detected by the algorithm
Anomaly Detection
(based on internally deployed Anomaly Detection solution for Node based Condition Monitoring)
Jan 2023
Process Change Confirmed
Historical normal behavior
Anomaly detected
March 2023
Cavitation Confirmed
Historical normal behavior
Anomaly detected
“FFT Analysis with the analyzer
confirms slight cavitation”
“Thanks team, this is really cool. Ok for me to
share this value-added benefit with some of my
peers? Good opportunity to also convey to
customer that the Monitoring Center is watching
their equipment and keeping tabs on it.”
What is Flowserve Monitoring Center (FMC)?
29
• A state-of-the-art facility with a dedicated monitoring team to
analyze Customer’s asset performance
• The FMC will alert operators of equipment anomalies to
reduce unplanned downtime
• The FMC provides remote technical support and deploys
resources as required to address equipment issues before
impacting Customer operations
• A staff of experienced vibration engineers, technicians, data
analysts, and project managers guide Customers and keep
their equipment online; running at peak efficiency
• With several years of aggregate data, in conjunction with
vibration engineering principles, the FMC can provide
Customers with deeper insights to drive optimization
© 2023 Flowserve Corporation. All rights reserved.
24/7 Monitoring and Customer Communication
Actionable Insights.
Flowserve Monitoring Center
End-to-End Solution Providing Actional Insights to Help Optimize Plant Operations
Predict Act Protect
32
Questions?
© 2021 Flowserve Corporation. All rights reserved.
Questions?
Type your question in the “Ask a Question” box on the Webcast Console and click “Send.” We will
get to as many questions as we have time for. Questions that are for today’s presenters will be
answered verbally during the Q&A session.
Exit Survey:
Please take a moment to answer a few questions on our exit survey that will pop up on your screen
at the conclusion of the webcast. We use the answers to help make improvements to our webcast
program.
Archive:
▪ Within 7 days, an archive with Q&A will be posted
▪ We will send an email to registered attendees with hyperlink
▪ Can also access from the plantengineering.com home page
Submitting Questions, Exit Survey and Archive
Predict Act Protect
34
How to develop effective plant maintenance and performance
optimization strategies for fluid control equipment
May 16, 2023
© 2023 Flowserve Corporation. All rights reserved.

PE230516_Flowserve_WC_presentation_FINAL.pdf

  • 1.
    Predict Act Protect 1 Howto develop effective plant maintenance and performance optimization strategies for fluid control equipment May 16, 2023 © 2023 Flowserve Corporation. All rights reserved.
  • 2.
  • 3.
    Today’s Presenter Michael Zimmermanis the Director of R&D for the Flowserve RedRaven portfolio of Industrial Equipment Health Monitoring solutions. Michael has been with Flowserve for over 12 years in various engineering roles in the pump and digital R&D organizations. He has worked as a pump mechanical and hydraulic design engineer and R&D manager for Analytics and Additive Manufacturing in Singapore before taking on the Director of R&D role in Houston in early 2022. Michael is a graduate of the University of Pittsburgh with a degree in Mechanical Engineering. PRESENTER Michael Zimmerman Director, R&D Flowserve
  • 4.
    4 End-to-End, Complete TurnkeyIoT Solution 4 Innovative sensors Wired and/or wireless sensors collect vibration, pressure and temperature data for analysis. Long-range wireless sensors enable cost-effective monitoring of thousands of assets over sprawling facilities. Application-specific analysis Equipment performance data is analyzed with technology designed specifically for pumps, valves and seals, so you can gain a clearer understanding of how to increase the efficiency, productivity and reliability of the particular equipment you use every day. Secure communications Our secure system architecture collects data from equipment sensors and transmits it via a secure encrypted network. Trend reporting and notifications Trend reports provide insights into equipment performance over time, while emails and alerts inform you when an asset experiences a problem, so you can take immediate action to address it. Flowserve Monitoring Center
  • 5.
    Site specific view •Alarms deeply embedded in DCS, AMS • No easy way of determining health of all pumps • People competency dependent • Time consuming Reactive (Sudden issues) Conventional Proactive Identify problem Enterprise View • One place to view health of Pumps, Seals, Valves • Multiple sites view Centralized Support Actionable Insights Provided • Shared knowledge & insights • Expertise on demand Actionable Insights RedRaven - Proactive 5 Sustain production while faced with: Energy Efficiency Aging Infrastructure Competency Management Lack of support Health & Safety Reactive Proactive Sustainability: Prevent equipment failures Minimize downtime Encourage resources management Improve productivity Reduce total cost of ownership Lower maintenance costs RedRaven™ Common Failures Mechanical Seals • Leak (erosion, corrosion) • Vaporizing Fluid • High friction • Lack of lubrication • Thermal degradation of seals Pumps • Cavitation • Misalignment • Imbalance • Roller Element Bearing Wear 30% Reactive to Proactive Maintenance
  • 6.
    The Flowserve Journey PredictiveAnalytics Artificial Intelligence, Connected data System Analytics Condition Monitoring • Wireless(LORA) connectivity • Historical trends and comparison • Alerts & Alarms • Wired data collection • Wireless transmission to cloud • Algorithms to detect/predict selected fault conditions • Leverage on Big Data and Additional Flowserve Data Sources • AIML algorithms to predict fault conditions • System level analytics on the connected data • Energy transition
  • 7.
    RedRaven™ Portfolio ofEquipment Health Monitoring CONDITION MONITORING PREDICTIVE ANALYTICS PUMPS PUMPS MECHANICAL SEALS POSITIONERS ELECTRIC ACTUATORS VACUUM PUMPS EBULLATORS For Critical Equipment MECHANICAL SEALS
  • 8.
    8 Flowserve RedRaven™ Solutionsfor Your Entire Plant WIRELESS CONDITION MONITORING (80% of assets across balance of plant) Near real-time wireless monitoring (15/30 minutes) with alerts, trends and instant notifications PREDICTIVE ANALYTICS (20% of assets that are critical to production) Near real-time monitoring and diagnostics with recommendations Critical Systems: 5% Key Processes: 15% Balance of Plant: 80%
  • 9.
    Predict Act Protect The Right Levelof Monitoring Leads to Focused Action 9 • Operator Monitoring • Process Monitoring • Machinery Protection Systems • Vibration Rounds Conventional • Wireless Monitoring • Trends every 30 minutes • 17,280 opportunities per year to Improve Monitoring • Engineered Analytics • Full insights every 30 seconds • 1 Million opportunities per year to Predict Analytics © 2023 Flowserve Corporation. All rights reserved.
  • 10.
    Condition Monitoring vsPredictive Analytics vs Machine Learning Predictive Analytics Machine Learning Condition Monitoring Condition Monitoring
  • 11.
    Condition Monitoring 11 © 2023Flowserve Corporation. All rights reserved.
  • 12.
    12 Pump Wireless LoRaWANCondition Monitoring © 2023 Flowserve Corporation. All rights reserved.
  • 13.
    STRUCTURAL RESONANCE ON VERTICALPUMPS • Intermittent high vibrations measured • FMC analyzed the FFT data and determined that high vibrations occurred at 1x rotating speed, with speed range between 1350 and 1470 rpm. • Customer provided speed logs from DCS, confirming that high vibrations are caused by structural resonance. • FMC and Customer are evaluating how to change the logic for pumps operation to avoid critical speeds. WATER, UK
  • 14.
    EARLY IDENTIFICATION OF POTENTIALMISALIGNMENT OR SOFTFOOT CONDITION • High vibrations in horizontal and axial axis • FMC analyzed the FFT data and determined that high vibrations occurred at 1x, 2x, & 3x rotating speed • Customer to check shaft alignment and soft foot. • FMC and Customer are continuing to monitor as process conditions and operation changes over time Food & Beverage, UK
  • 15.
    Condition Monitoring vsPredictive Analytics vs Machine Learning Predictive Analytics Machine Learning Condition Monitoring Condition Monitoring Predictive Analytics
  • 16.
    Predictive Analytics 16 © 2023Flowserve Corporation. All rights reserved.
  • 17.
    17 Data Transfer Box- Wired Solution © 2023 Flowserve Corporation. All rights reserved.
  • 18.
    Predictive Analytics —Detect & Performance Program 18 • Sensors: – 1 Detect on each bearing housing – 2 pressure sensors (suction/discharge) – 1 temperature sensor (pumped fluid temp) – 1 flow meter (optional) # Fault Group Failure Modes 1 Mechanical Rotor Imbalance 2 Mechanical Pump & Motor Misalignment 3 Mechanical Excessive Pipe Strain 4 Mechanical Mechanical Looseness 5 Hydraulic Suction Recirculation 6 Hydraulic Cavitation 7 Hydraulic Dry Running Condition 8 Tribology Internal Rubbing 9 Tribology Roller Element Bearing Wear 10 Tribology Mag Coupling Slip or Disengagement 11 Tribology Coupling Pin Wear 12 Dynamic Structural Resonance 13 Hydraulic Live Performance Operating Points (Q-H, Eff, P, NPSH) 14 Hydraulic Internal Flow Recirculation 15 Prognostics Flow Capacity – Time to Maintenance for Wear Parts 16 Energy Waste Internal Pump Wear & Off BEP Operations Performance Program Detect Program
  • 19.
    19 Mechanical Seals MONITORING THESEAL CHAMBER AND SUPPORT SYSTEM • Seal chamber conditions are directly related to seal health. • Support system conditions give early warning information on deterioration of the seal chamber environment. • Support systems are grouped by their function. • Sensor packages are tailored to the support system group. • Best, earliest indicator of overall system health • Used on the same equipment • Taking the same type of readings SEALS CONDITION MONITORING CLOSELY FOLLOWS PUMPS
  • 20.
    Predictive Analytics —Mechanical Seal & Piping Plan 11, 13, 14 20 • Sensors: – 2 pressure sensors - Seal Chamber (R) Flush In (O) – 2 temperature sensor - Seal Chamber (R) & Flush In (O) – 1 flow meter – Flush (O) # Fault Group Failure Modes 1 Tribology Coefficient of friction at seal face 2 Tribology Seal chamber fluid vaporization 3 Mechanical O-ring temperature rating 4 Mechanical O-ring extrusion 5 Mechanical Seal rating 6 Mechanical Drive collar slipping 7 Hydraulic Lubrication film vaporization 8 Hydraulic Piping plan 11 performance 9 Hydraulic Piping plan 13 performance 10 Hydraulic Piping plan 14 performance Temp Press Level Flow
  • 21.
    21 Predictive Analytics –SIHI Vacuum Systems SIHI Dry - ACD2 SIHI Dry Control SIHI Boost Compact SIHI Dry SIHI Boost All sensors for IoT are part of the SIHI Dry / Boost System. No further sensor installations required!
  • 22.
    Predictive Analytics —SIHI Dry / Boost 22 # Failure Group Failure Modes and Fault Conditions 1 Pump Pump load index 2 Pump Pump cooling jacket temperature 3 Drive Drive ambient temperature 4 Drive Drive output stage temperature 5 Pressure Inlet pressure PT1 out of range 6 Pressure High dynamic pressure PT2 at outlet 7 Pressure Low back pressure PT3 at outlet 8 Pressure High back pressure PT3 at outlet 9 Dirt Dirt detection 10 Tribology Early failure detection 11 Tribology Pump failure 12 Tribology Maintenance Service Needed 13 Condition Monitoring Performance Monitoring / Status > 1500 Detail Trouble Codes Detail / Impact / Recommendation
  • 23.
    SIHI BOOST APPLICATION Ifthe SIHI Boost is equipped with RedRaven and the unit is operated within the allowable operational range and design parameters, the following can be confidently improved: ✓ Increase in pump uptime and availability ✓ Reduction in spindle replacement and/or parts repair related to the spindle and/or other components ✓ Reduction of unplanned maintenance and as a result overall maintenance costs are reduced when considering maintenance & repair costs without RedRaven ✓ Remote Flowserve Monitoring Center team support saves precious time used up due to site survey & on call service engineer visits for diagnosis F&B, INDIA Yearly production loss & spindle replacement costs RedRaven Investment Return on investment (%) Payback period USD 61,000 per line USD 17,500 per line per year 348 0.3 years or 3.5 months
  • 24.
    THE POWER OF PREDICTIVEANALYTICS AND DETECT ALGORITHMS • A 132KW Direct driven (impeller mounted on motor shaft) Primary Air Fan running at constant speed of 990 RPM, had developed a minor increase in vibration levels. Though the values were within threshold levels,1/3rd octave band spectrum identified 75% of the dominant frequency corresponding to the produced vibration values were related to 1X of the operating speed confirming the root cause to be minor imbalance in the impeller. • Boiler Feed Water Pump, running at 2950 RPM was suddenly facing higher vibration levels occurring at intermittent time interval. Detect algorithm confirmed vibration levels occurring at higher frequency ranges (above 3200 Hz) confirming it to flow related issue which was later confirmed by the customer. Power Plant, UK
  • 25.
    EARLY IDENTIFICATION OF ABNORMALCONDITIONS DURING PUMP START UP • Customer performed routine restart • Higher than normal vibration detected - alert issued w/recommendation • Customer investigating process conditions (strainer) • Also notified of less than optimal efficiency conditions WATER, OMAN Anomaly detected, customer informed Performance degradations, opportunity for improvement
  • 26.
    ENERGY SAVINGS OPPORTUNITY $32,000 energy savingsper year with pump rerate • Several pumps in a potable water pumping station in Oman are operated most of the time away from the Best Efficiency Point (BEP), resulting in a significant efficiency drop. • Flowserve’s specialists estimated that customer could save $32,000 per pump per year if the pump impeller is rerated to move the BEP closer to the most frequent operating conditions. • Flowserve’s Engineering and Commercial teams are now evaluating this rerate opportunity in details, to help our customer to justify the investment. WATER, OMAN
  • 27.
    Condition Monitoring vsPredictive Analytics vs Machine Learning Predictive Analytics Machine Learning Condition Monitoring Condition Monitoring Predictive Analytics Machine Learning
  • 28.
    • Anomaly Detectedhighlighted – close coordination with Flowserve Monitoring Center and Analytics Development Teams • Overall values are still within manual alarm threshold in both these cases, but behavioral change was detected by the algorithm Anomaly Detection (based on internally deployed Anomaly Detection solution for Node based Condition Monitoring) Jan 2023 Process Change Confirmed Historical normal behavior Anomaly detected March 2023 Cavitation Confirmed Historical normal behavior Anomaly detected “FFT Analysis with the analyzer confirms slight cavitation” “Thanks team, this is really cool. Ok for me to share this value-added benefit with some of my peers? Good opportunity to also convey to customer that the Monitoring Center is watching their equipment and keeping tabs on it.”
  • 29.
    What is FlowserveMonitoring Center (FMC)? 29 • A state-of-the-art facility with a dedicated monitoring team to analyze Customer’s asset performance • The FMC will alert operators of equipment anomalies to reduce unplanned downtime • The FMC provides remote technical support and deploys resources as required to address equipment issues before impacting Customer operations • A staff of experienced vibration engineers, technicians, data analysts, and project managers guide Customers and keep their equipment online; running at peak efficiency • With several years of aggregate data, in conjunction with vibration engineering principles, the FMC can provide Customers with deeper insights to drive optimization © 2023 Flowserve Corporation. All rights reserved.
  • 30.
    24/7 Monitoring andCustomer Communication
  • 31.
    Actionable Insights. Flowserve MonitoringCenter End-to-End Solution Providing Actional Insights to Help Optimize Plant Operations
  • 32.
    Predict Act Protect 32 Questions? ©2021 Flowserve Corporation. All rights reserved.
  • 33.
    Questions? Type your questionin the “Ask a Question” box on the Webcast Console and click “Send.” We will get to as many questions as we have time for. Questions that are for today’s presenters will be answered verbally during the Q&A session. Exit Survey: Please take a moment to answer a few questions on our exit survey that will pop up on your screen at the conclusion of the webcast. We use the answers to help make improvements to our webcast program. Archive: ▪ Within 7 days, an archive with Q&A will be posted ▪ We will send an email to registered attendees with hyperlink ▪ Can also access from the plantengineering.com home page Submitting Questions, Exit Survey and Archive
  • 34.
    Predict Act Protect 34 Howto develop effective plant maintenance and performance optimization strategies for fluid control equipment May 16, 2023 © 2023 Flowserve Corporation. All rights reserved.