Download to read offline


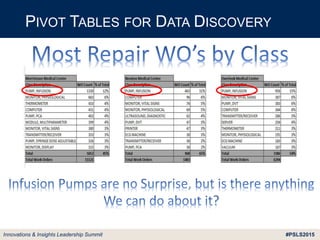
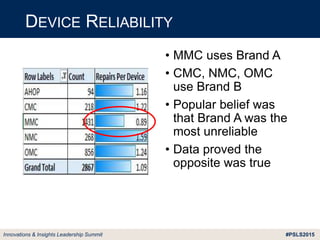
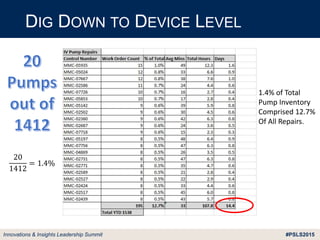


This document discusses how clinical engineering departments can utilize everyday tools like Excel, XLMiner and Tableau to analyze untapped data from their computerized maintenance management systems (CMMS). Specific techniques demonstrated include pivot tables, market basket analysis, clustering, and dual-axis and other visualizations. The analysis can provide insights into equipment reliability issues, common part replacements, and user training needs to optimize clinical engineering operations and resources.


