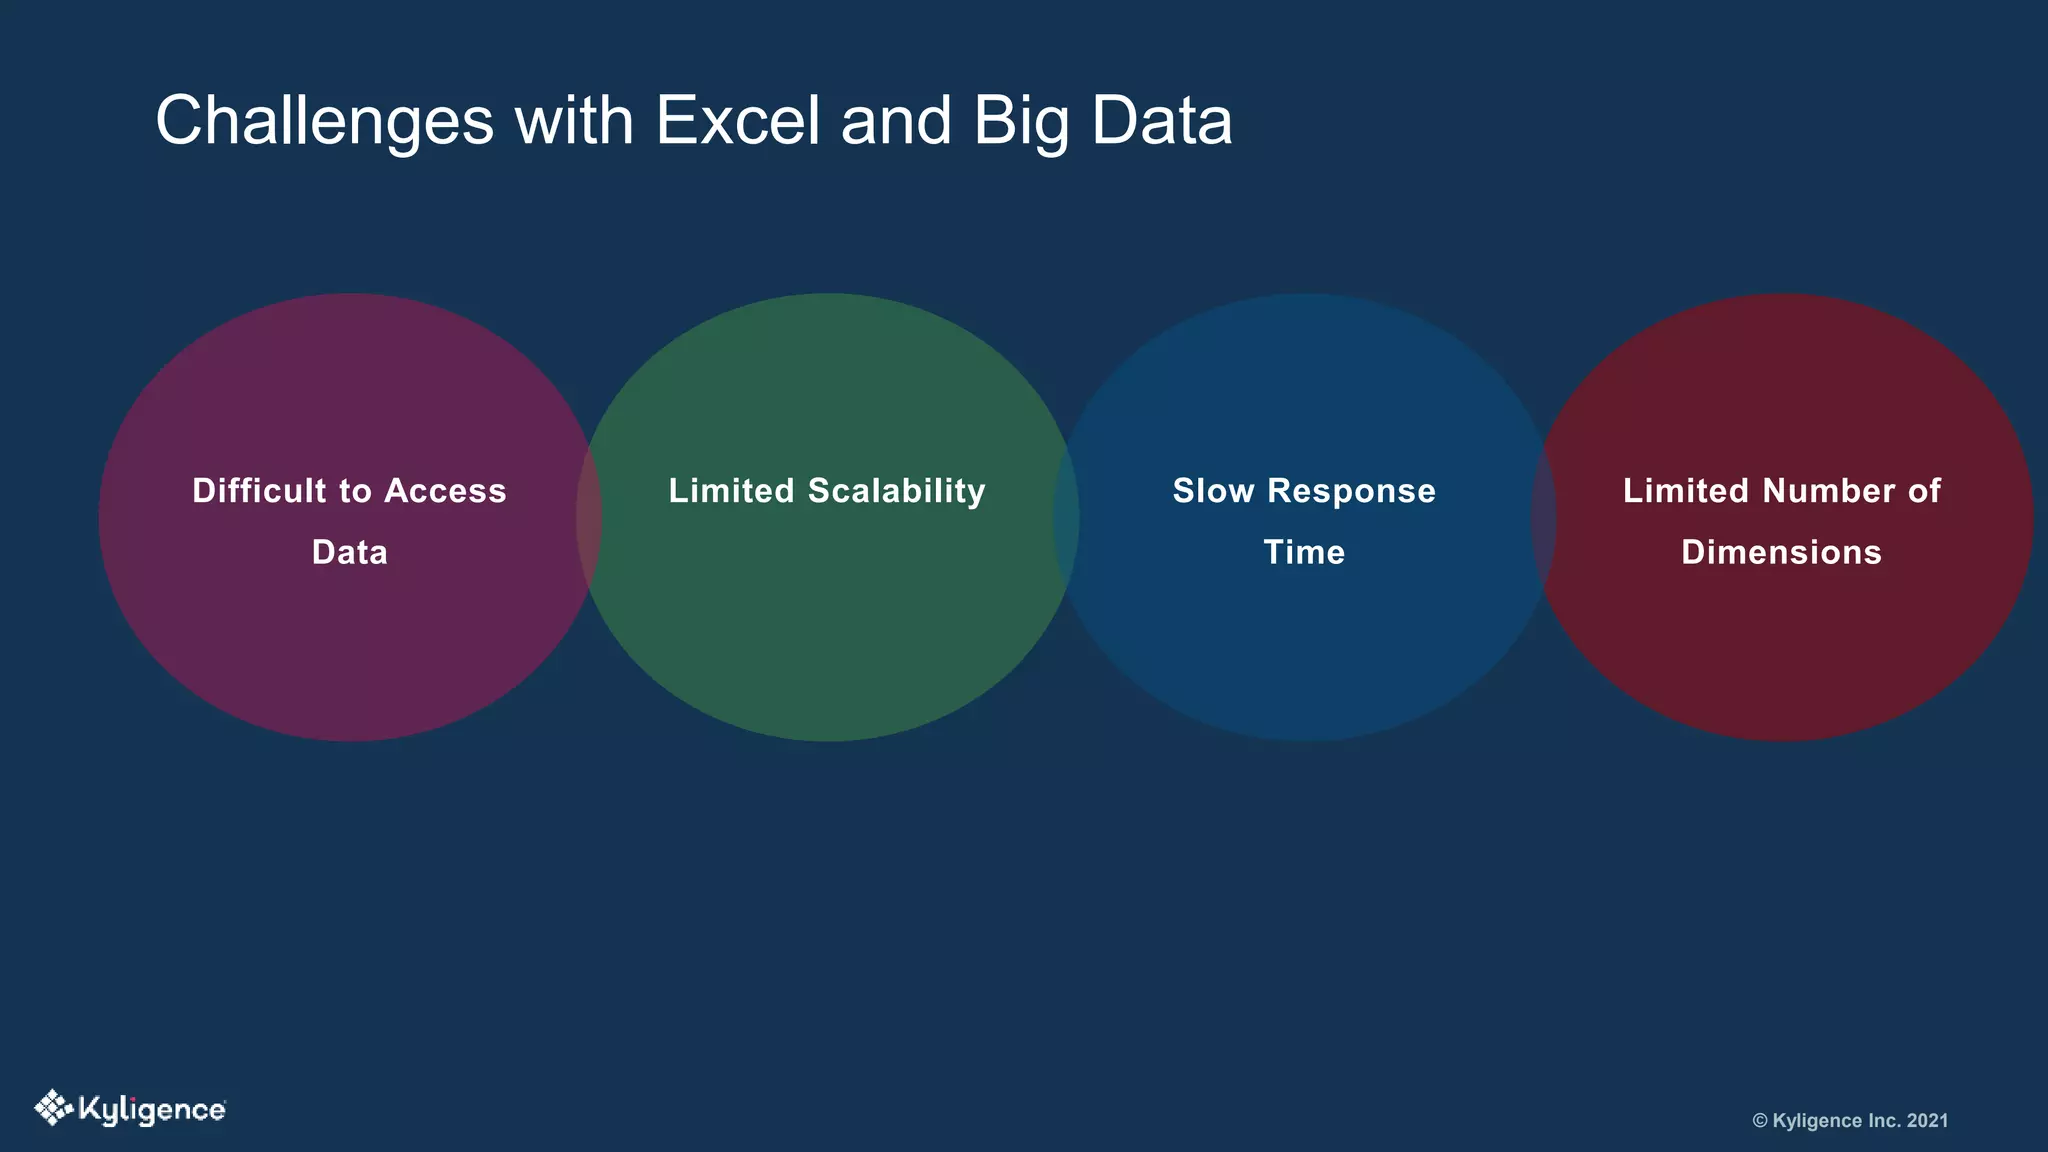
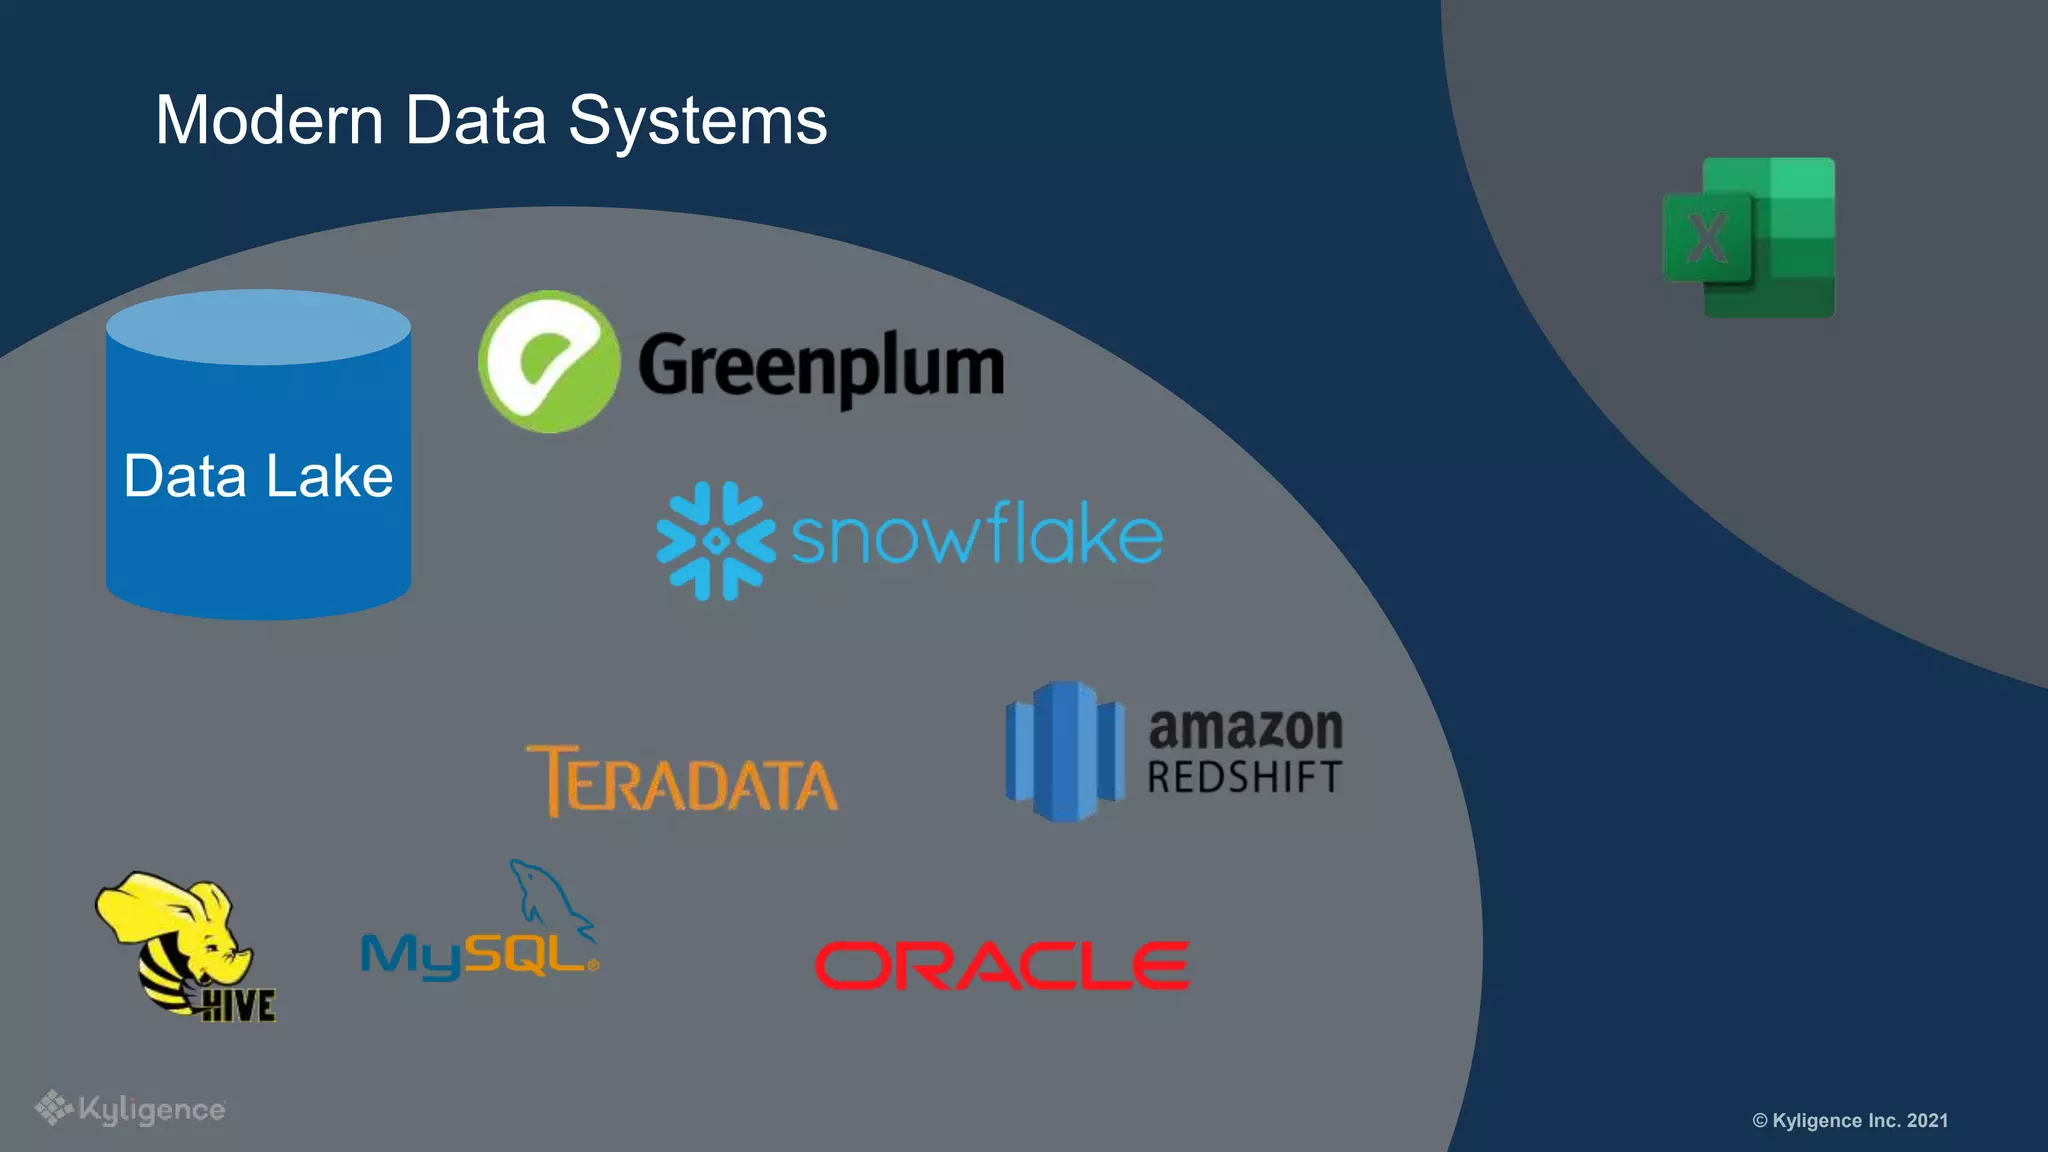
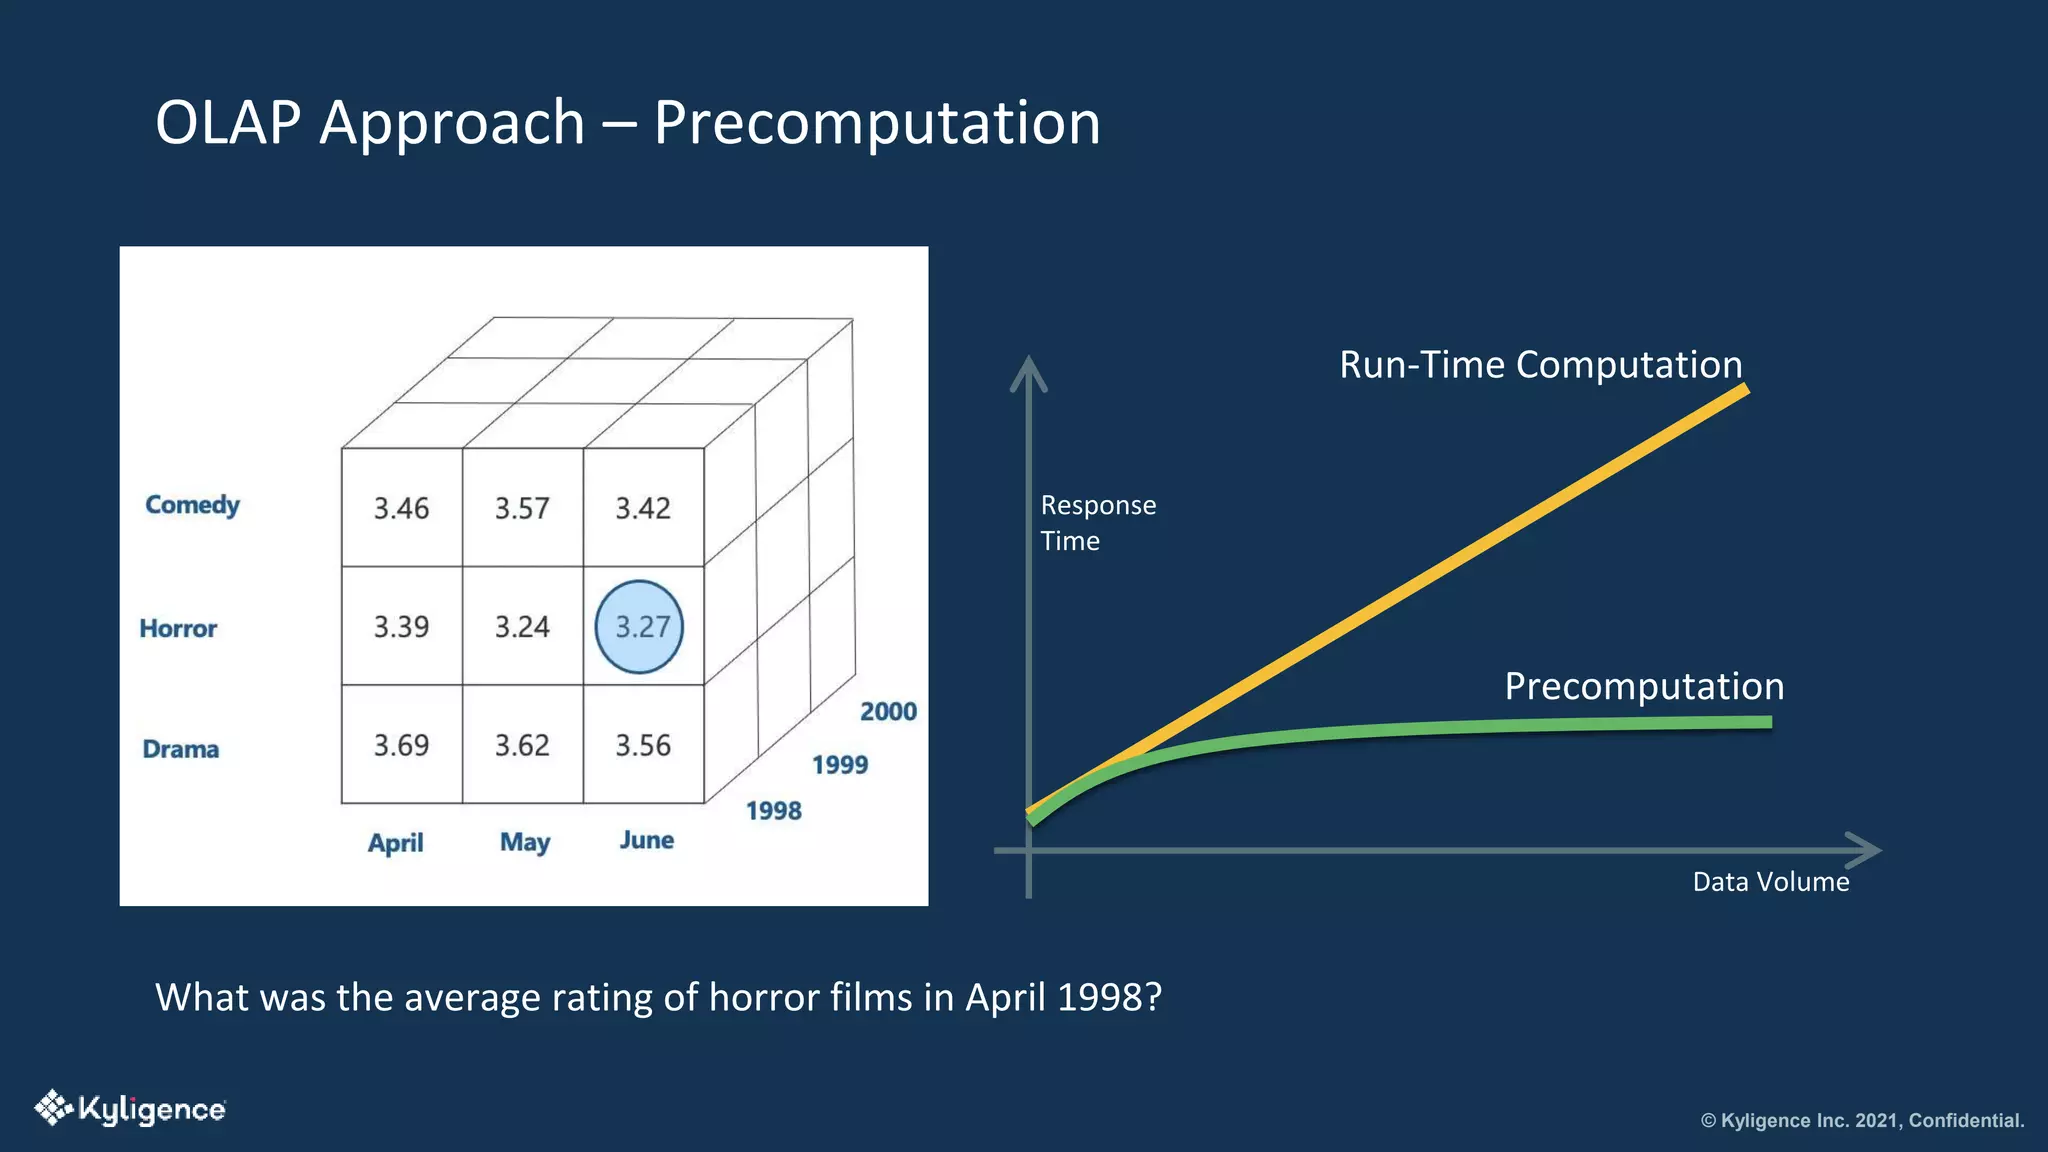
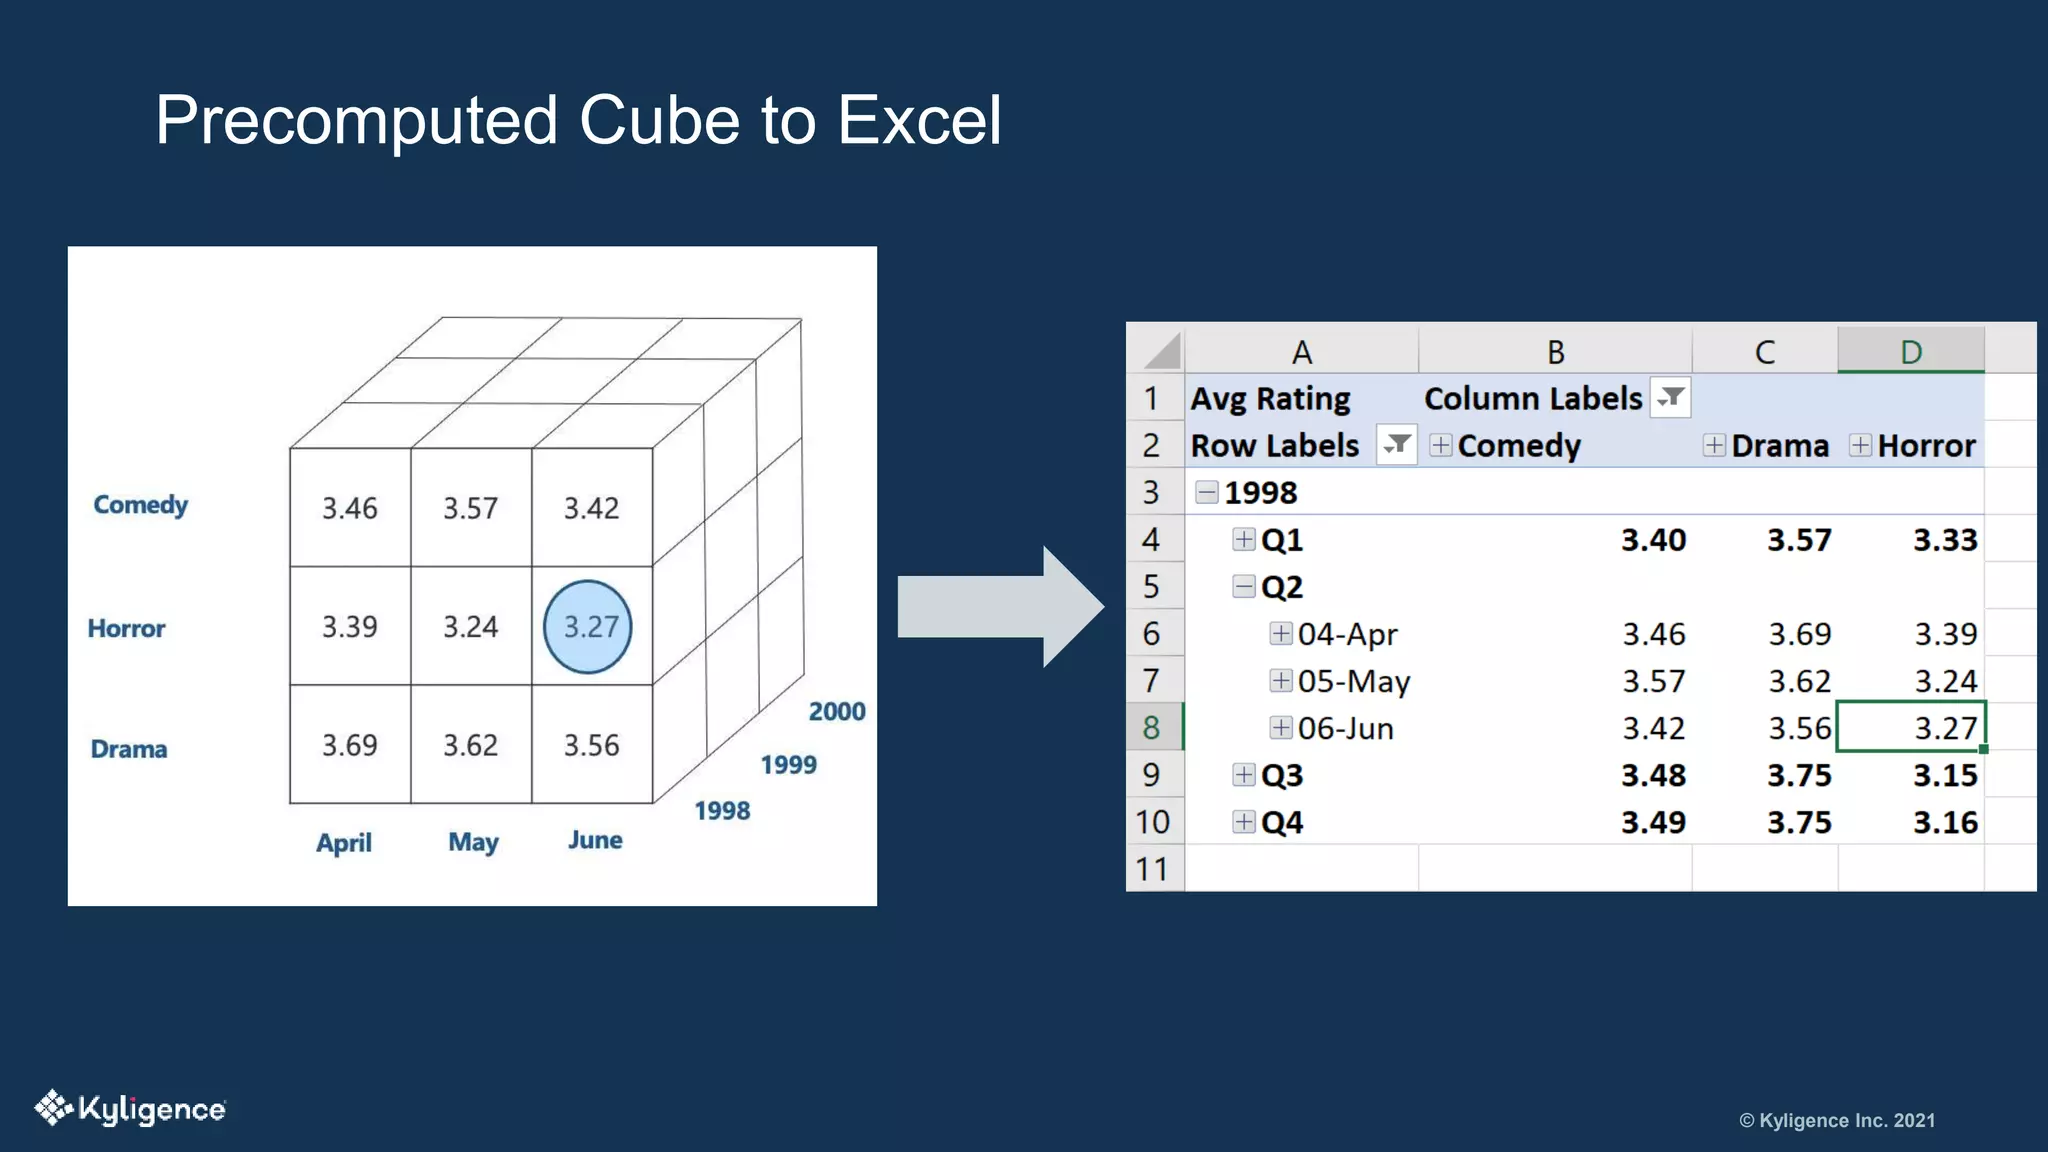
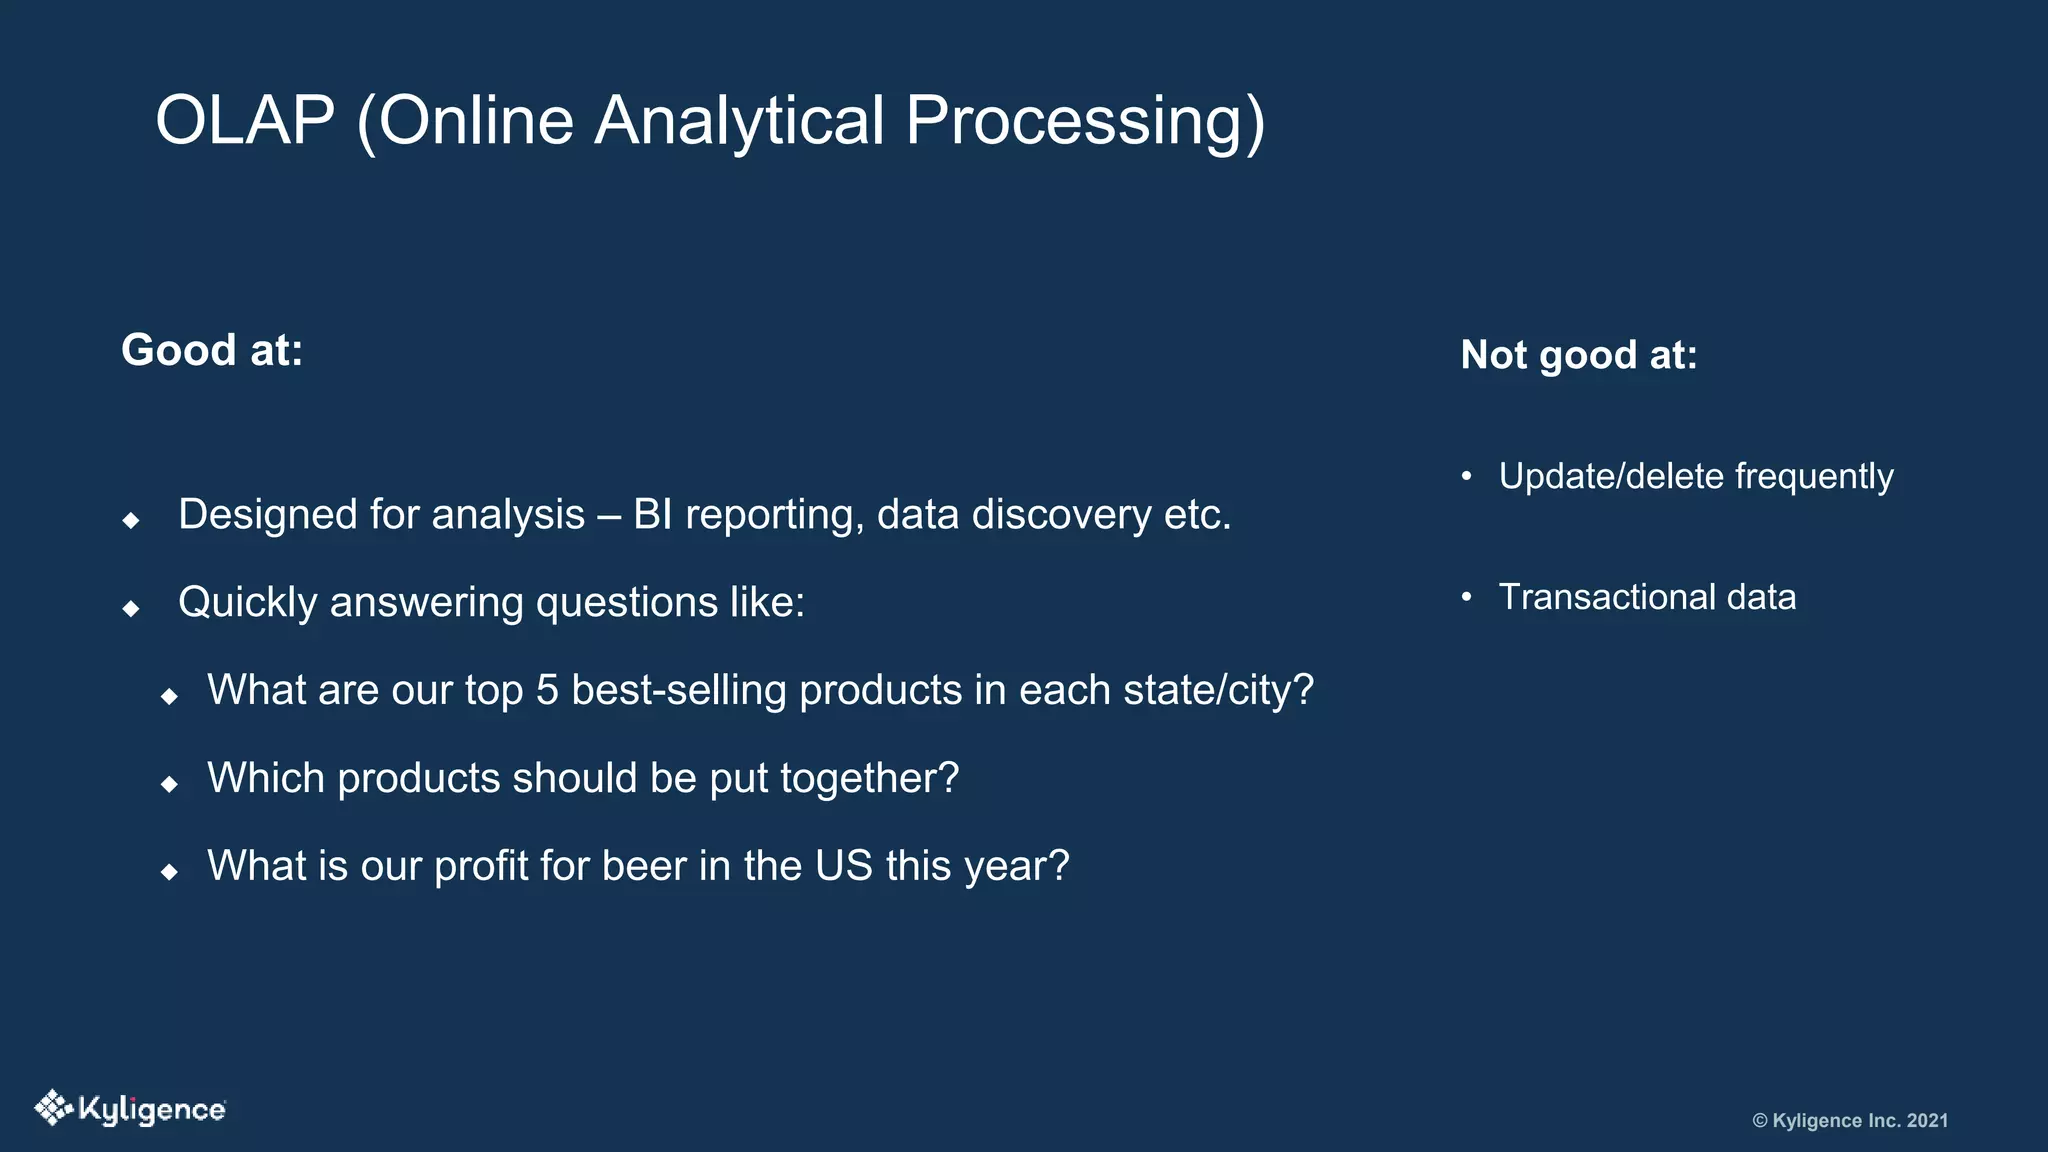
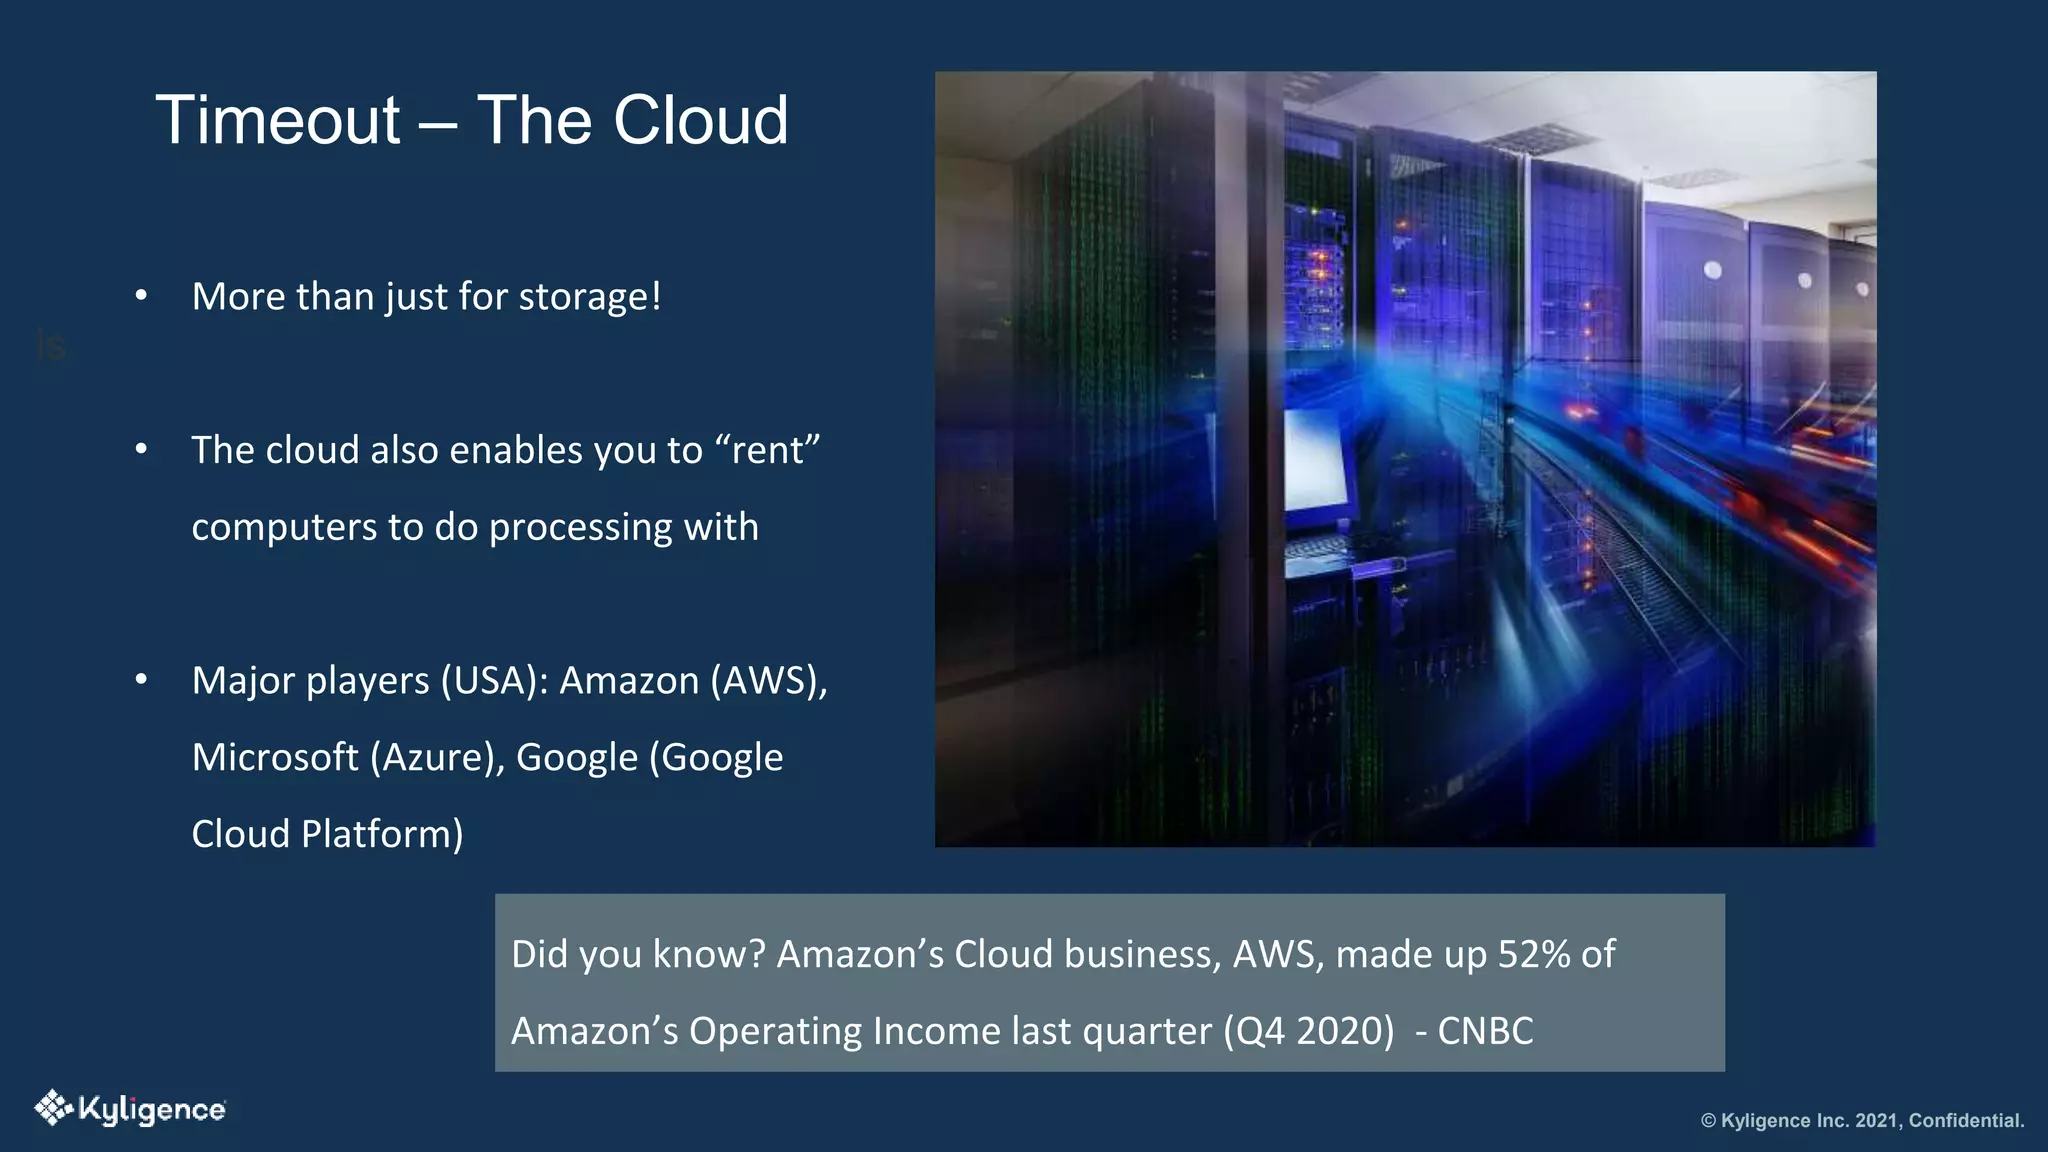
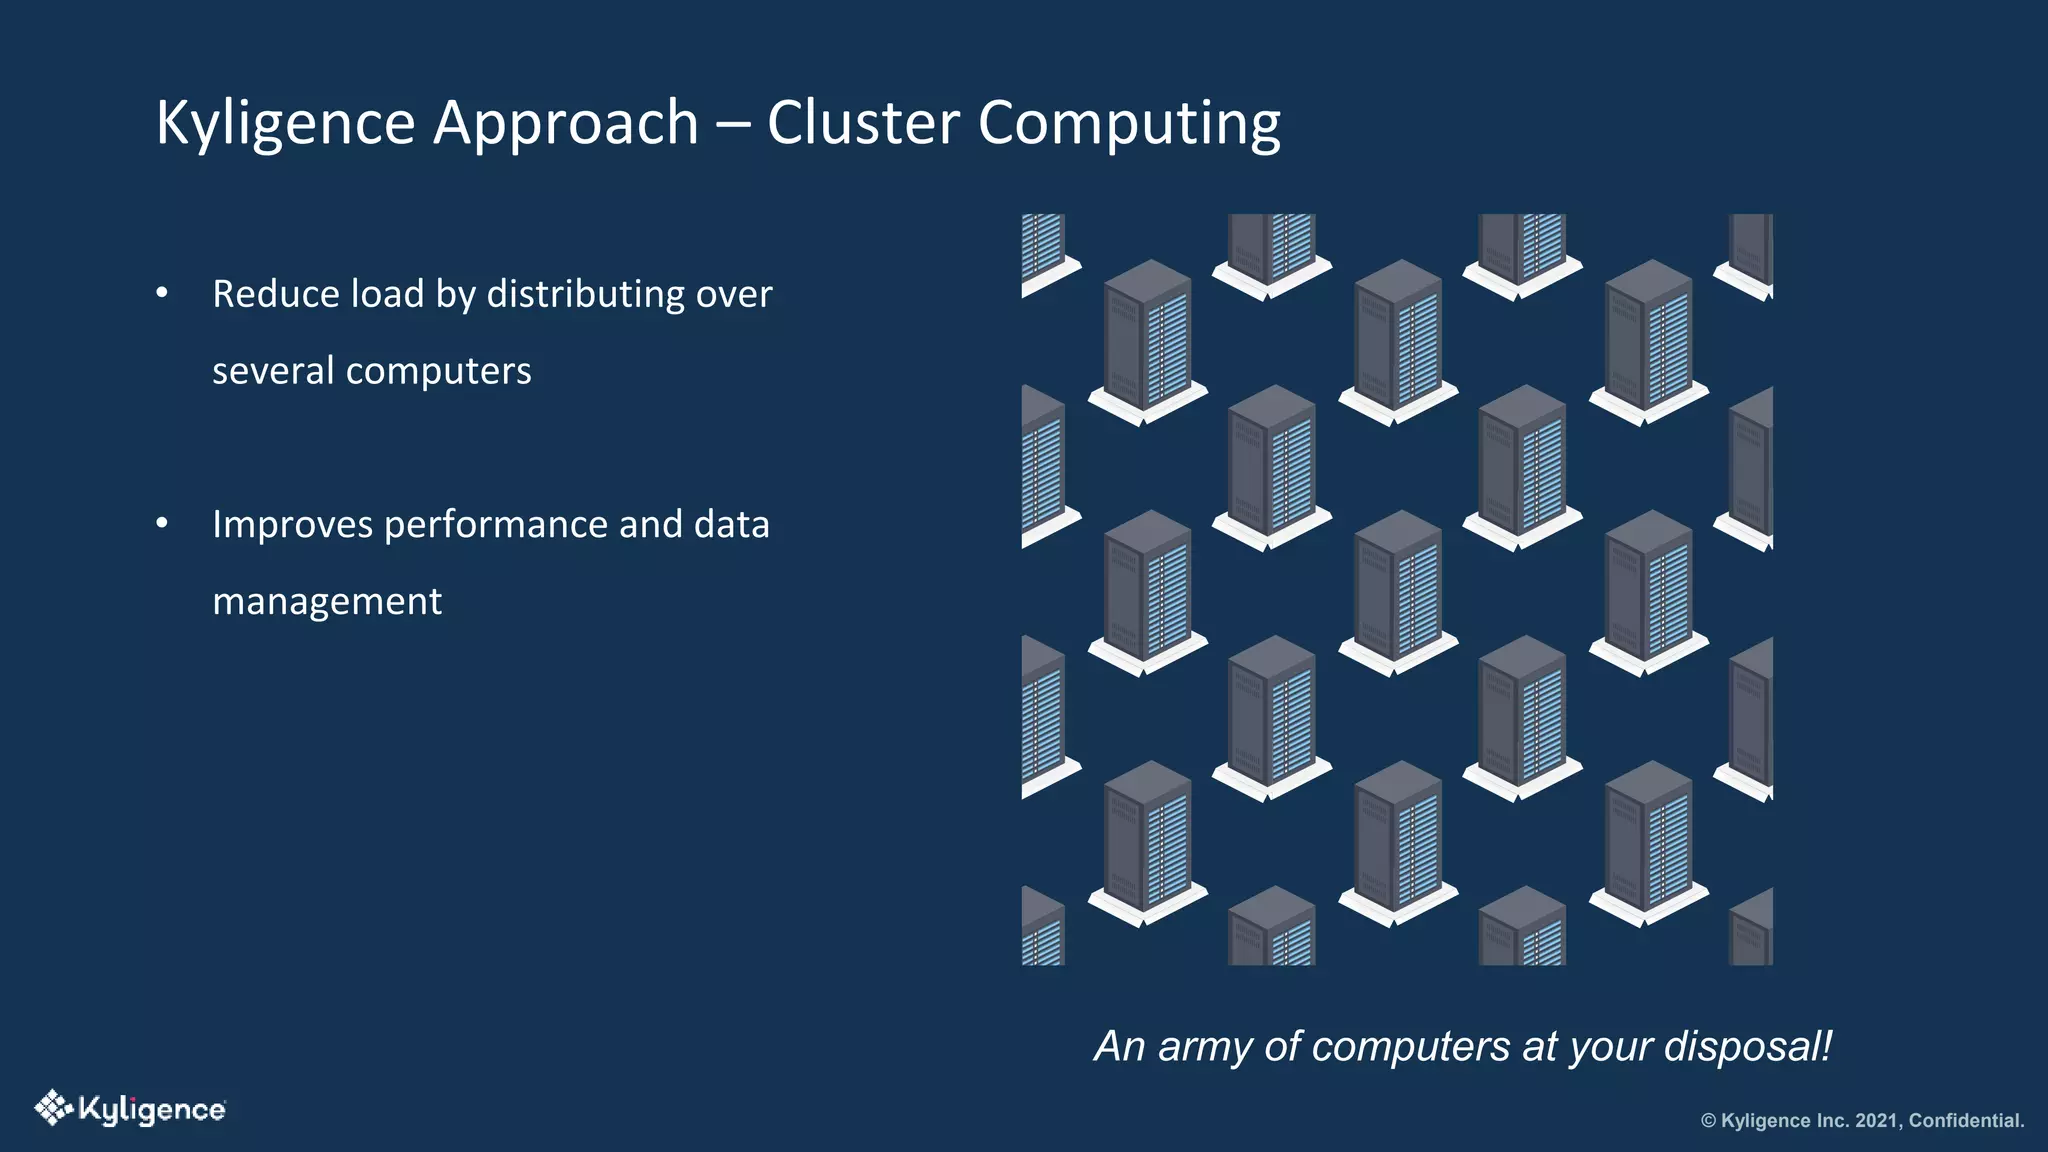
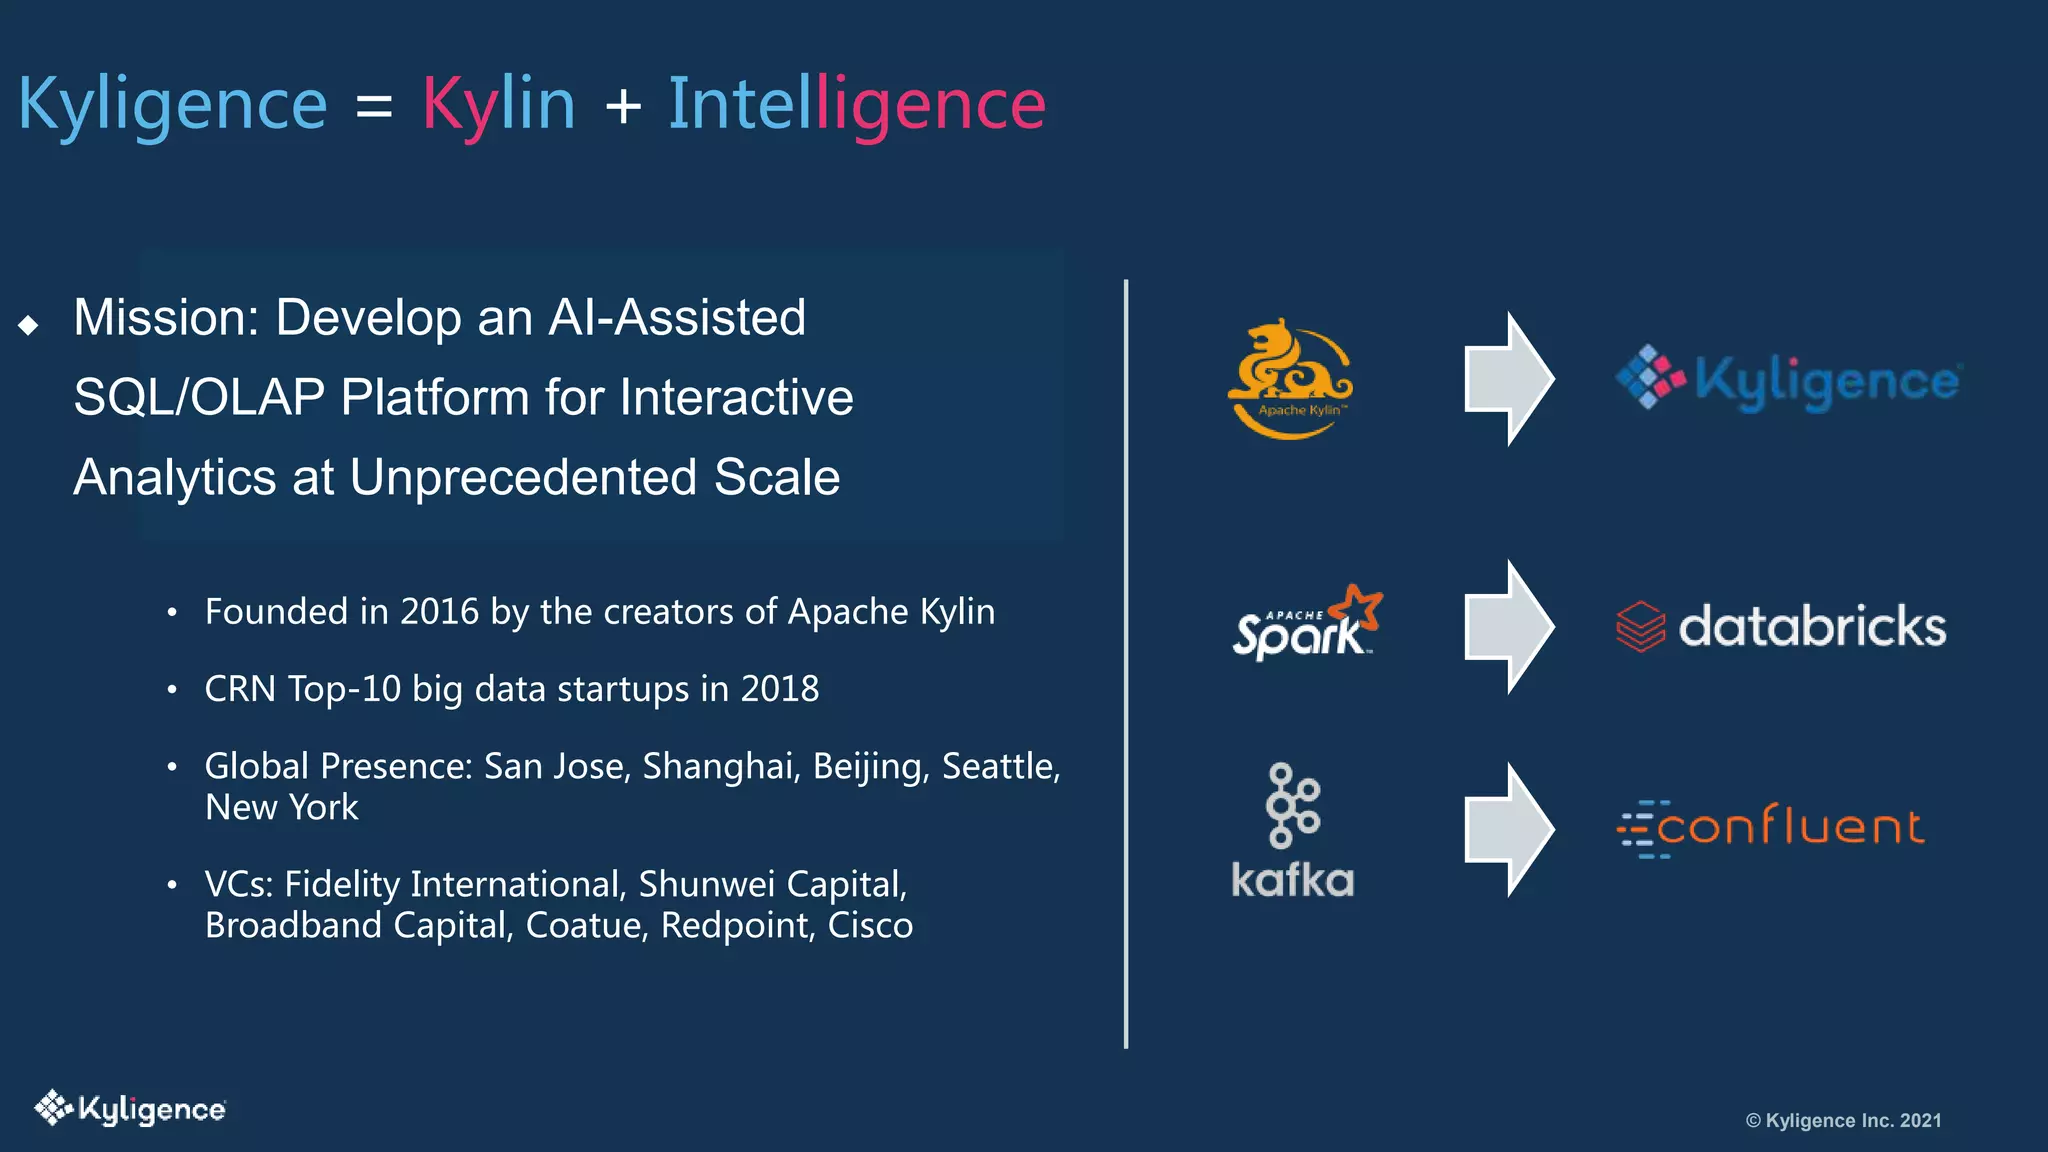
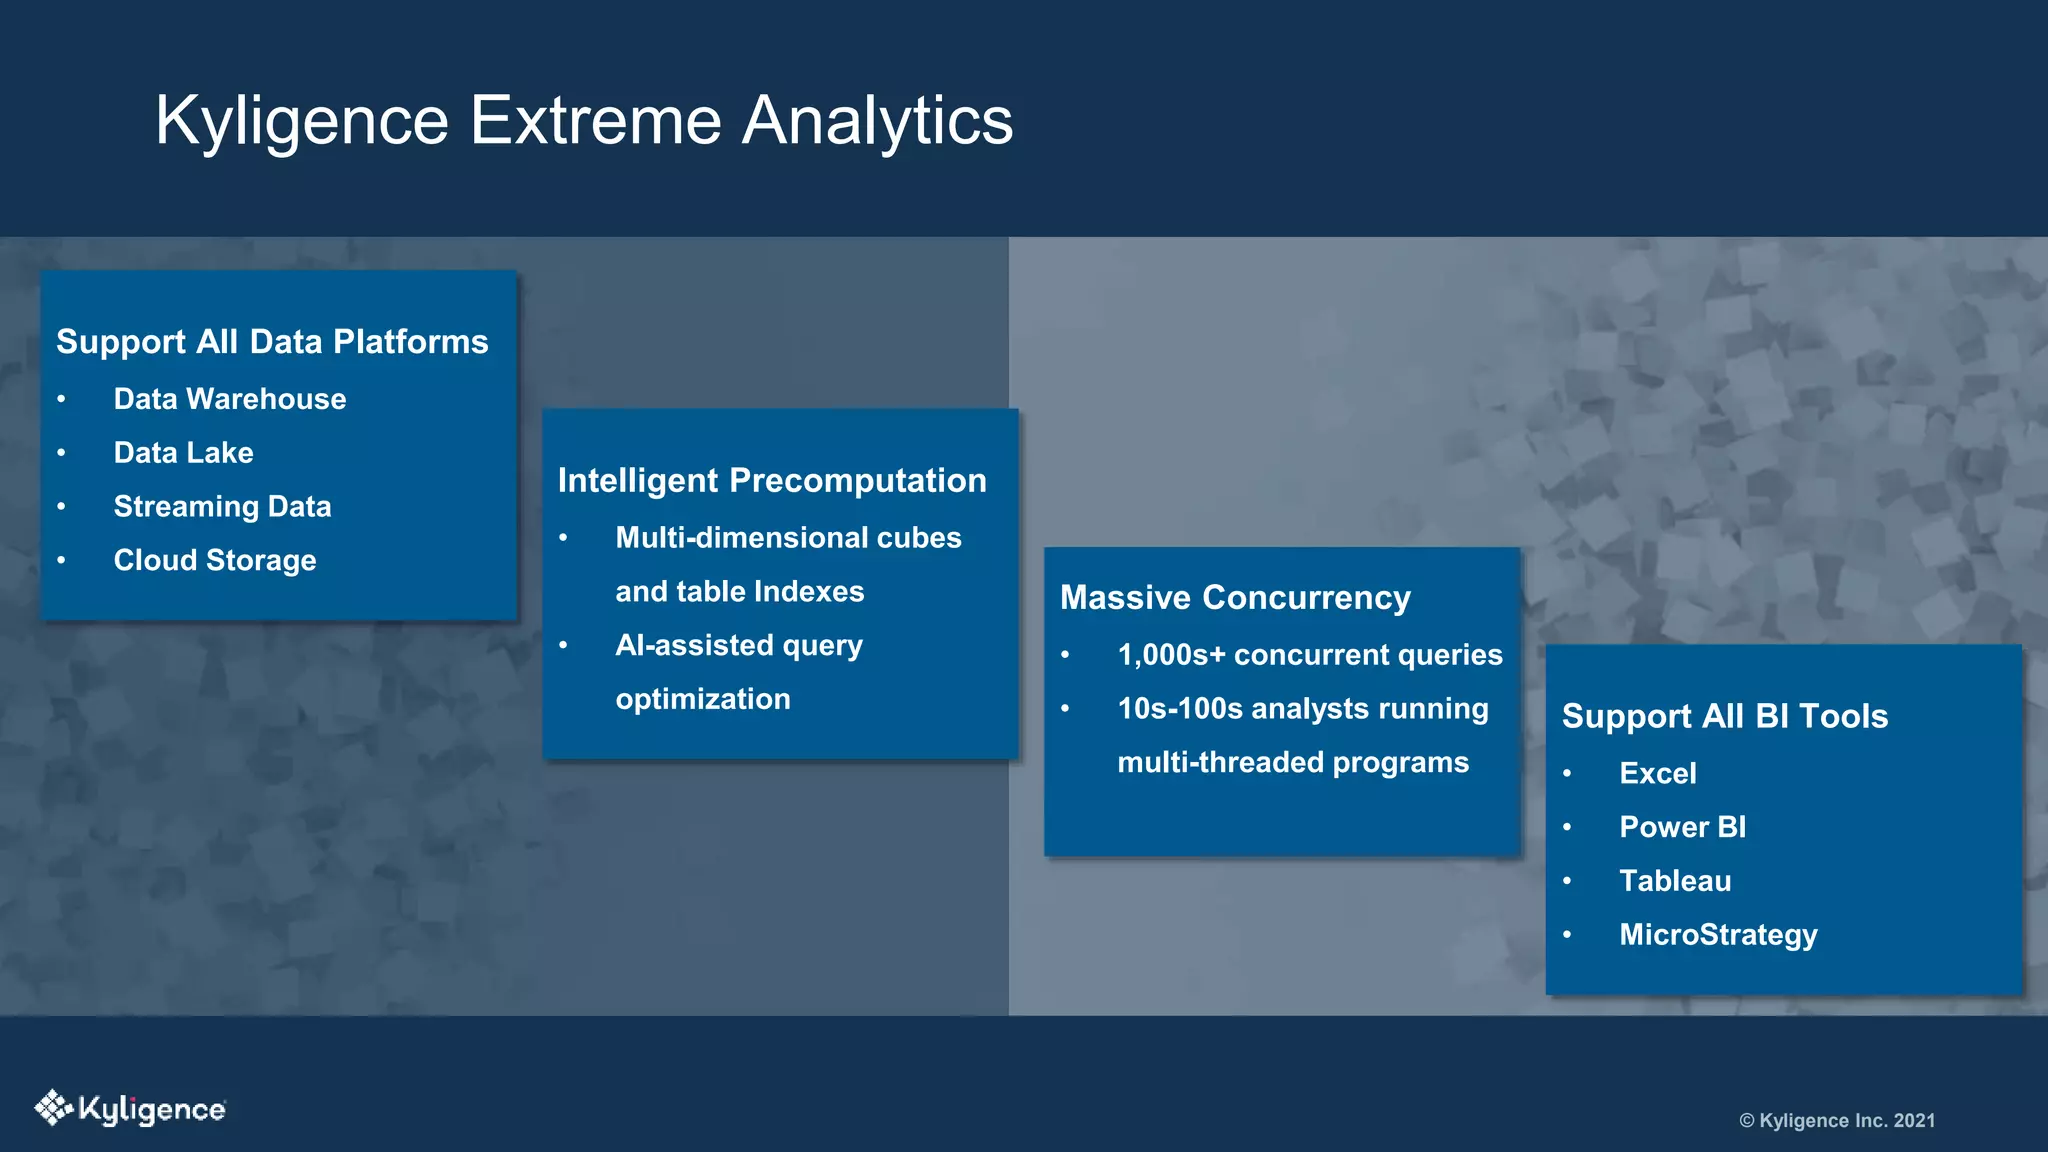
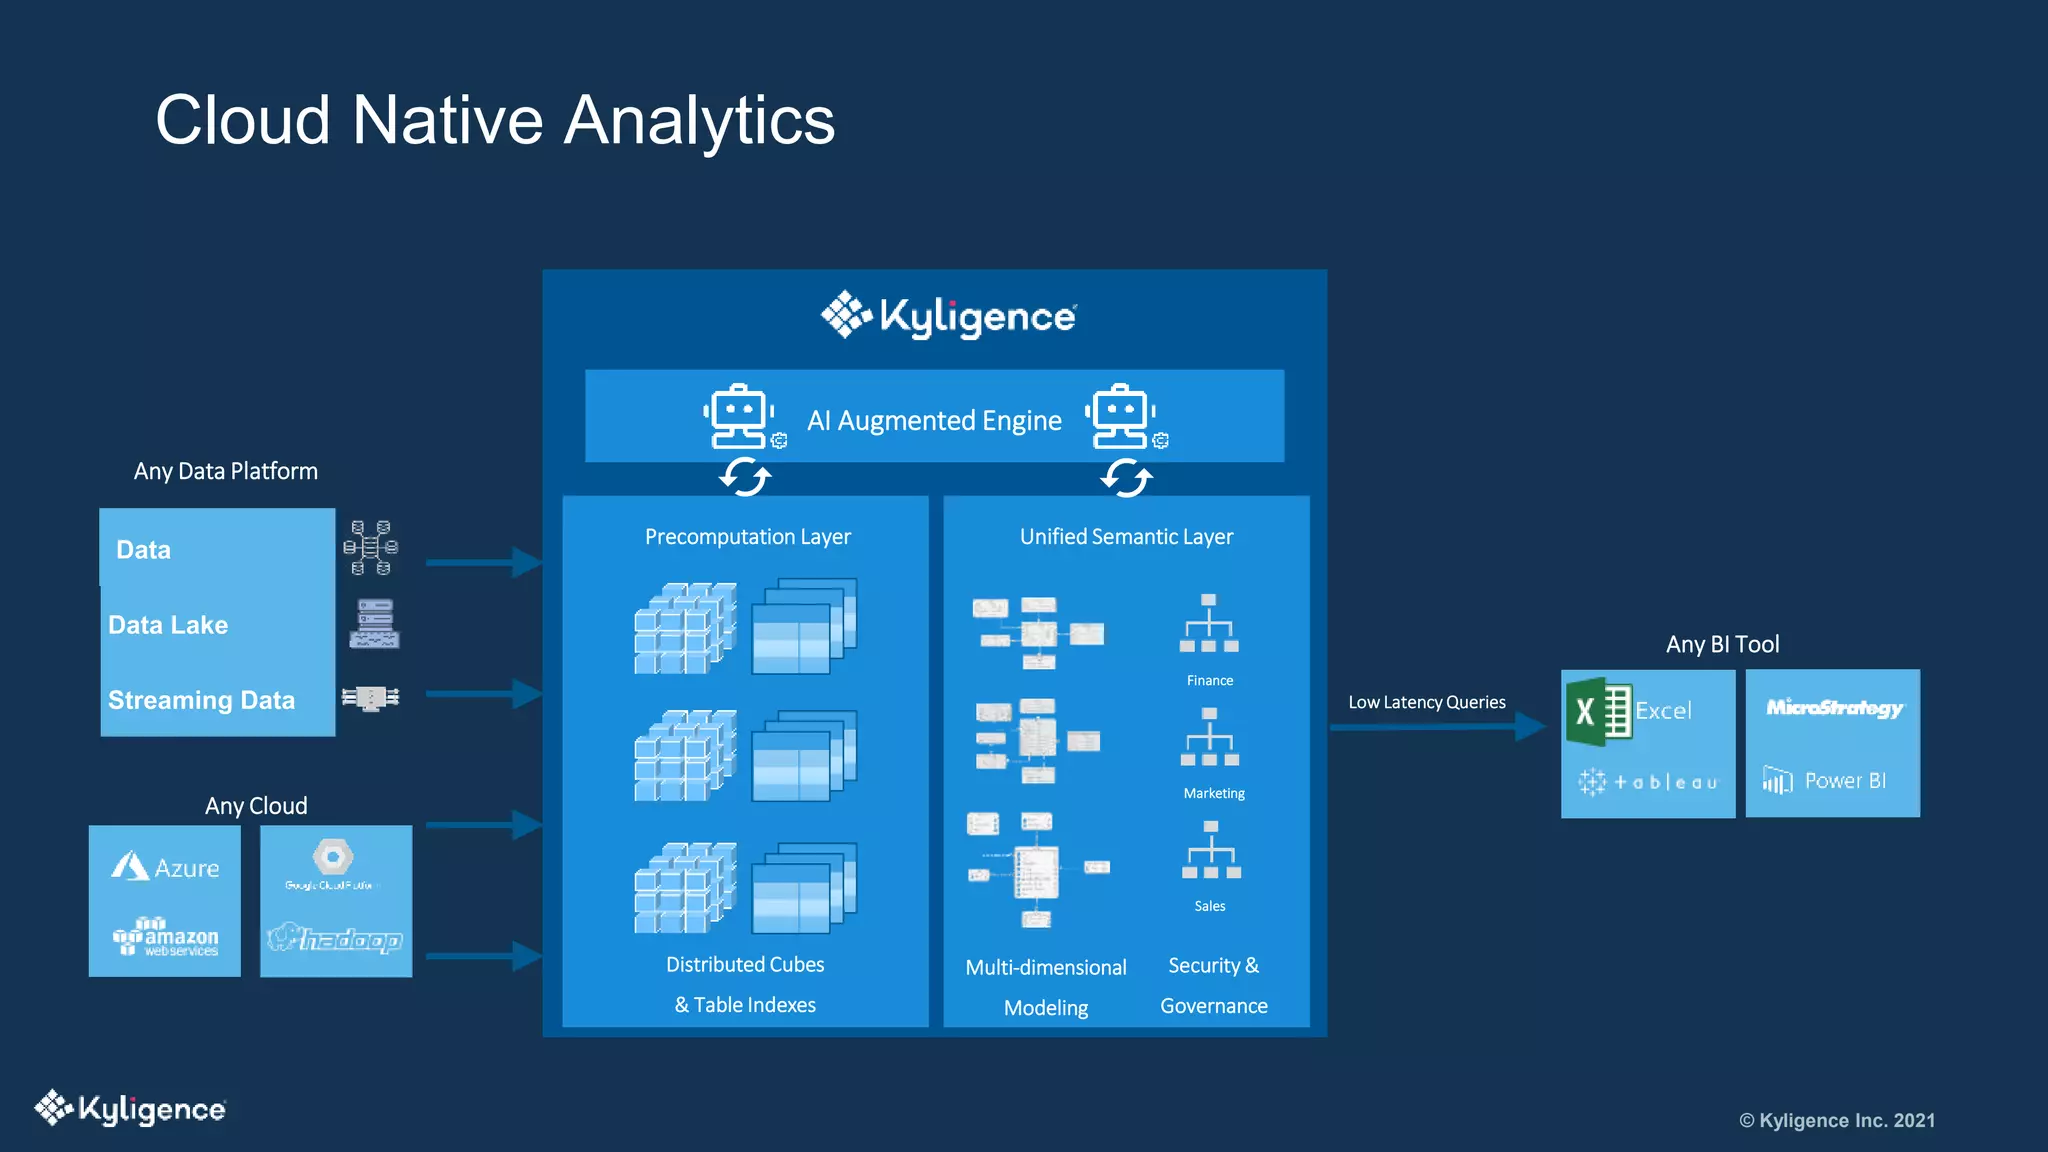
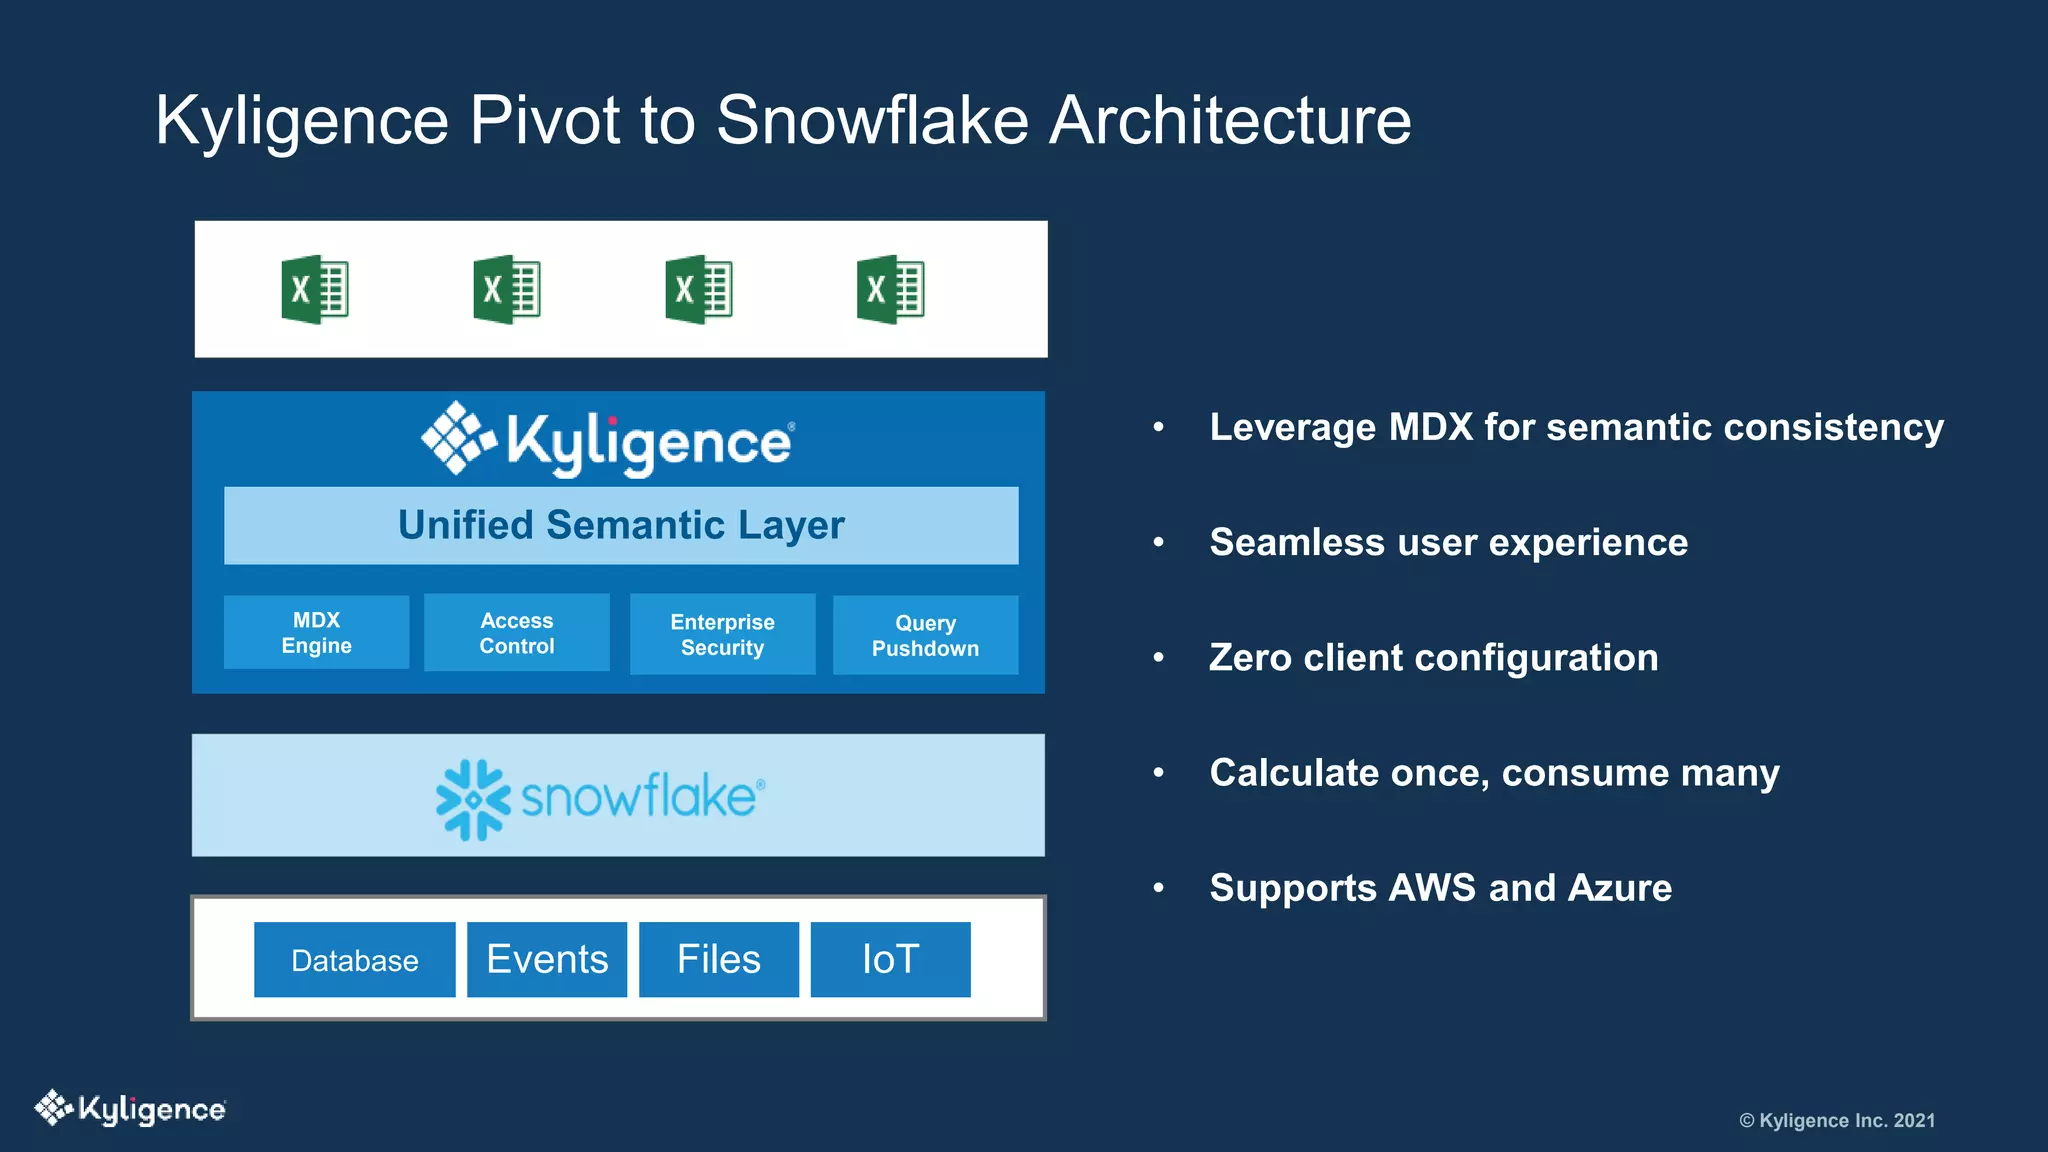
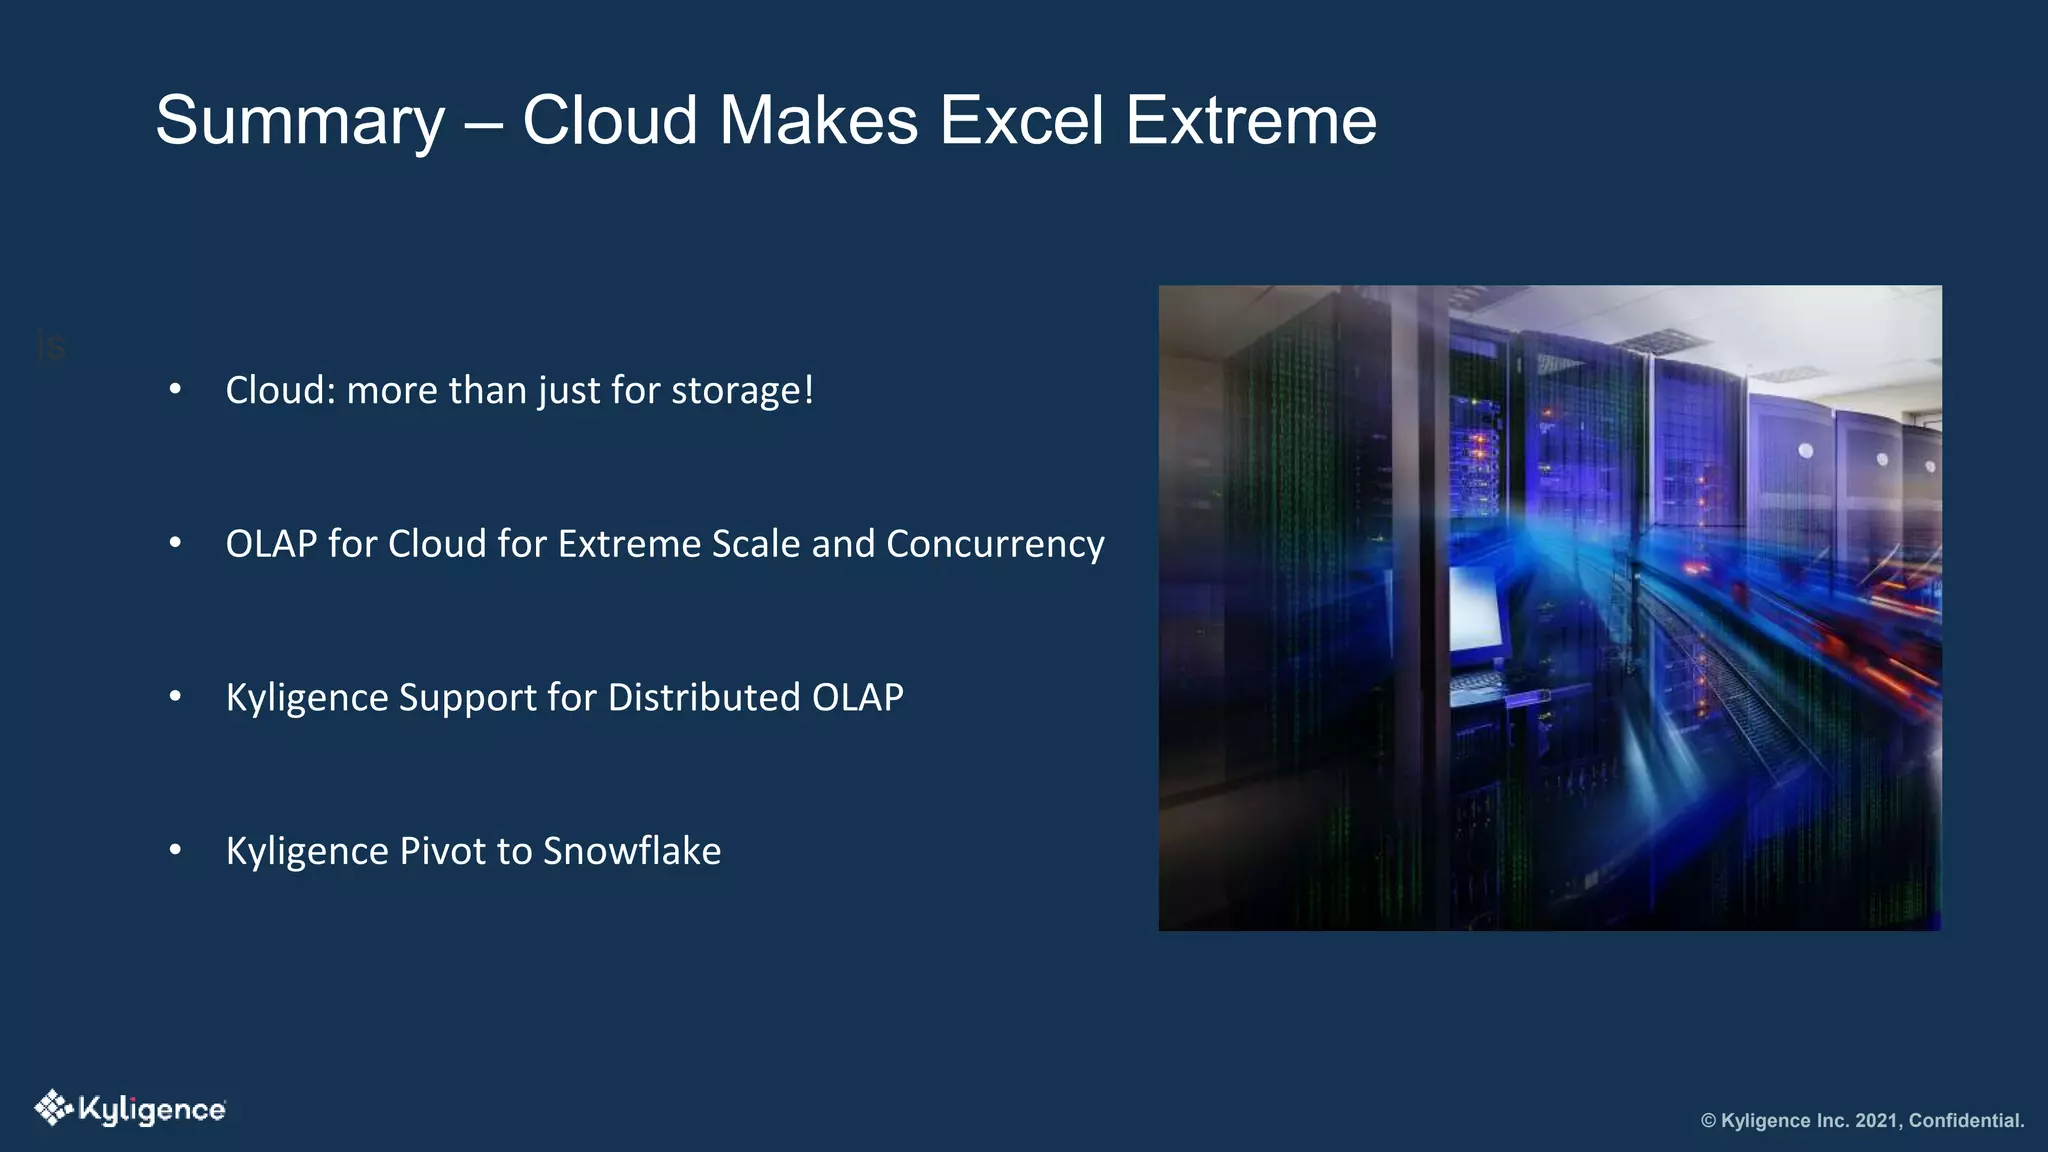
People have been using Excel for 35 years. There are over 750 million Excel users. People are making magic with Excel every day. With the surging interest in big data, advanced analytics, and the cloud, how does Excel stay relevant and how extreme can Excel get? In this presentation, we will examine:
o Traditional limits of Excel performance, scale, dataset sizes
o Cloud technologies that make Excel better
o Defining the new extremes for Excel power users
Speaker Bio:
Rachel Beddor is a Solutions Engineer for Kyligence where she creates technical content to enhance the learning experience for new Apache Kylin and Kyligence users. She has dedicated her career to making technology more accessible, fun, and inviting to people of all backgrounds.
Open Source Technologies in the Analytics RevolutionSamanthaBerlant
One of the hallmarks of modern analytics is that data pipelines are largely built upon open source software (OSS). It is entirely possible to create cutting edge data science, machine learning, data engineering, ETL processing, and predictive analytics pipelines without using any commercial software. Of course, OSS does not necessarily mean “free,” but as a thought experiment, the first part of this session will explore the role of OSS in your data analytics stacks and data pipelines.
For the second half of this presentation, we will examine how OSS tools and platforms can be used to learn and create your own Machine Learning and Data Analytics projects without breaking the bank.
View the presentation: https://youtu.be/JbNuikWKC1Q
Precomputation or Data Virtualization, which one is right for you?SamanthaBerlant
In the world of cloud analytics, what role do precomputation and distributed OLAP play compared with a data virtualization approach? Which should you choose? Do they compete or complement each other? This webinar will address these questions and provide some guidance for how to choose the right approach for your circumstances.
Both technologies are trying to address a similar challenge: make analytics easily accessible to a wider audience in a modern big data environment. Precomputation focuses on performance, response time, and concurrency in the production environment. Data Virtualization technologies focus on making analysis easily available to users by reducing or eliminating ETL and data warehouses.
In this presentation we will cover:
-The key differences between precomputation and data virtualization
-How your choice between the two affects data quality, security, governance, and TCO
-The financial impact each of these technologies have on your analytics program
If you have big data, more and more of your analytics stack needs to be intelligent. Your tools need to be able to anticipate the needs of your analysts, customers, and your business. With the AI-Augmented Engine, this learning process is automated and predictive. It intelligently adapts to user behavior and query patterns and learns to anticipate each users’ needs. Join us for the third installment of this series diving into the core features of Kyligence Cloud 4.
In this presentation you will learn:
-How the Kyligence Cloud 4 AI-Augmented Engine works
-How the AI-Augmented Engine gives optimal efficiency for cube building
-How the AI-Augmented Engine greatly simplifies data modeling
Watch the webinar here: https://www.brighttalk.com/webcast/18317/480320
Watch Andy's presentation on-demand from Fast Data Strategy summit here: https://goo.gl/yD66yq
Andy Kemp is the Senior Sales Consultant at Tableau Software and one of the keynote speakers at Fast Data Strategy Virtual Summit 2018. In his presentation entitled "Visualisation meets Virtualisation", he will discuss how the combined power of the Tableau Analytical Platform and Denodo Platform 7.0 will help allow self-service business intelligence throughout the entire organization.
Attend this session to discover:
• How to build the culture of Agile BI in your organization
• How to enable a more agile and flexible virtual enterprise data warehouse.
• Why a common semantic layer is crucial
This webinar will go over various Big Data ideas and insights. It will also answer the question, What Does “Big Data” Really Mean? Amazon RedShift will also speak and there will be a Demonstration from Informatica Cloud. We will end with a few TechTuesdays Tips for Success.
Delivering data and analytics to your customers should be straightforward. The Looker Data Platform allows for easy access to data through a robust API and embeddable charts, tables and dashboards.
Learn how Looker can help you:
- Embed charts, tables and dashboards into applications
- Use the Looker API to deliver data to applications, including Slack
- Build a customer portal to deliver more value to your customers
- Design the above with version control through Git, along with clustering and multi-server setup as needed
Lightning-Fast, Interactive Business Intelligence Performance with MicroStrat...Tyler Wishnoff
See how extreme query speeds and ultra-high concurrency on MicroStrategy, and any other business intelligence (BI) tool, on Big Data is possible through the Kyligence platform. Learn more here: https://kyligence.io/
Top challenges before you can do something with dataColin McGrew
What you want to do with data is fairly simple; bringing data together and connecting it to your desired consumption points isn't. What are the top challenges?
Rethinking CAPEX and OPEX in a cloud-centric world? Information technology is undergoing a seismic shift towards the cloud, a disruption we believe is as game-changing as the transition from mainframes to client/server. This shift will impact every player in the IT world, from service providers and system architects, to developers and end users. We are excited about this transformation and the vast improvements in efficiency, agility and innovation it will bring. Join us for this on-demand webcast and learn how to calculate Total Cost of Ownership by transitioning to Microsoft Azure for your company
Vehicle Big Data that Drives Smart City Advancement by Mike Branch at Big Dat...Big Data Spain
Geotab is a leader in the expanding world of Internet of Things (IoT) and telematics industry with Big Data.
https://www.bigdataspain.org/2017/talk/vehicle-big-data-that-drives-smart-city-advancement
Big Data Spain 2017
November 16th - 17th Kinépolis Madrid
leveraging the power of the Cloud for building sustainable GIS solutions. you can easily adding the location advantage to your business workflows with different Cloud GIS offerings.
My presentation at Software Architect Indonesia Community (SARCCOM) Tech Talk hosted by Bank Central Asia on October 11th, 2017. Topic is about big data at Bukalapak, one of the largest e-marketplace in Southeast Asia.
Producing direct value for businesses via quantitative models.
New analytical tools such as Looker allow data analysts to speed up the dirty work around building data models—making it less painful to clean data, explore predictive factors, and evaluate results.
In this educational webinar from Data Science Central (DSC), Justin Palmer of LendingHome, a mortgage banking and marketing platform, joins Colin Zima, Chief Analytics Officer at Looker. Using a public-domain FAA dataset and the LendingHome platform as examples, they dig into the data modeling process and offer ideas for improvements.
- See more at: http://try.looker.com/resources/improving-data-modeling-workflow#sthash.2rGxwhJ7.dpuf
Notebooks @ Netflix: From analytics to engineering with Jupyter notebooksMichelle Ufford
Slides from JupyterCon 2018 in NYC on 8/23/2018.
Notebooks have moved beyond a niche solution at Netflix; they are now the critical path for how everyone runs jobs against the company’s data platform. From creating original content to delivering bufferless streaming, Netflix relies on notebooks to inform decisions and fuel experiments across the company. Netflix also uses notebooks to power its machine learning infrastructure and run over 150,000 jobs against its 100 PB cloud-based data warehouse every day. The goal is to deliver a compelling notebooks experience that simplifies end-to-end workflows for every type of user. To enable this, Netflix is investing deeply in notebook infrastructure and open source projects such as nteract.
In this talk, Michelle Ufford and Kyle Kelley share interesting ways Netflix uses data and some of the big bets the company is making on notebooks. Topics will include architecture, kernels, UIs, and Netflix’s open source collaborations with projects such as Jupyter, nteract, pandas, and Spark.
CloudCamp Chicago lightning talk "Big Data without Big Infrastructure" by ...CloudCamp Chicago
Lightning talk slides from the May 2015 CloudCamp "unconference" focused on "Big Data and Cloud"
"Big Data without Big Infrastructure" - Dan Chuparkoff, VP of Product at Civis Analytics @Chuparkoff
About CloudCamp: the event features short lightning talks, an "unpanel" with audience participation and questions, and small breakout clusters around beers and pizza. Hosted by Cohesive Networks at TechNexus.
Most organizations using Microsoft Dynamics NAV do not follow a regular upgrade pattern but most likely will upgrade at some point. This Powerpoint includes 5 things to consider when upgrading your NAV.
With an explosion of data, today’s emerging needs are not being met by existing technologies, which require rich skill sets and expertise. Companies that want to lead changes in highly competitive markets must optimize their storage, speed, and spending. The key is for them to augment their data management and analytics platforms with artificial intelligence and machine learning for analysts, engineers, and other users.
Why Should I Care About DVD? Blu-Ray is the New Thing, Right?Joseph Alaimo Jr
You like Tableau and PowerBI, but you've been hearing about this thing called DVD. No, not the disc. We're talking about Data Visualization Desktop, Oracle's data visualization tool, which is part of the Oracle Analytics Cloud (OAC) suite. This presentation takes a quick look at OAC's suite of tools. It explores how Oracle Data Visualization stacks up against its main competitors, including a grudge match style live demo, during which you will get to take part in rating each tool! It focuses on the most important and interesting features so that you will be able to make your own assessment.
This webinar covers Looker 4, including:
- New LookML with a refreshed syntax and full-featured Integrated Development Environment that offers contextual help as you work.
- Content Discovery, which makes it easier to curate, find, and share data across your entire company.
- New Exploration tools, like the ability to fill in missing dimension values when graphing data.
- The Strengthened Platform, with our versioned, stable API and the ability to trigger actions in other tools directly from Looker.
Data Science for non techies using KNIME 08 Weeks TrainingAli Raza Anjum
An Extensive 08 Weeks Training for Zero Code Data Science i.e. how anyone from non CS Back Ground can implement Data Science Models
For Registration of Training:
https://diceanalytics.pk/school/courses-and-workshops/ds-for-non-techies/
ML-Based Data-Driven Software Development with InfluxDB 2.0InfluxData
His Eureka moment: Software development or any human activity flows with time. He started mapping software development at Fujitsu with time series and created an IOT of Software Development. The POC was well-received and obtained funding to be taken to production as a strategic information system. Earlier, developing a similar system for business required huge budget and efforts, whereas with InfluxDB and its ecosystem, the Quality Cost & Delivery was unbelievable. The Flux addition with 2.0 helped Fujitsu with the power of computing, in addition to queries. They build mean, median, Mode, Quantiles with Flux queries and use other built-in functions. The talk will share the Templates, Flux queries, Scraper code to open source community, all of which will be in GitHub where anyone can reference them.
Architecting Snowflake for High Concurrency and High PerformanceSamanthaBerlant
Cloud Data Warehousing juggernaut Snowflake has raced out ahead of the pack to deliver a data management platform from which a wealth of new analytics can be run. Using Snowflake as a traditional data warehouse has some obvious cost advantages over a hardware solution. But the real value of Snowflake as a data platform lies in its ability to support a high-concurrency analytics platform using Kyligence Cloud, powered by Apache Kylin.
In this presentation, Senior Solutions Architect Robert Hardaway will describe a modern data service architecture using precomputation and distributed indexes to provide interactive analytics to hundreds or even thousands of users running against very large Snowflake datasets (TBs to PBs).
Addressing the systemic shortcomings of cloud analyticsSamanthaBerlant
Learn how existing open source technologies like Apache Kylin, Spark, and Mondrian can be used to increase the value of your analytics investment.
As we enter what some have called The Golden Age of Analytics, there are still some fundamental challenges that plague even the largest and most sophisticated cloud analytics adopters. Chief among these is the challenge of scale, often reflected in limitations of concurrency, multi-tenancy, distributed query performance, and all manner of latencies.
Other less obvious, but equally crucial, challenges of scale and performance have to do with IT and end-user productivity. In other words, there have been few technological advances that enable the quick deployment of big data analytics and the rapid creation of business value from the data being analyzed.
This presentation will consider a few of these systemic challenges and suggest some ways that they can be addressed with available open source technology such as Apache Kylin, Apache Spark, and Apache Mondrian.
Presenter:
Kaige Liu is a Senior Solutions Architect at Kyligence, where he works on building the next-generation big data analytics platform. Previously, he worked on the OpenStack and Bluemix team at IBM, focusing on cloud computing and virtualization technology. Kaige loves the open source community and is an active Apache Kylin committer.
Smashing Through Big Data Barriers with Tableau and SnowflakeSamanthaBerlant
Your analysts are working with more data than ever before in Tableau. Chances are, as the data volumes grow, your teams are experiencing some slowdowns. While it may be tempting to blame Tableau, the most likely explanation for performance and scalability pains lies in your data service layer. What if you could transform the way you do analytics without having to retrain your Tableau users? What if you could get more critical business value out of Tableau, and your data, without disrupting the way your business operates?
Join us for this session to learn how Tableau could be the ultimate window into ALL of your valuable data, no matter how large. Learn how precomputation technology and AI-augmented query optimization can help you break free of the downward performance spiral of legacy analytics approaches.
In this presentation, you will learn:
-How to get the fastest big data analytics experience on Tableau
-How a unified semantic layer can ensure that your current Tableau users are not disrupted by big data
-How to improve your analytics operations with automation and machine intelligence
Watch the webinar to see this technology in action during the live Snowflake demo. Enter the onramp to unmatched performance with big data analytics on Tableau.
Providing Interactive Analytics on Excel with Billions of RowsTyler Wishnoff
See how to get lightning-fast query performance on Microsoft Excel that scales into the petabytes. This presentation shares the top challenges Excel faces with big data and outlines strategies to keep Excel running smoothly. Learn more at: https://kyligence.io/solution/big-data-analytics-in-excel/
In January of this year, Kyligence announced the immediate availability of Kyligence Cloud 4, the first fully cloud-native, distributed OLAP platform. During our announcement, EMA analyst John Santaferraro said:
“As the race for unified analytics heats up, Kyligence offers a solution that overcomes the challenges of querying data in both data lakes and data warehouses located both in the cloud and on premises.”
Join Li Kang - VP of North America at Kyligence - as he provides an overview of the Kyligence Cloud 4 release that will show:
--The new cloud native architecture that employs Apache Kylin, Apache Spark, and Apache Parquet to ensure optimal performance.
--How KC4 delivers sub-second query responses on very large datasets using precomputed aggregate indexes (hyper-cubes) and table indexes.
--The AI-Augmented engine that intelligently organizes your data and reduces data modeling time from days/weeks to minutes.
In this presentation, we will present the Kyligence Cloud 4 story - high-speed analytics with unprecedented sub-second query response times against petabyte datasets.
Integrating and fully utilizing data is a critical prerequisite for ensuring the success of data-driven operations and decision making. This is especially true as more and more corporations begin transforming legacy data warehouses and transitioning to the Cloud. See how Augmented OLAP technology is leading the way in streamlining Big Data analytics on the Cloud with this presentation by Kyligence CEO Luke Han at Big Things Conference 2019. Learn more here: https://kyligence.io
Cloud-native Semantic Layer on Data LakeDatabricks
With larger volume and more real-time data stored in data lake, it becomes more complex to manage these data and serve analytics and applications. With different service interfaces, data caliber, performance bias on different scenarios, the business users begin to suffer low confidence on quality and efficiency to get insight from data.
Wikibon is a different type of analyst firm that uses digital technology to conduct and share research on digital business and IT. Presented by Peter Burris and Dave Vellante, here are our 2017 predictions.
Building Enterprise OLAP on Hadoop for FSILuke Han
Building Enterprise OLAP on Hadoop for Finance Services Industry, and following a use case of CPIC (fortune 500 insurance company) about how to replace legacy IBM Cognos OLAP with Kyligence platform
Take the Bias out of Big Data Insights With Augmented AnalyticsTyler Wishnoff
Is bias impacting your Big Data insights? Learn how augmented analytics and the latest advancements in OLAP technology are making analytics (including on cloud) from business intelligence, data science, and machine learning more accurate and impactful. Learn more at https://kyligence.io
Snowflake: The Good, the Bad, and the UglyTyler Wishnoff
Learn how to solve the top 3 challenges Snowflake customers face, and what you can do to ensure high-performance, intelligent analytics at any scale. Ideal for those currently using Snowflake and those considering it. Learn more at: https://kyligence.io/
ADV Slides: 2021 Trends in Enterprise AnalyticsDATAVERSITY
It is a fascinating, explosive time for enterprise analytics.
It is from the position of analytics leadership that the mission will be executed, and company leadership will emerge. The data professional is absolutely sitting on the performance of the company in this information economy and has an obligation to demonstrate the possibilities and originate the architecture, data, and projects that will deliver analytics. After all, no matter what business you’re in, you’re in the business of analytics.
The coming years will be full of big changes in enterprise analytics and Data Architecture. William will kick off the third year of the Advanced Analytics series with a discussion of the trends winning organizations should build into their plans, expectations, vision, and awareness now.
Webinar: Understanding Cortana Intelligence Suite & Power BI DemoEmtec Inc.
Learn how to stay up-to-date with your most crucial business metrics using Power BI!
Slides will cover the following:
Cortana Intelligence Suite Update
Pains and Needs in the Marketplace- BI/Analytics Expert, Jamal Syed
Why Microsoft BI & Analytics & how it can help you now
Learn how the Microsoft Cortana Intelligence Suite can transform your organization & see how to stay up-to-date with your most crucial business metrics using Power BI!
Pains and Needs in the Marketplace- BI/Analytics Expert, Jamal Syed
Why Microsoft BI & Analytics? How it can help you now.
Innovating to Create a Brighter Future for AI, HPC, and Big Datainside-BigData.com
In this deck from the DDN User Group at ISC 2019, Alex Bouzari from DDN presents: Innovating to Create a Brighter Future for AI, HPC, and Big Data.
"In this rapidly changing landscape of HPC, DDN brings fresh innovation with the stability and support experience you need. Stay in front of your challenges with the most reliable long term partner in data at scale."
Watch the video: https://wp.me/p3RLHQ-kxm
Learn more: http://ddn.com
Sign up for our insideHPC Newsletter: http://insidehpc.com/newsletter
Hassle-Free Data Lake Governance: Automating Your Analytics with a Semantic L...Tyler Wishnoff
Simplify data lake governance, no matter how much data you work with and how many data sources and BI tools you manage. This presentation offers all you need to develop your own strategy for smarter data lake governance. Learn more at: https://kyligence.io/
Enhance Data Governance with Kyligence Unified Semantic LayerSamanthaBerlant
Simplify data lake governance, no matter how much data you work with and how many data sources and BI tools you manage. This presentation offers all you need to develop your own strategy for smarter data lake governance.
https://www.brighttalk.com/webcast/18317/414017
Similar to Extreme Excel: How a 35-Year-Old Desktop App Smashed Through the Big Data Barrier (20)
Levelwise PageRank with Loop-Based Dead End Handling Strategy : SHORT REPORT ...Subhajit Sahu
Abstract — Levelwise PageRank is an alternative method of PageRank computation which decomposes the input graph into a directed acyclic block-graph of strongly connected components, and processes them in topological order, one level at a time. This enables calculation for ranks in a distributed fashion without per-iteration communication, unlike the standard method where all vertices are processed in each iteration. It however comes with a precondition of the absence of dead ends in the input graph. Here, the native non-distributed performance of Levelwise PageRank was compared against Monolithic PageRank on a CPU as well as a GPU. To ensure a fair comparison, Monolithic PageRank was also performed on a graph where vertices were split by components. Results indicate that Levelwise PageRank is about as fast as Monolithic PageRank on the CPU, but quite a bit slower on the GPU. Slowdown on the GPU is likely caused by a large submission of small workloads, and expected to be non-issue when the computation is performed on massive graphs.
Explore our comprehensive data analysis project presentation on predicting product ad campaign performance. Learn how data-driven insights can optimize your marketing strategies and enhance campaign effectiveness. Perfect for professionals and students looking to understand the power of data analysis in advertising. for more details visit: https://bostoninstituteofanalytics.org/data-science-and-artificial-intelligence/
Show drafts
volume_up
Empowering the Data Analytics Ecosystem: A Laser Focus on Value
The data analytics ecosystem thrives when every component functions at its peak, unlocking the true potential of data. Here's a laser focus on key areas for an empowered ecosystem:
1. Democratize Access, Not Data:
Granular Access Controls: Provide users with self-service tools tailored to their specific needs, preventing data overload and misuse.
Data Catalogs: Implement robust data catalogs for easy discovery and understanding of available data sources.
2. Foster Collaboration with Clear Roles:
Data Mesh Architecture: Break down data silos by creating a distributed data ownership model with clear ownership and responsibilities.
Collaborative Workspaces: Utilize interactive platforms where data scientists, analysts, and domain experts can work seamlessly together.
3. Leverage Advanced Analytics Strategically:
AI-powered Automation: Automate repetitive tasks like data cleaning and feature engineering, freeing up data talent for higher-level analysis.
Right-Tool Selection: Strategically choose the most effective advanced analytics techniques (e.g., AI, ML) based on specific business problems.
4. Prioritize Data Quality with Automation:
Automated Data Validation: Implement automated data quality checks to identify and rectify errors at the source, minimizing downstream issues.
Data Lineage Tracking: Track the flow of data throughout the ecosystem, ensuring transparency and facilitating root cause analysis for errors.
5. Cultivate a Data-Driven Mindset:
Metrics-Driven Performance Management: Align KPIs and performance metrics with data-driven insights to ensure actionable decision making.
Data Storytelling Workshops: Equip stakeholders with the skills to translate complex data findings into compelling narratives that drive action.
Benefits of a Precise Ecosystem:
Sharpened Focus: Precise access and clear roles ensure everyone works with the most relevant data, maximizing efficiency.
Actionable Insights: Strategic analytics and automated quality checks lead to more reliable and actionable data insights.
Continuous Improvement: Data-driven performance management fosters a culture of learning and continuous improvement.
Sustainable Growth: Empowered by data, organizations can make informed decisions to drive sustainable growth and innovation.
By focusing on these precise actions, organizations can create an empowered data analytics ecosystem that delivers real value by driving data-driven decisions and maximizing the return on their data investment.