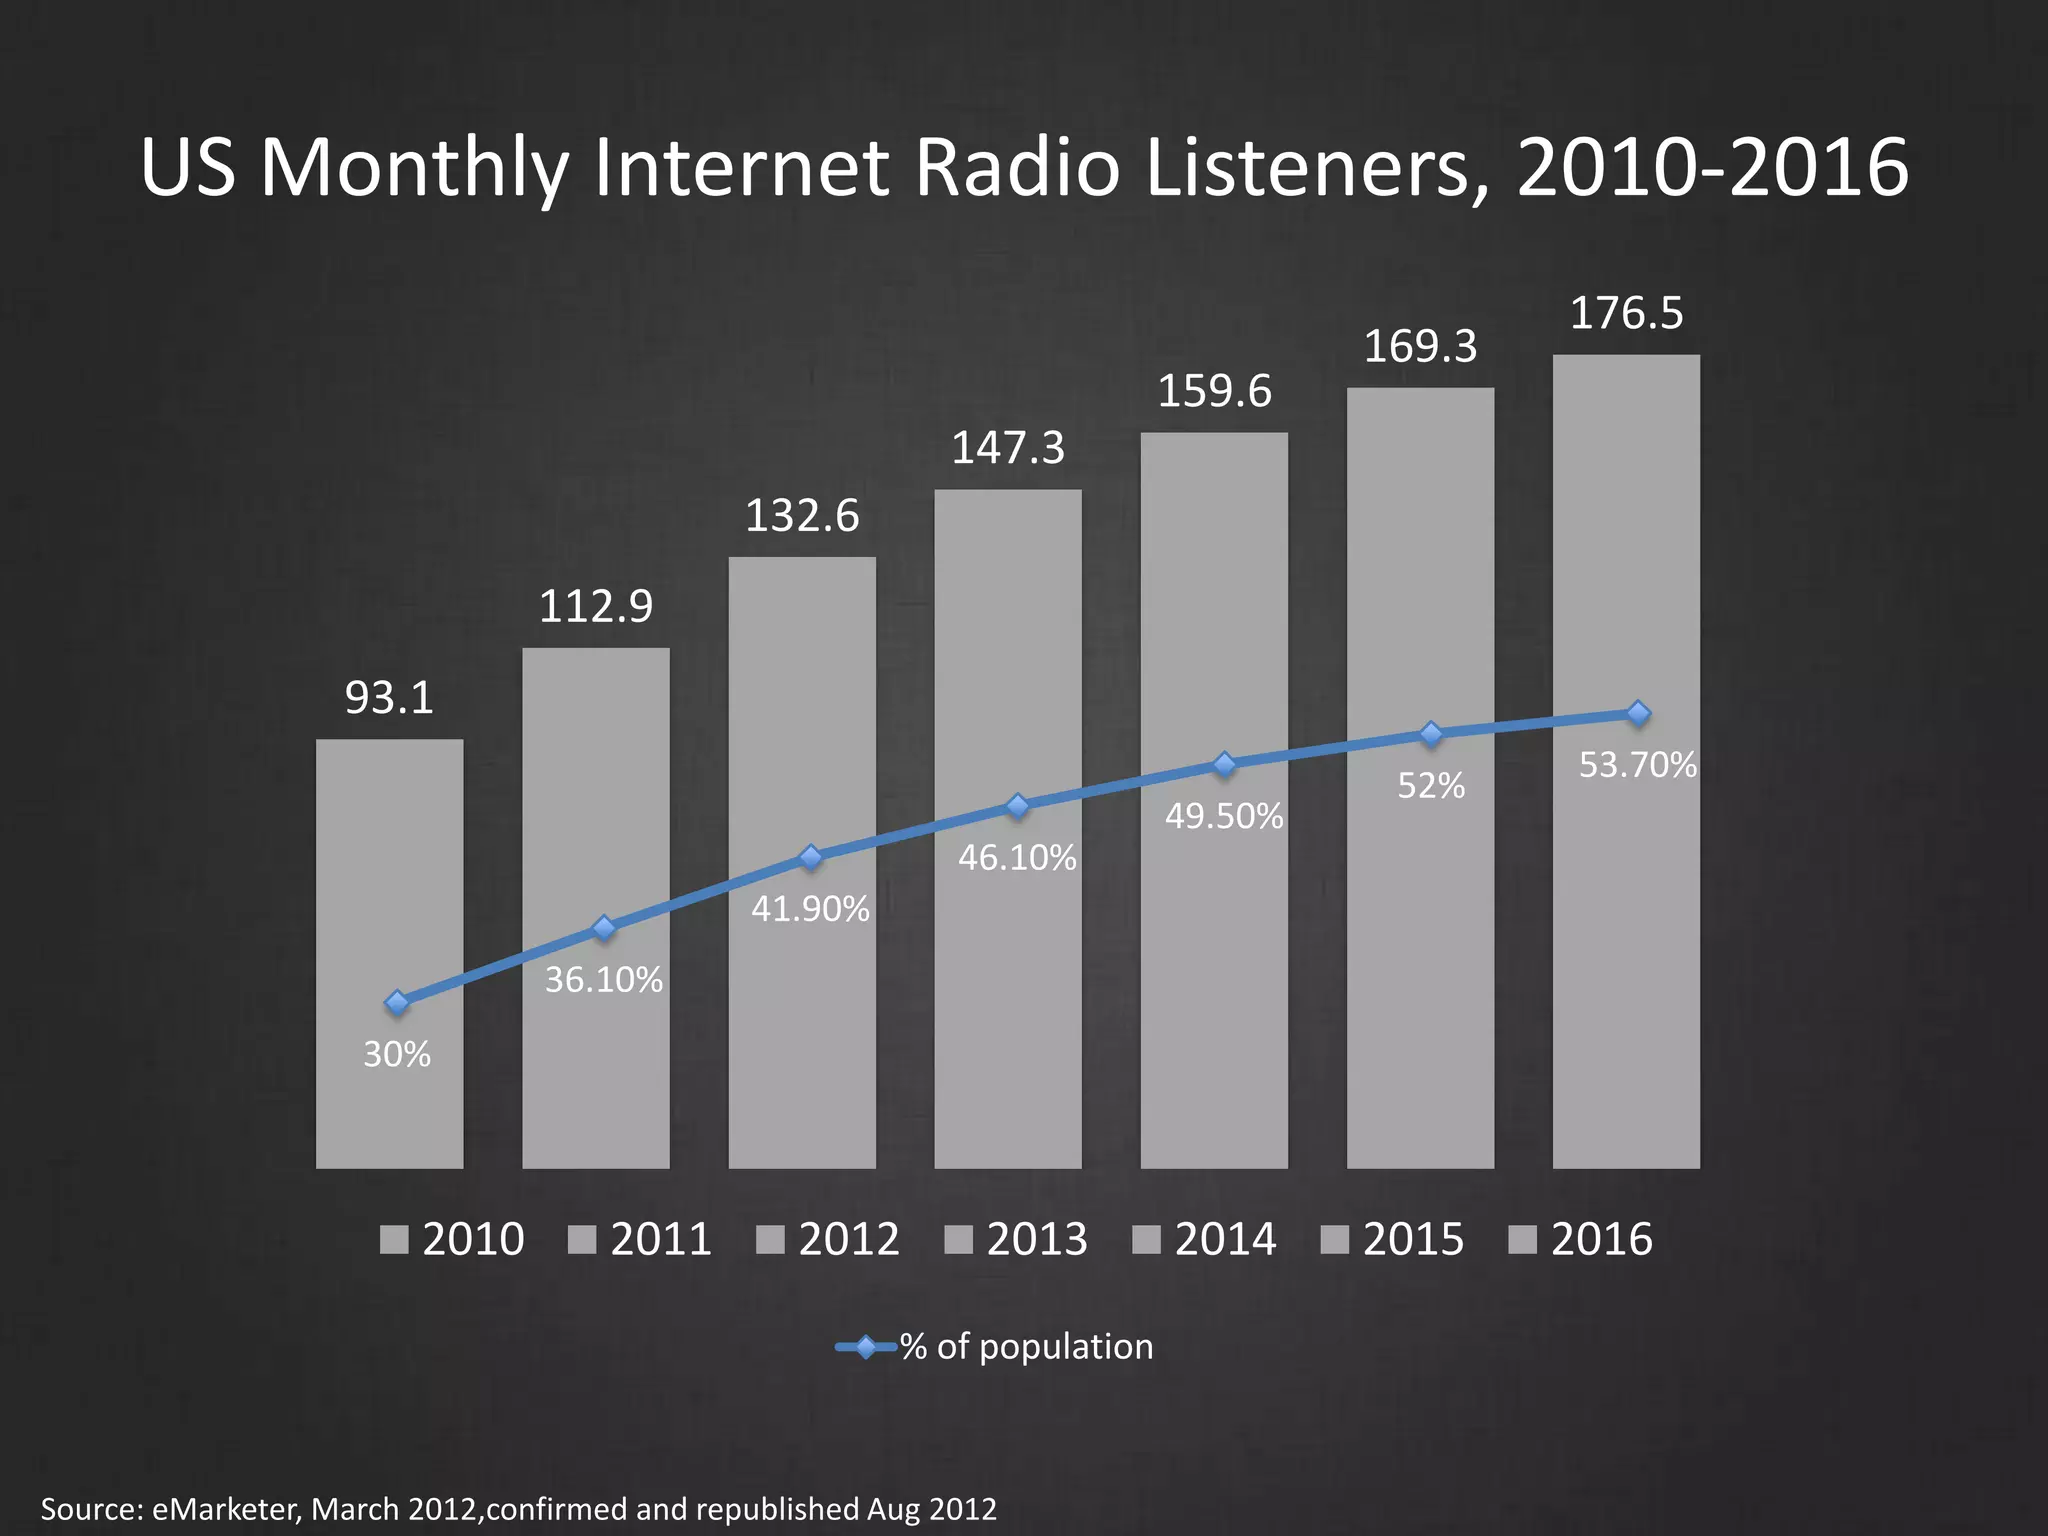
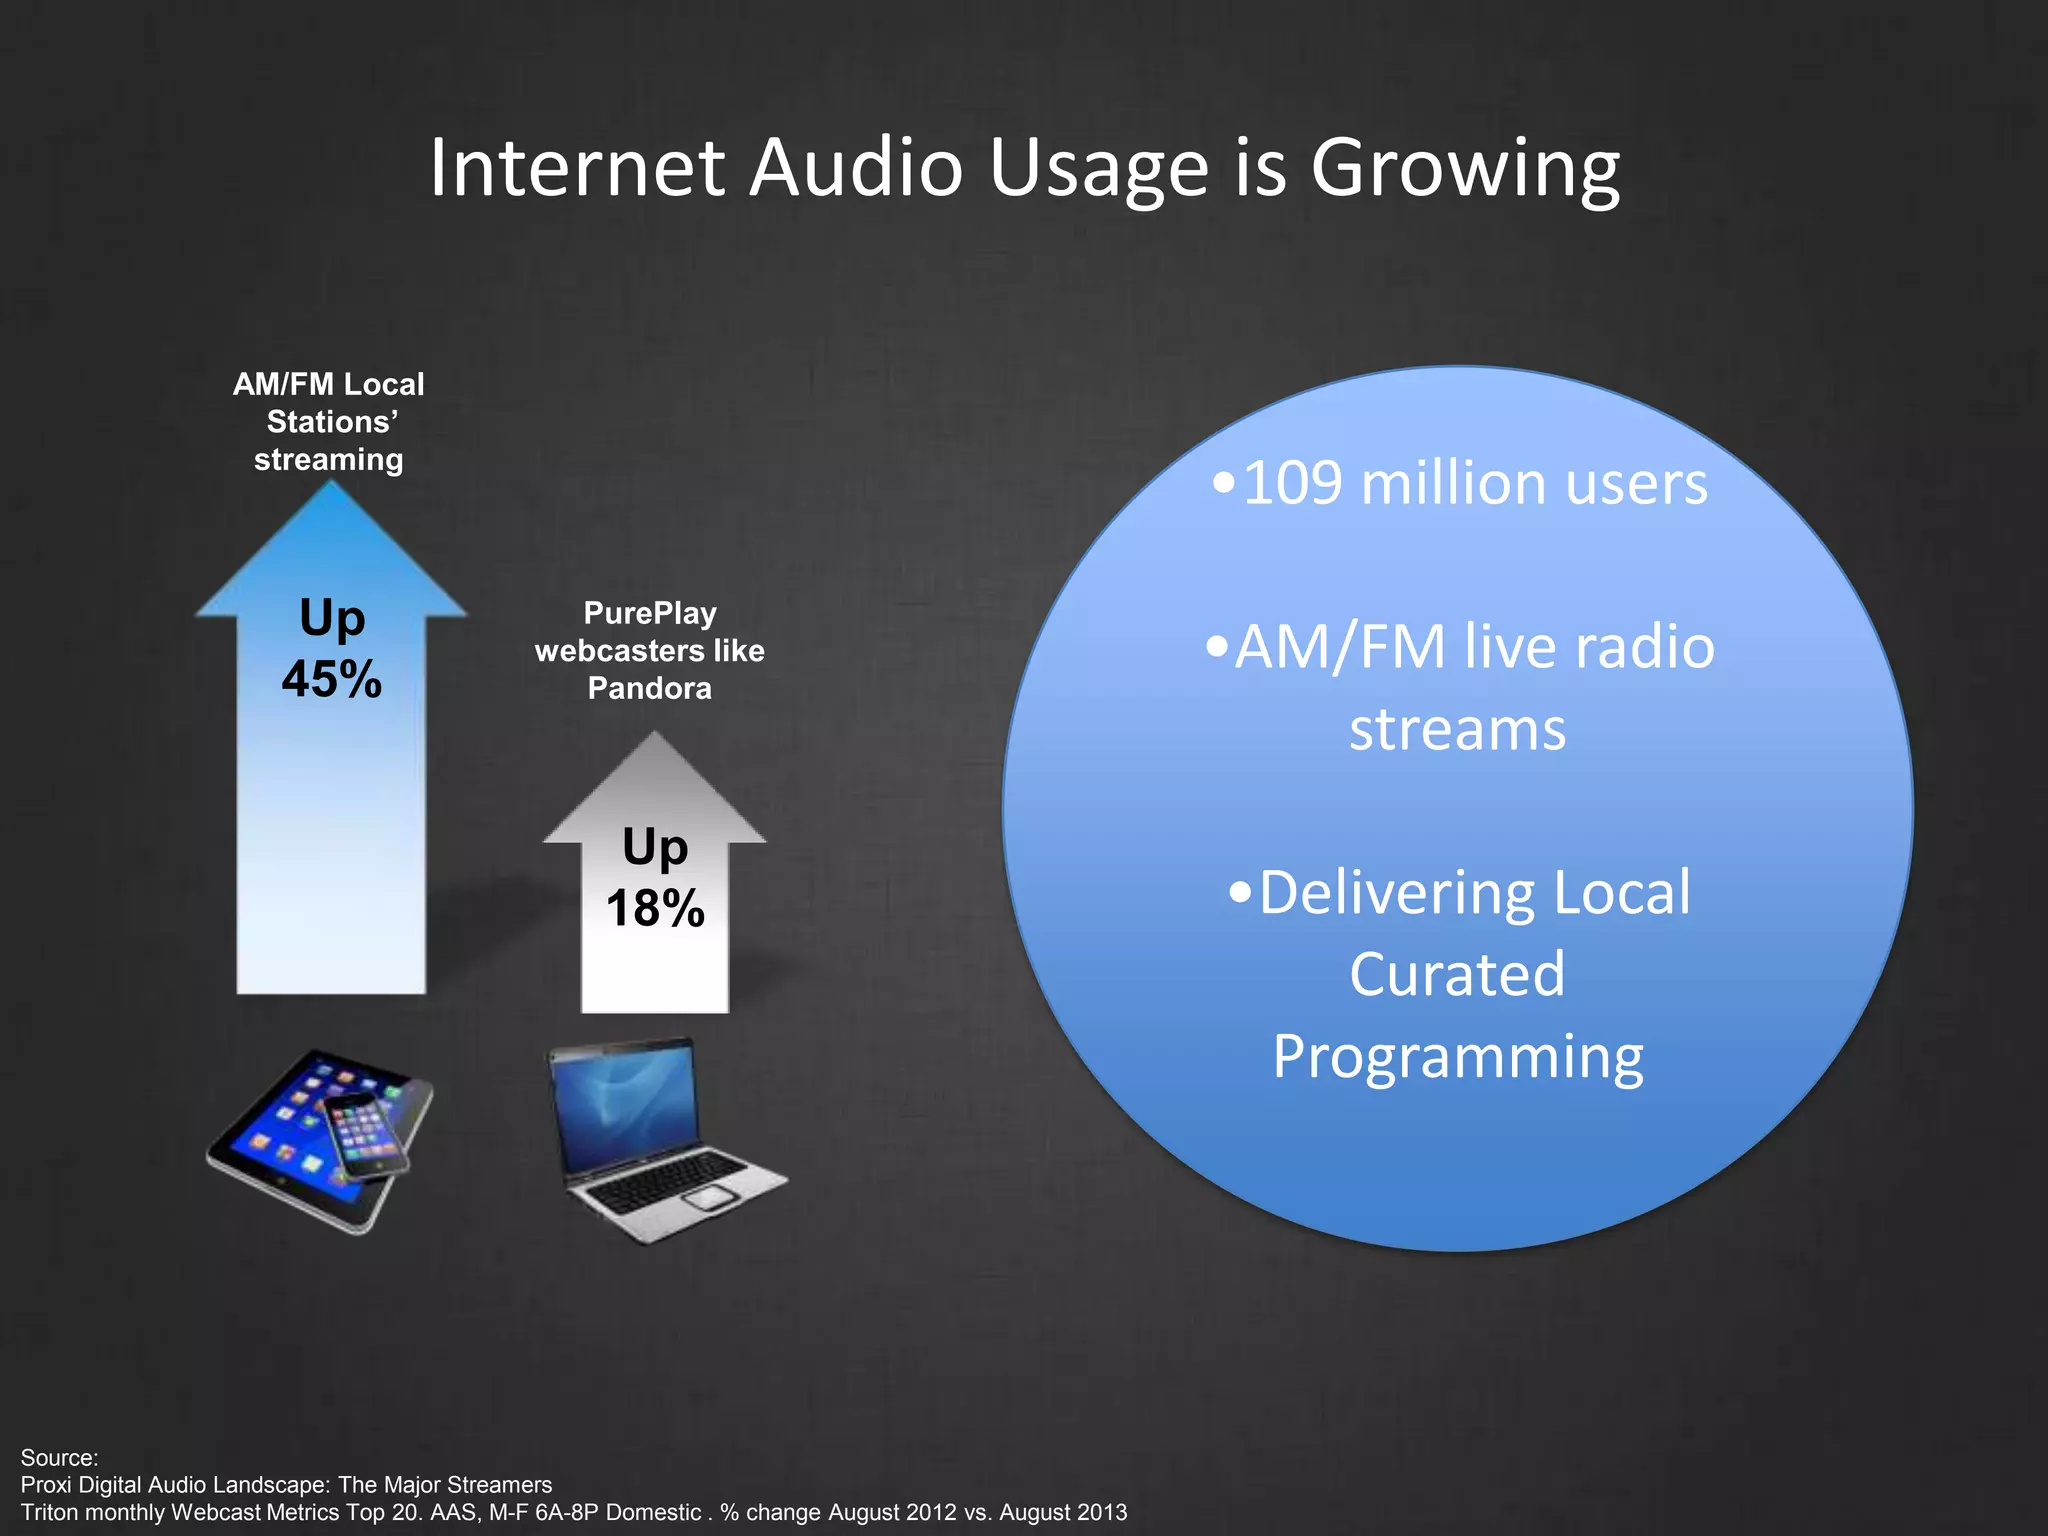
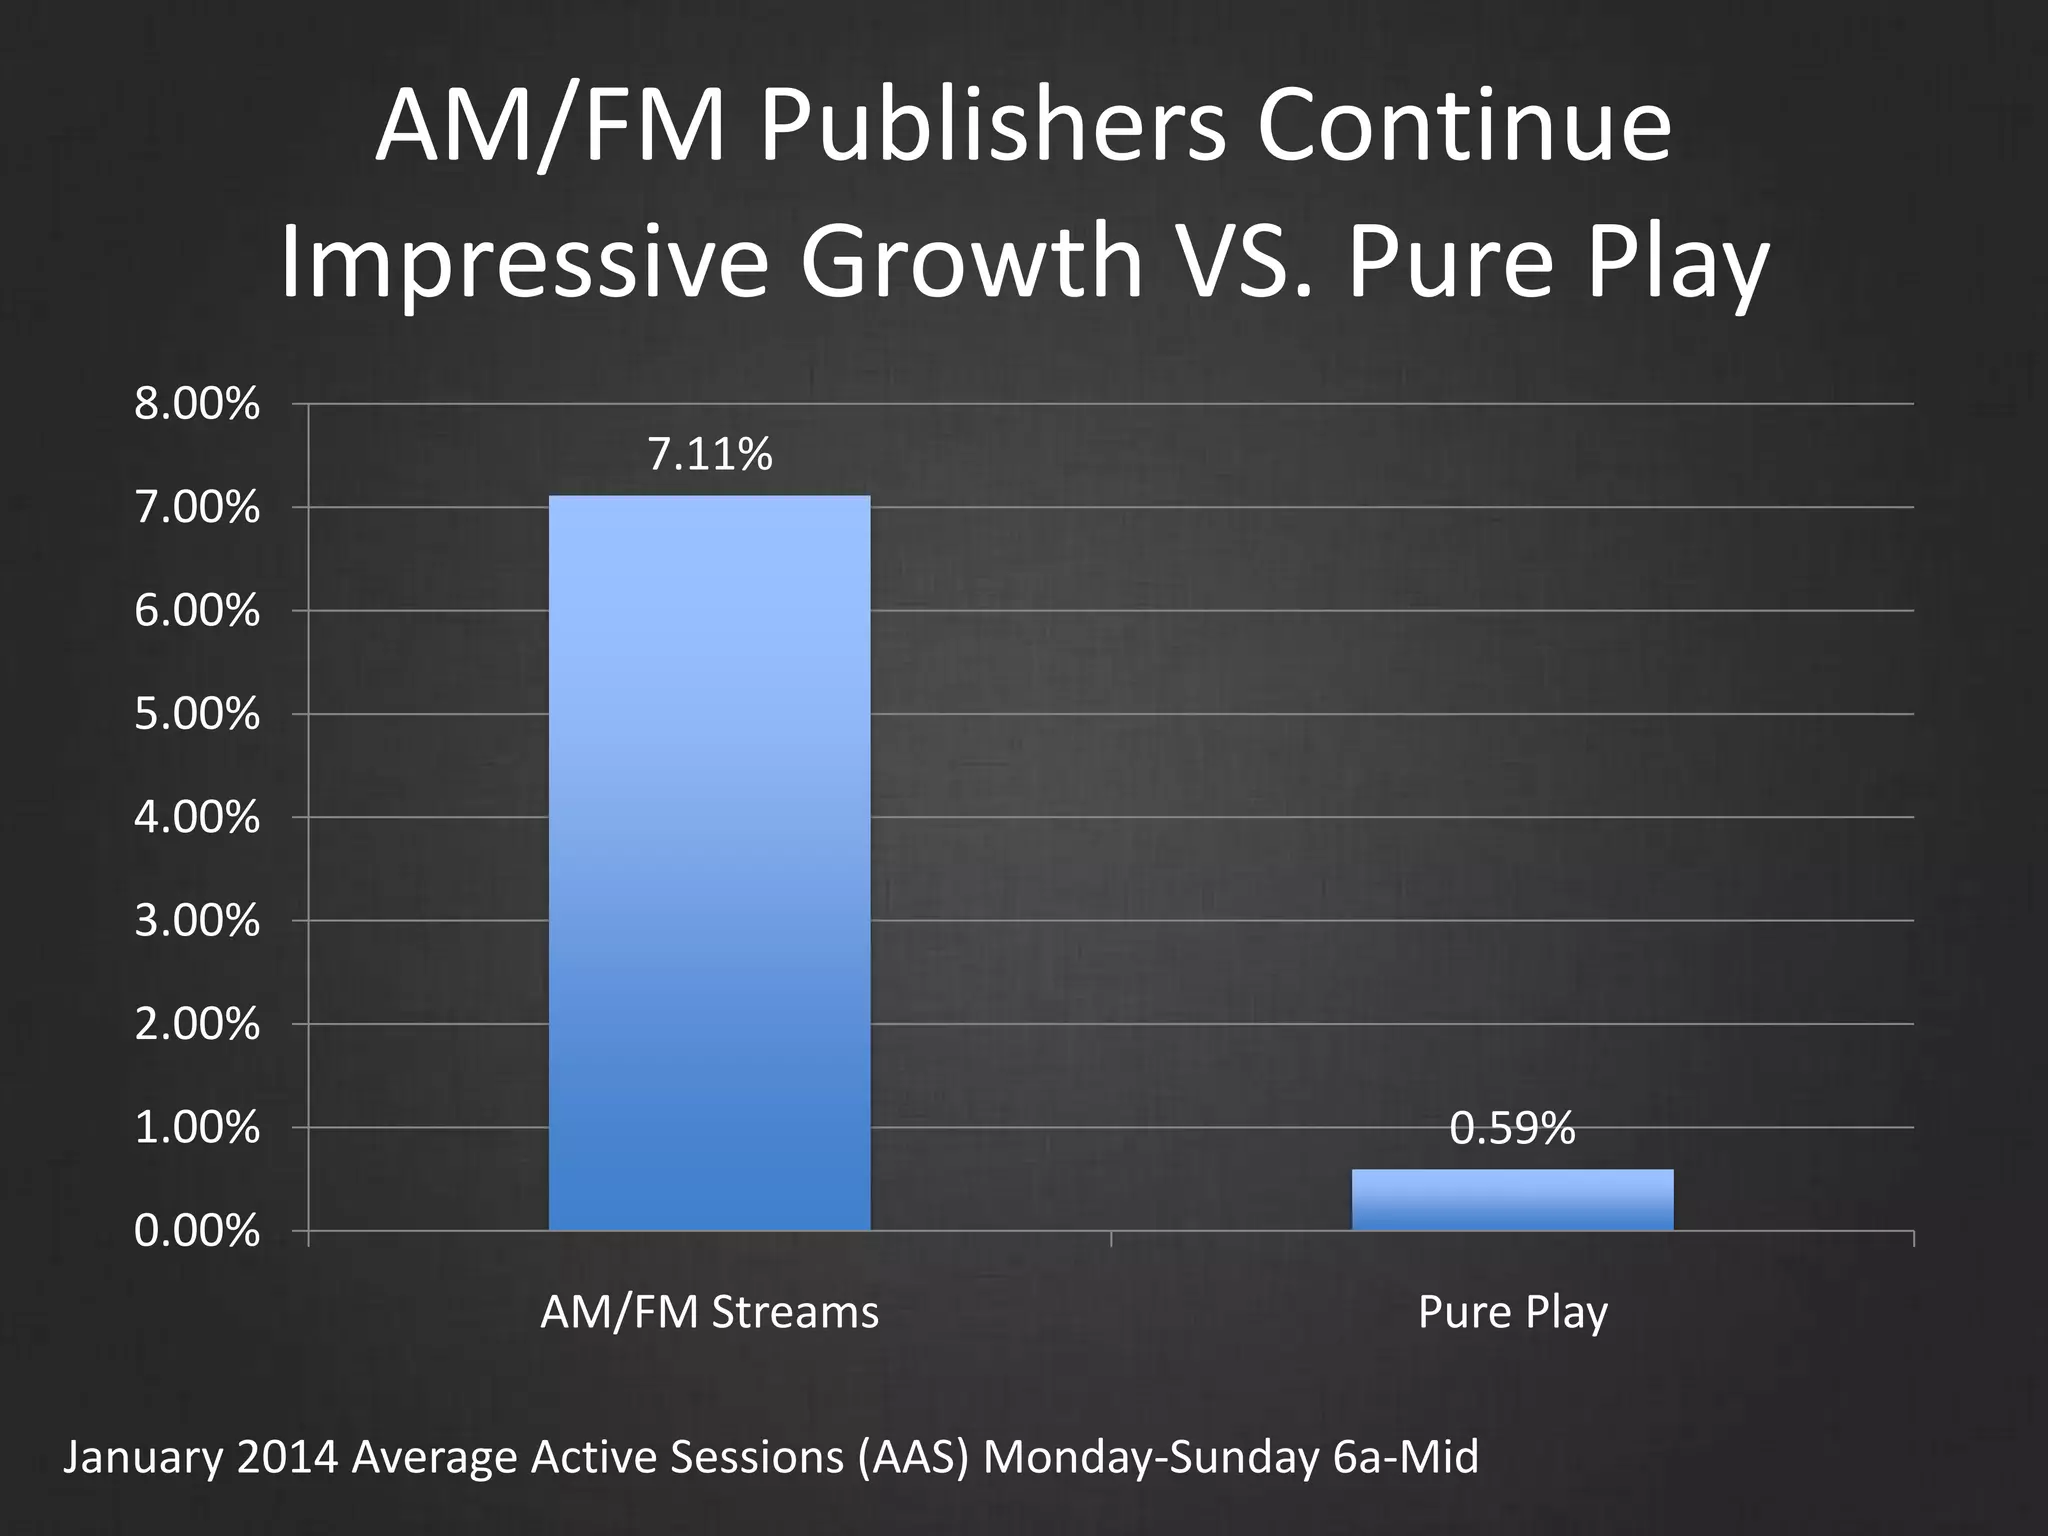
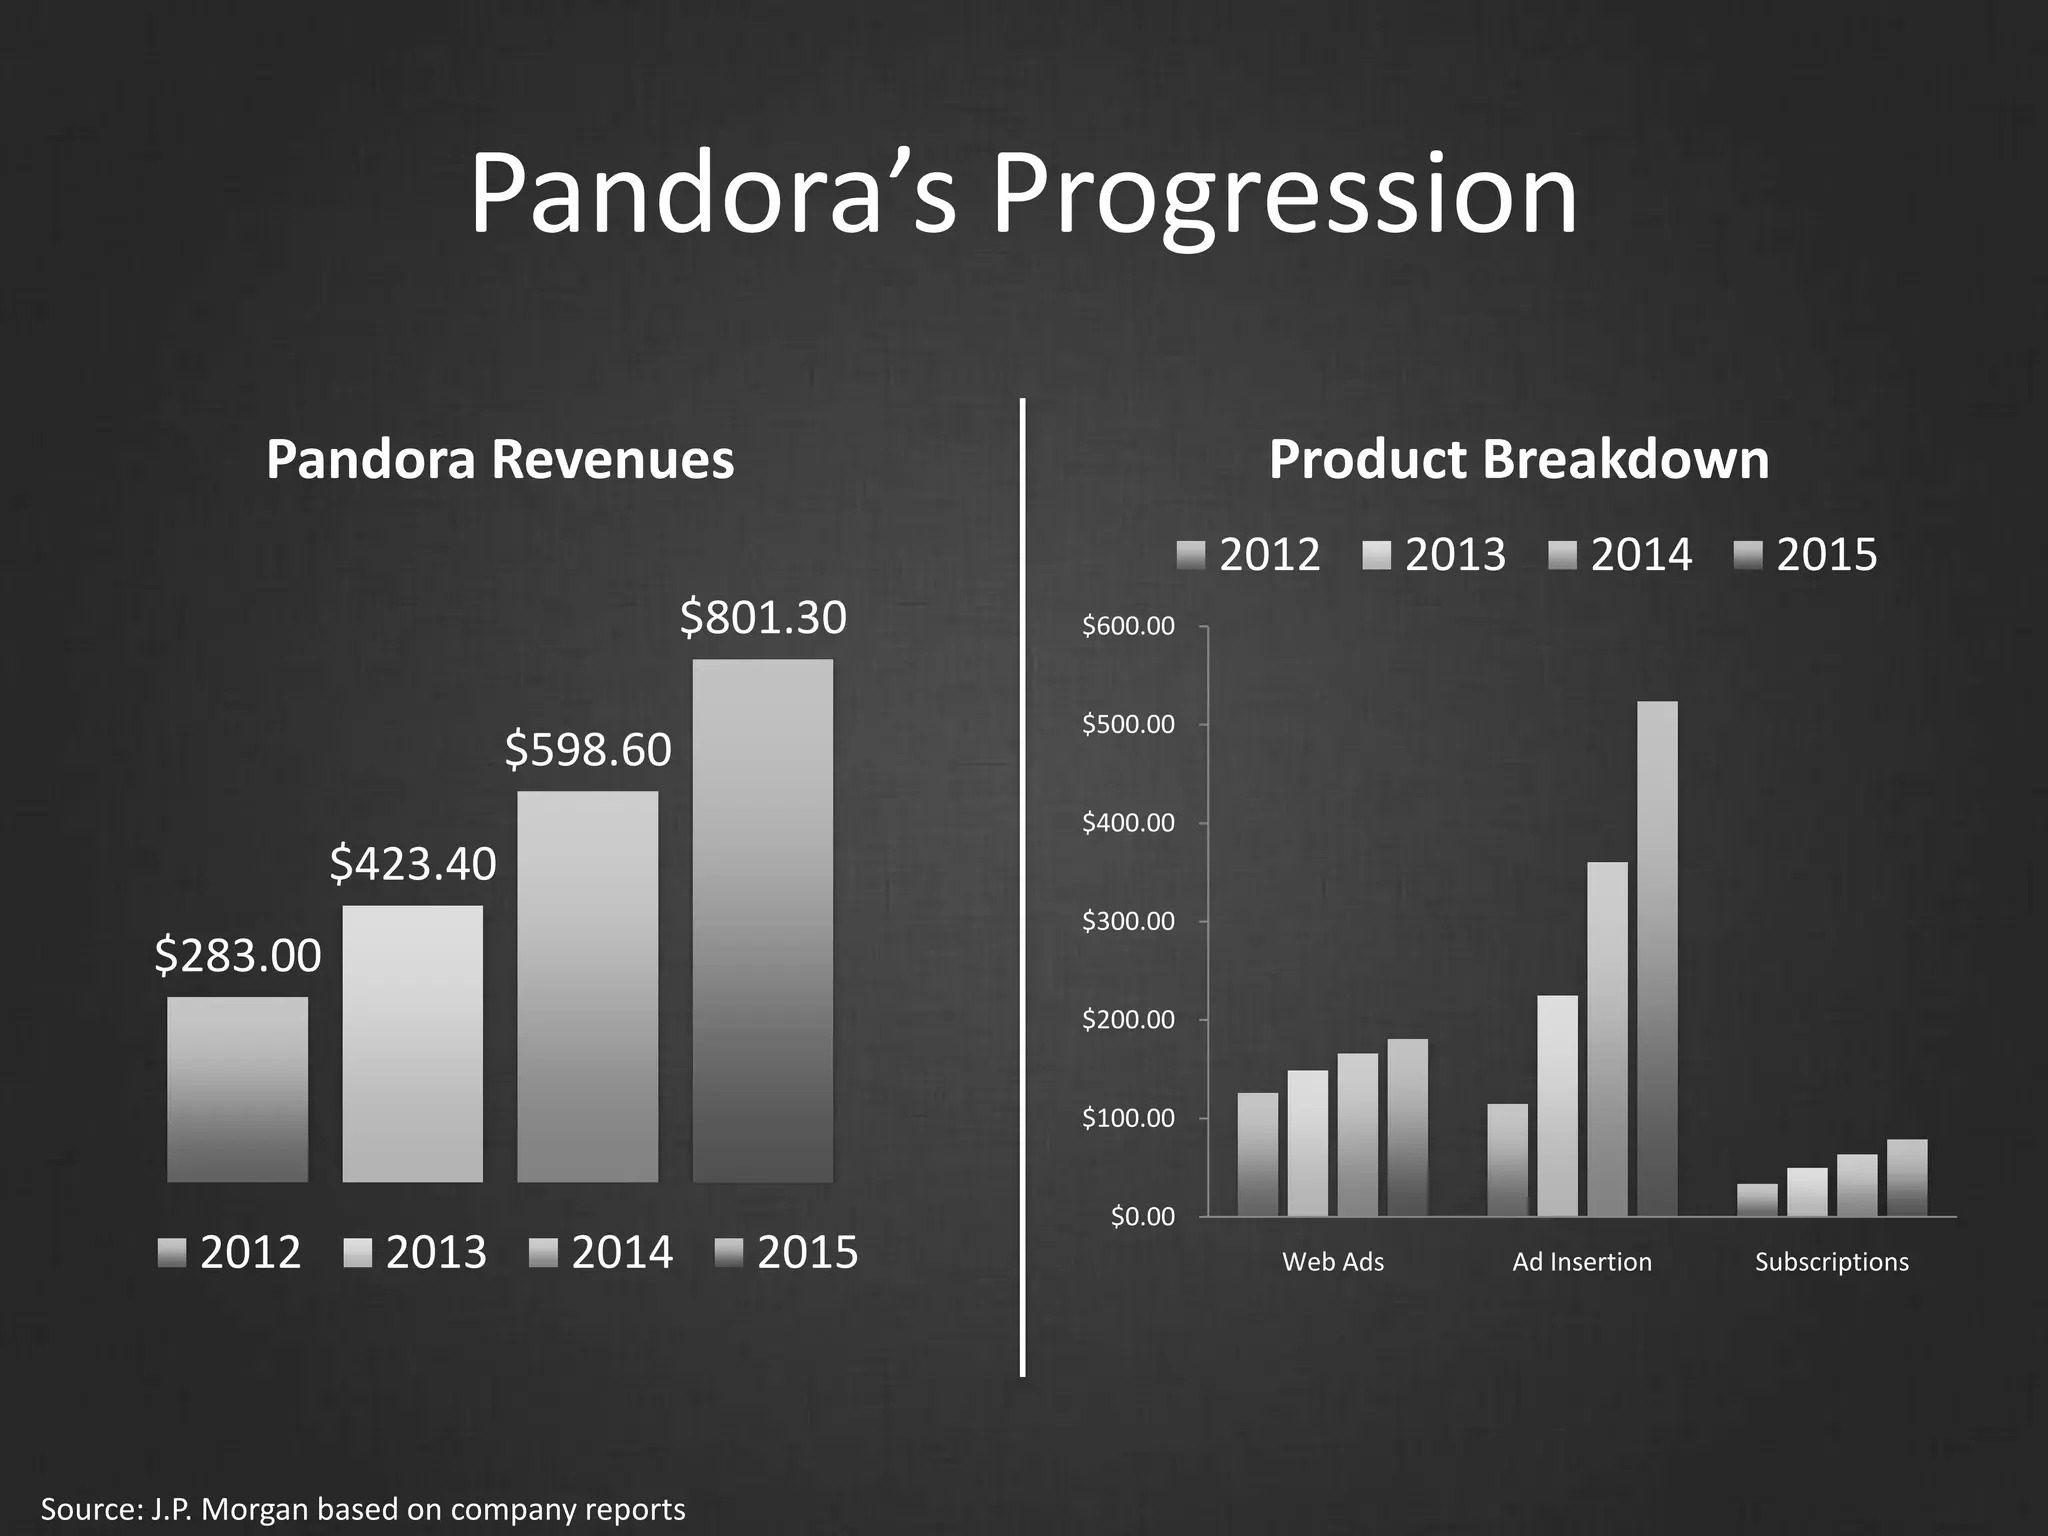
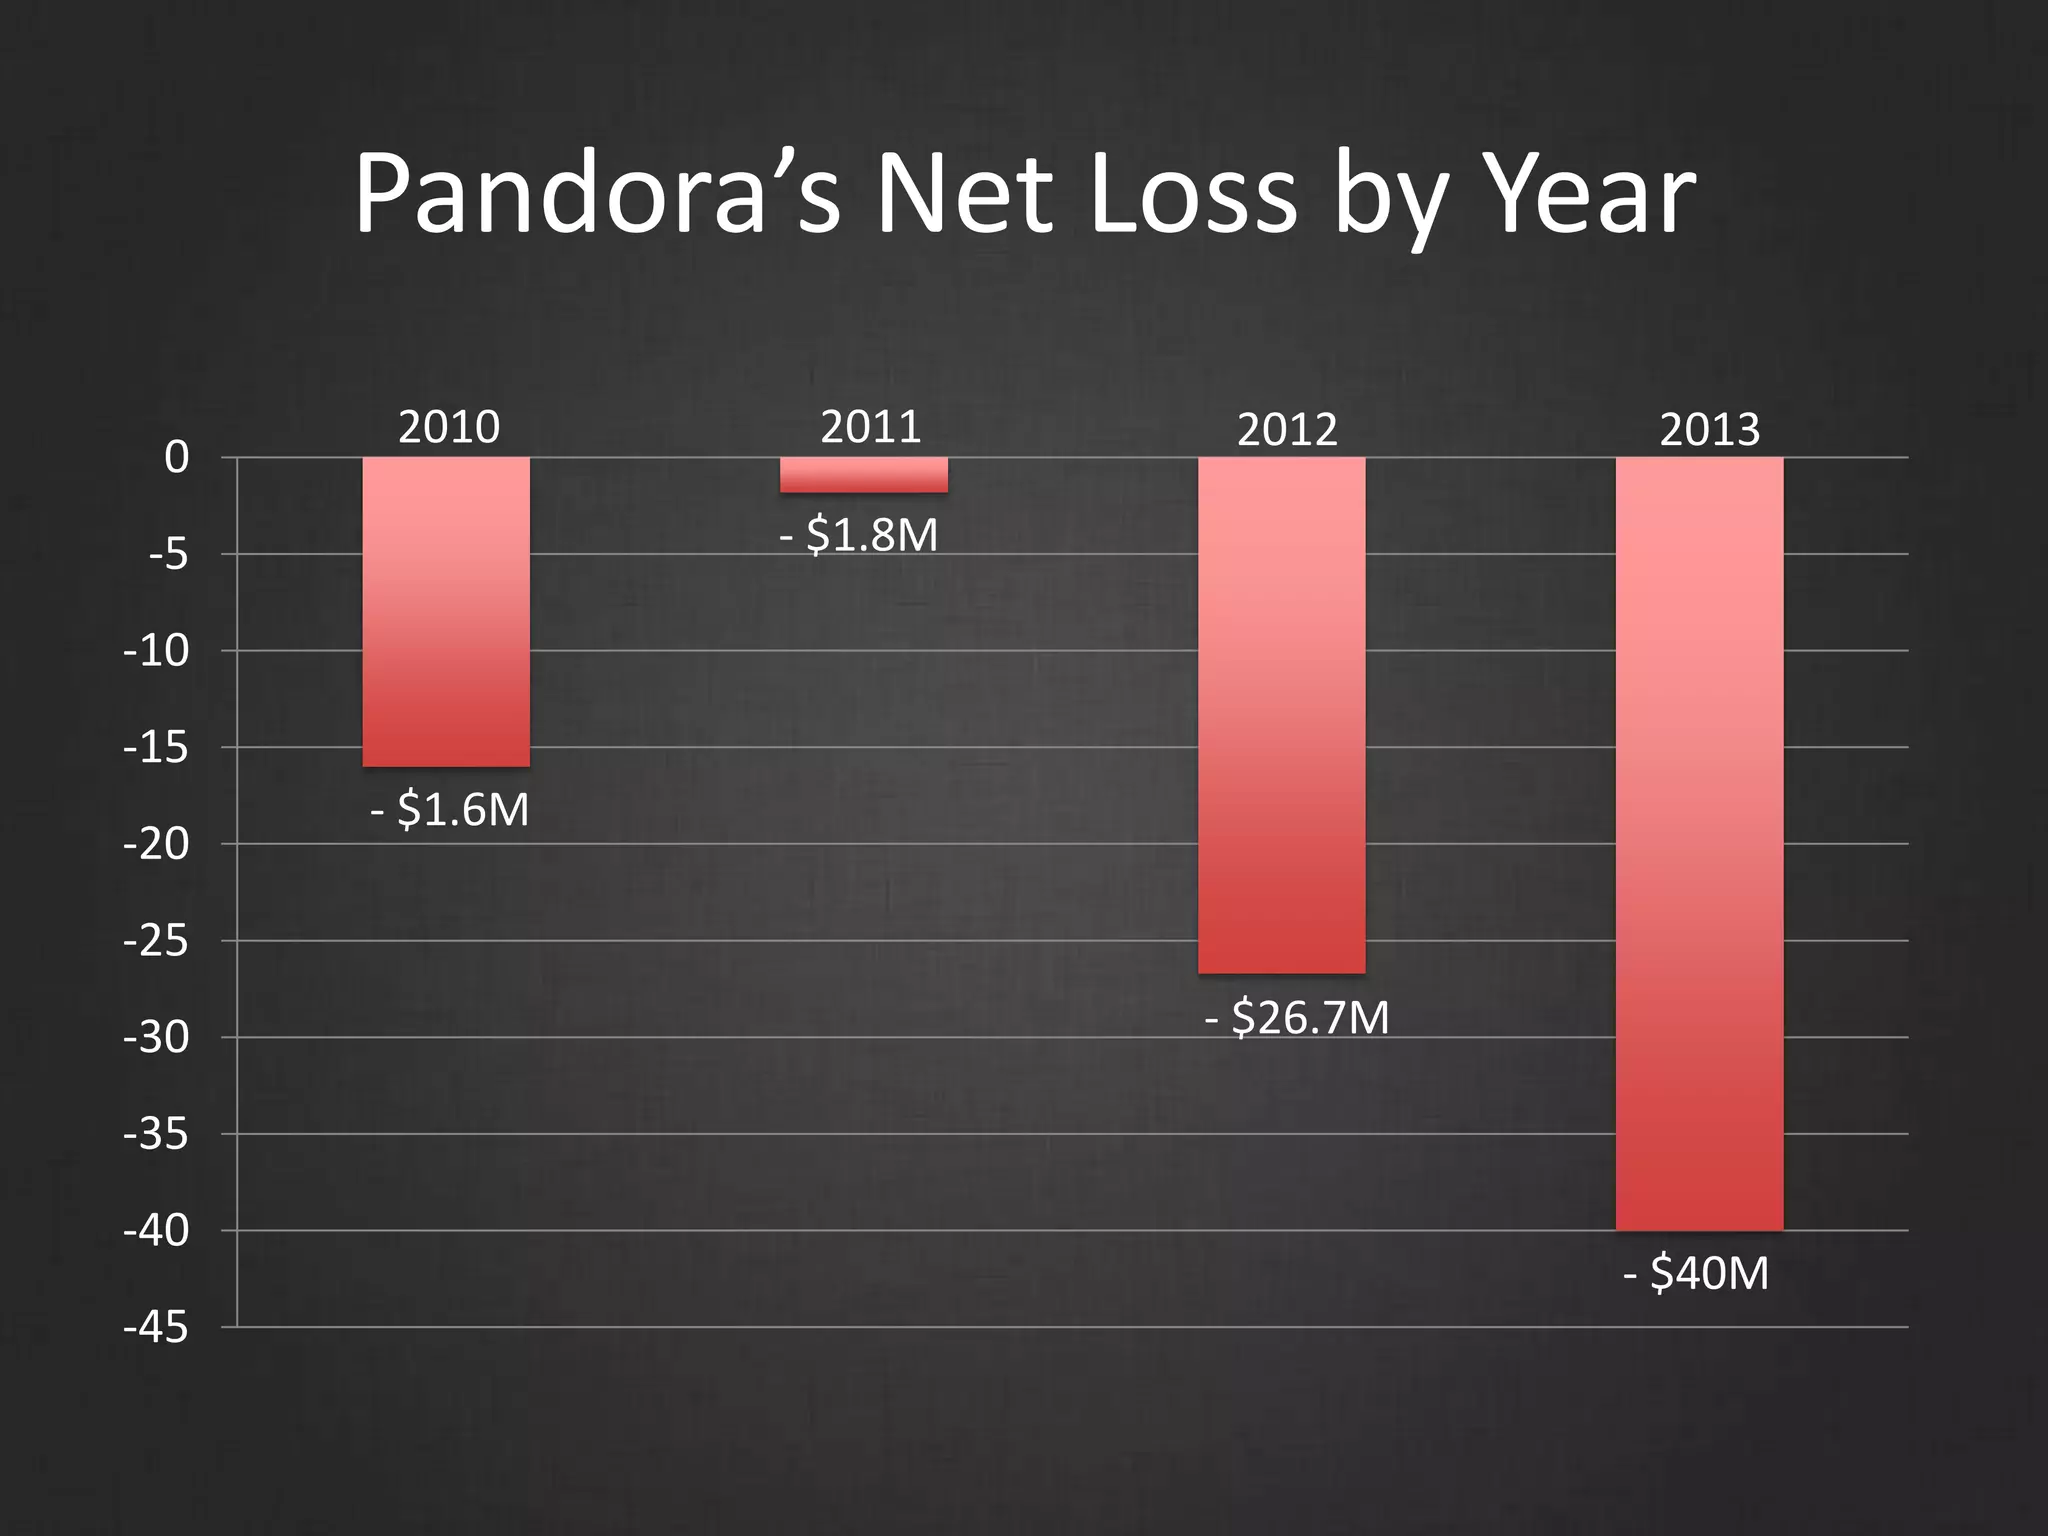
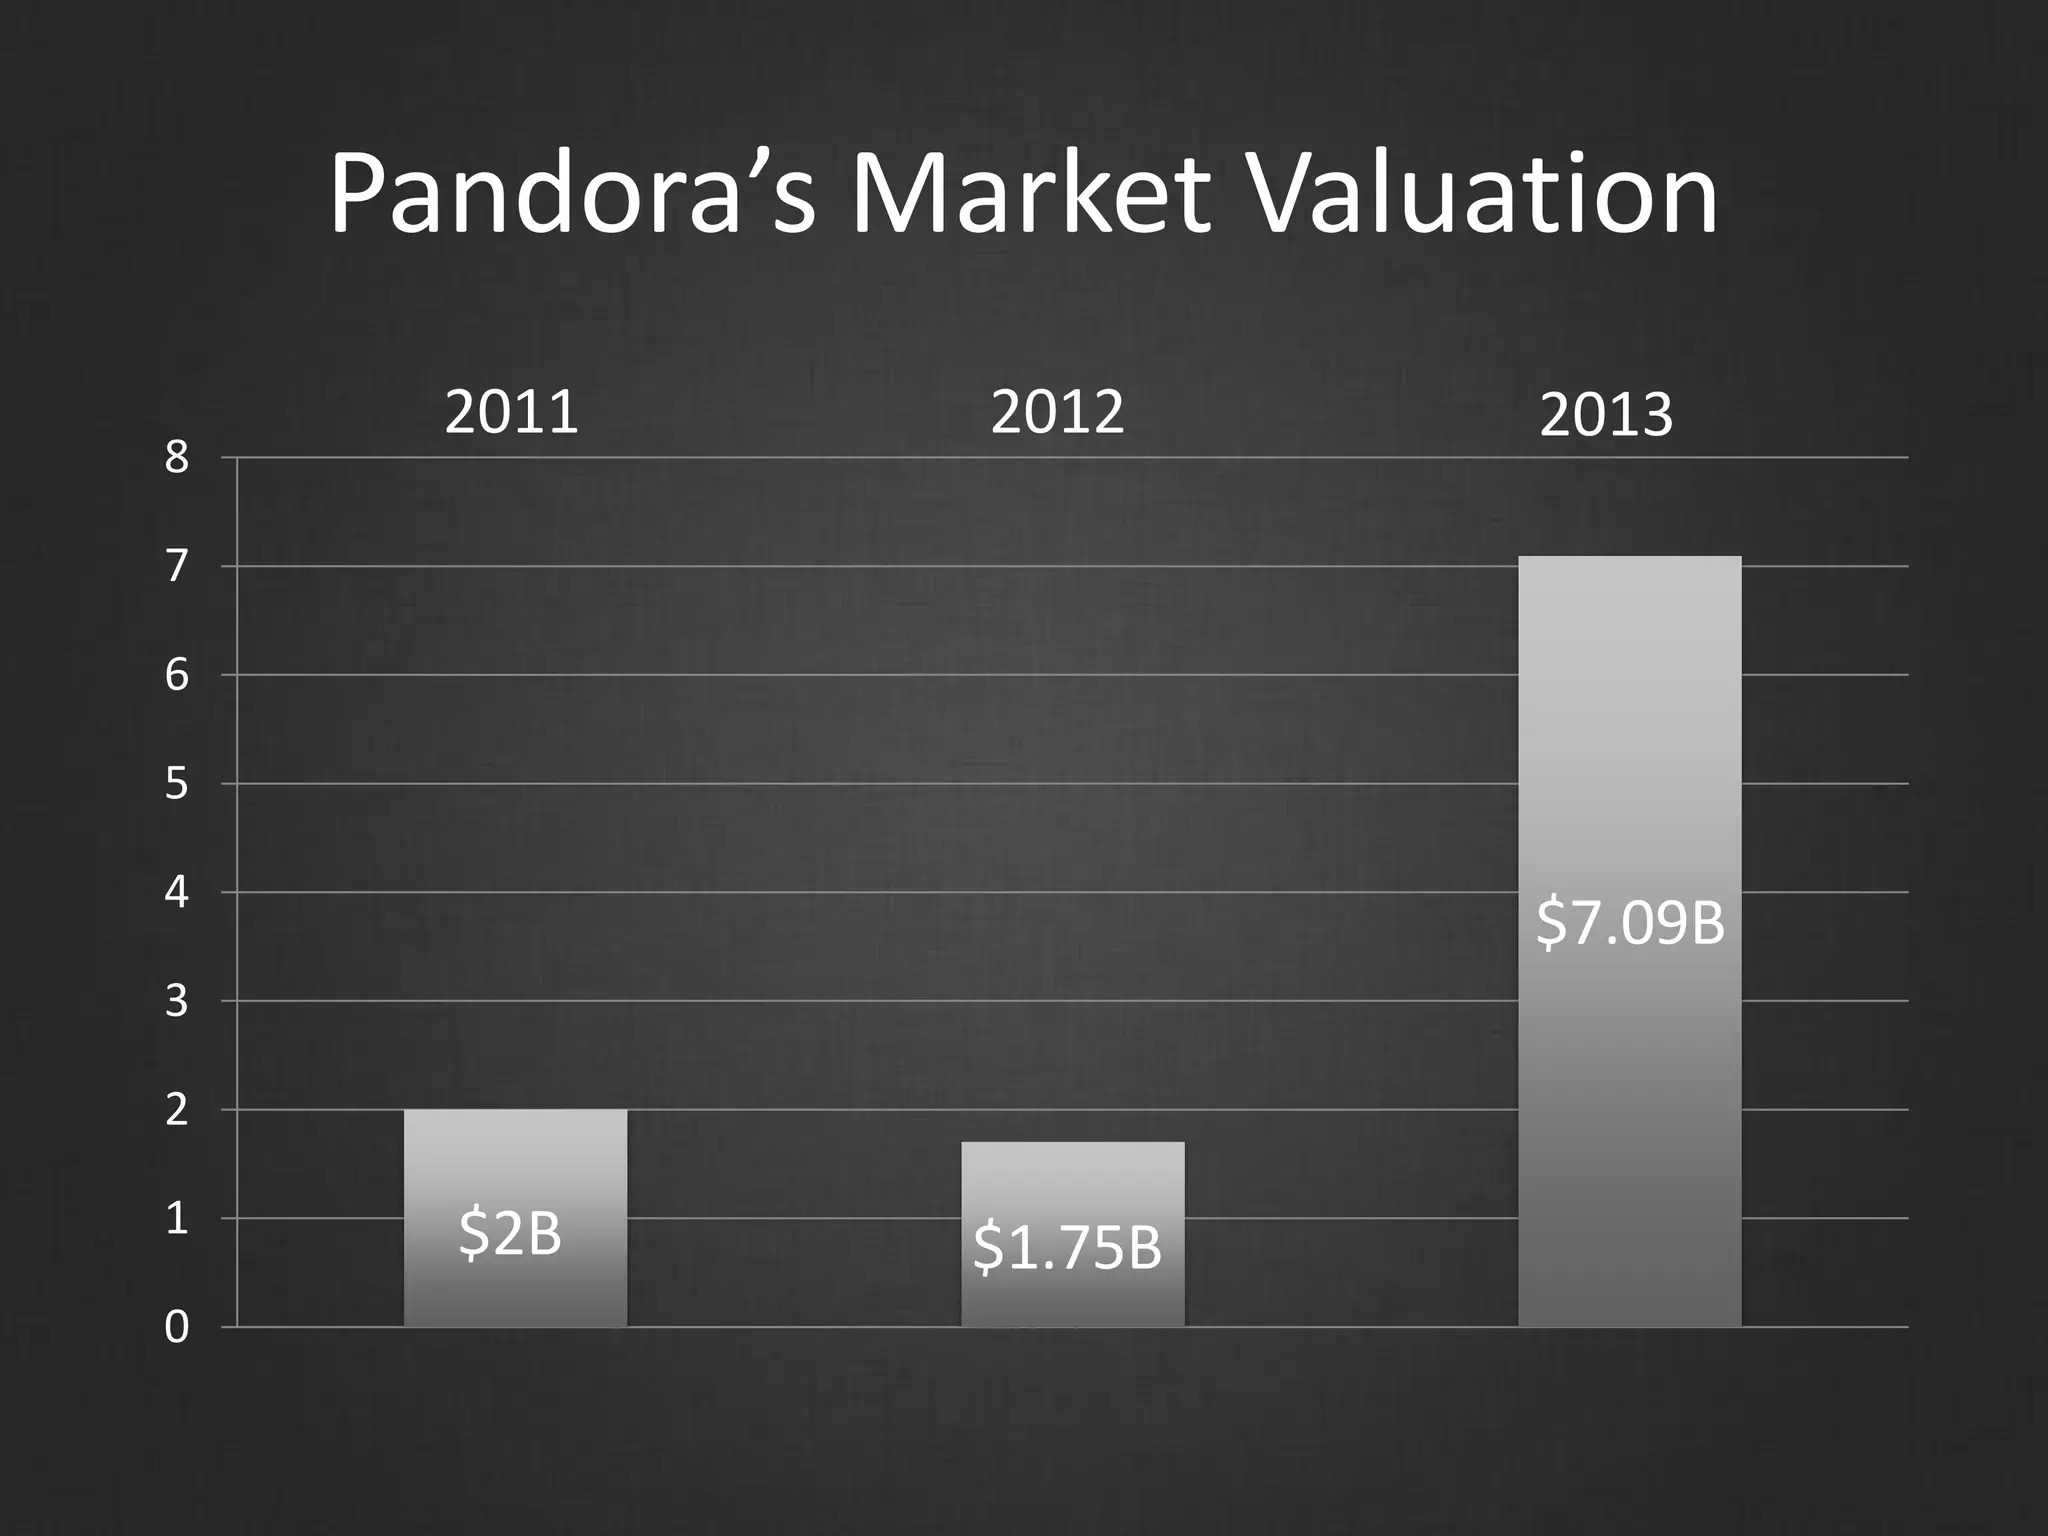
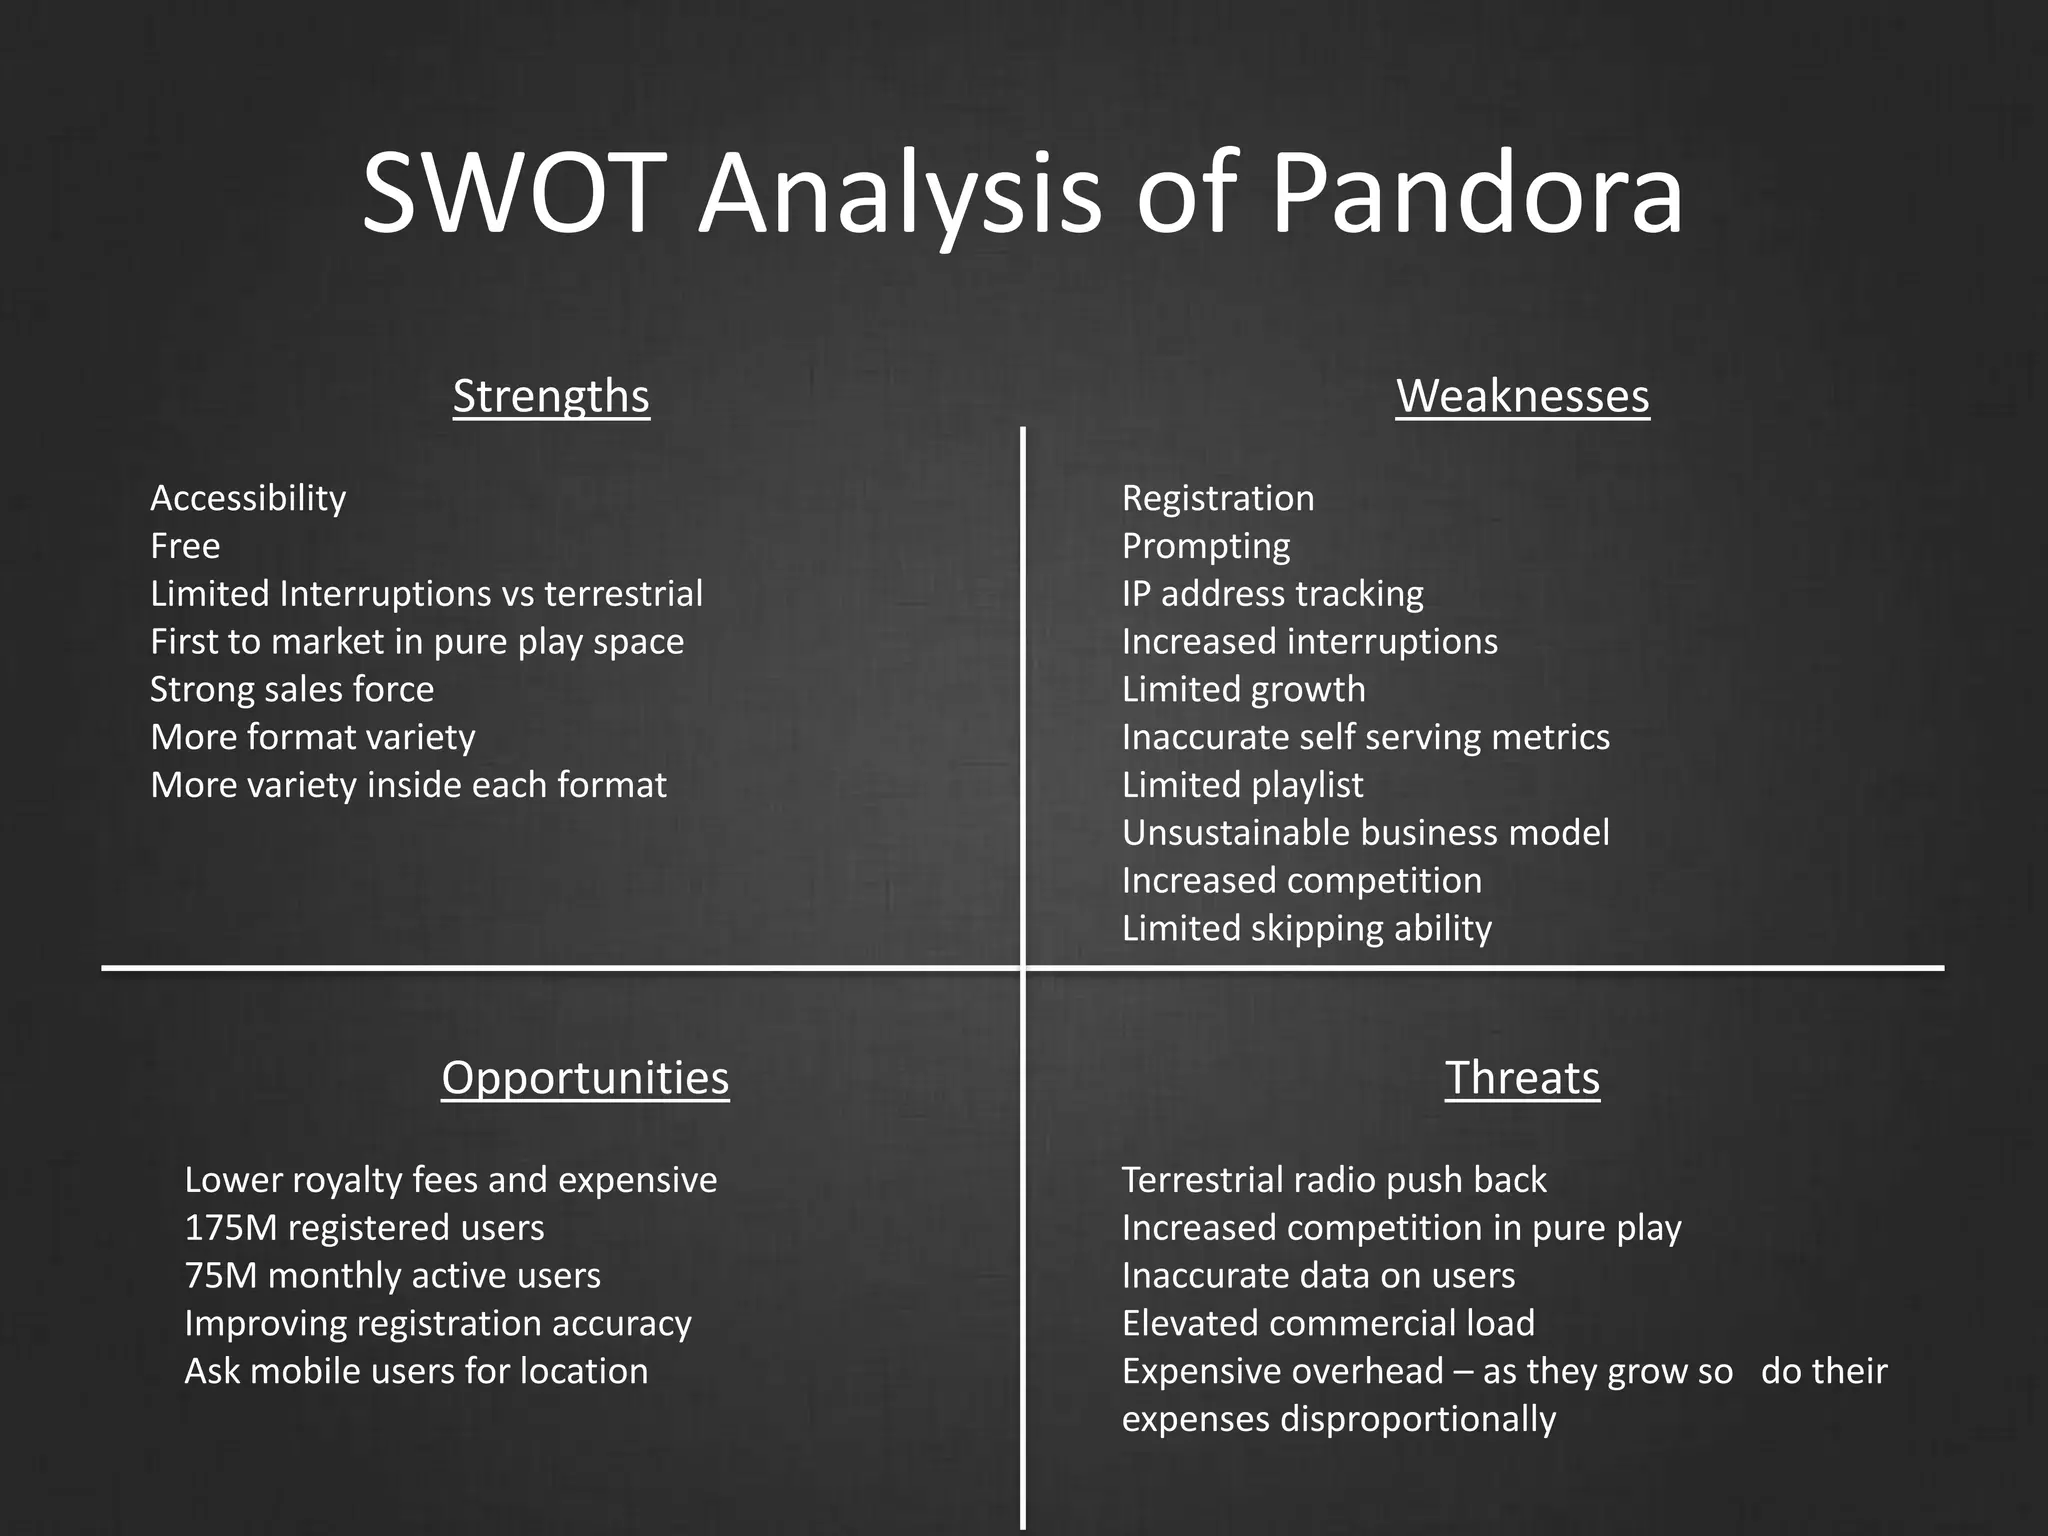
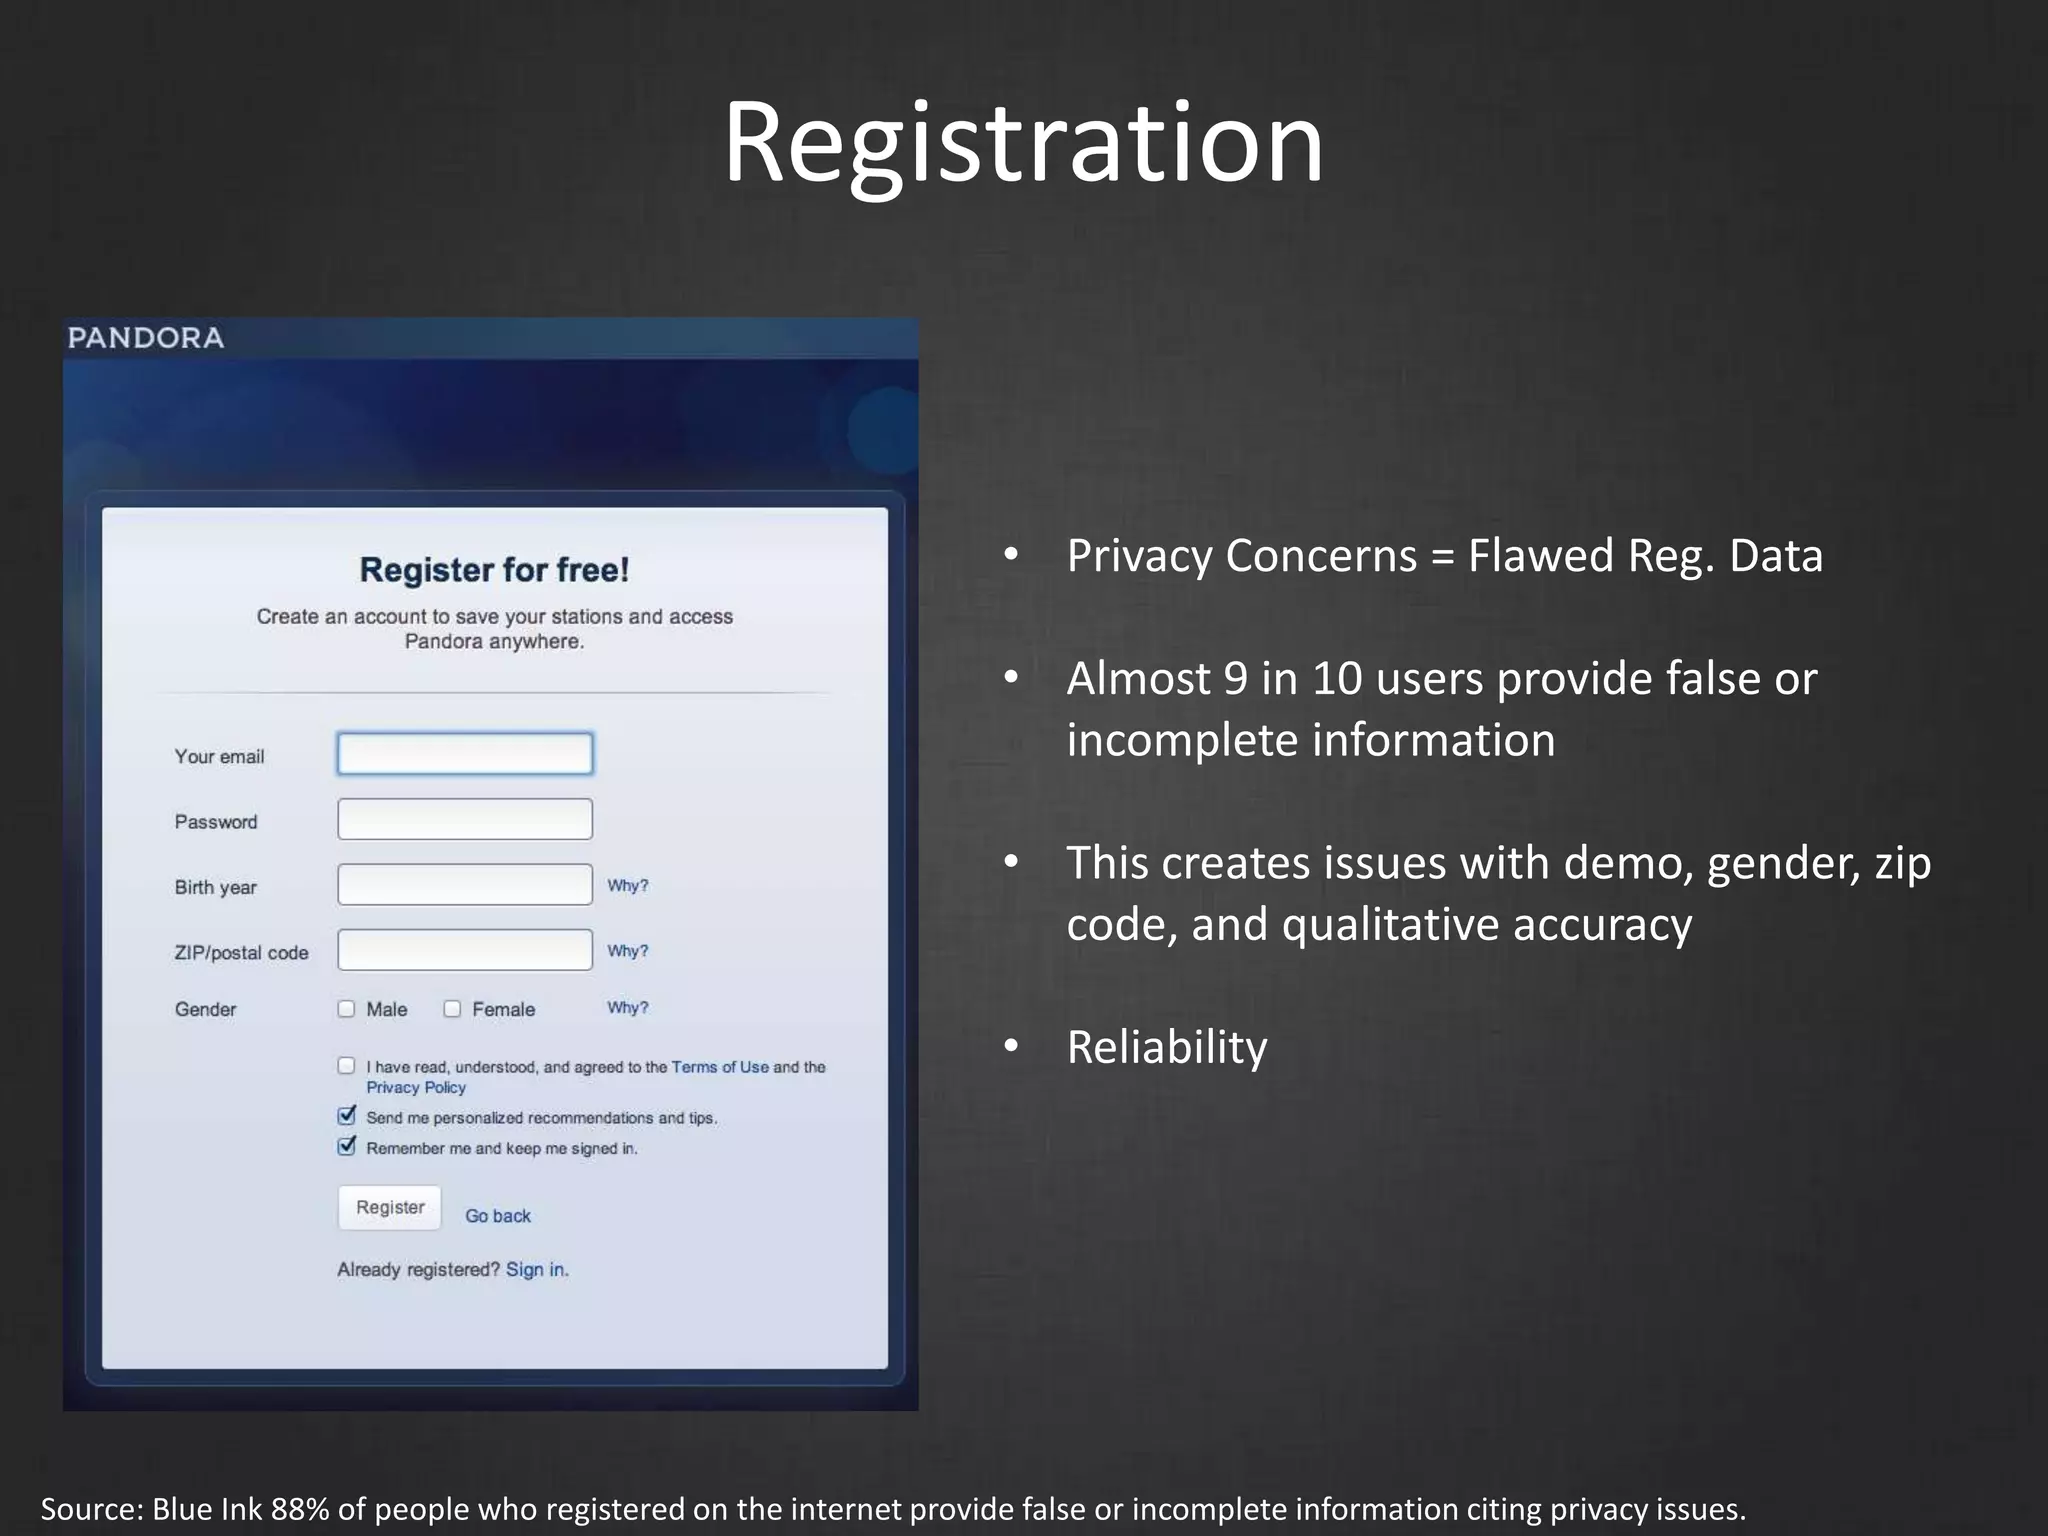
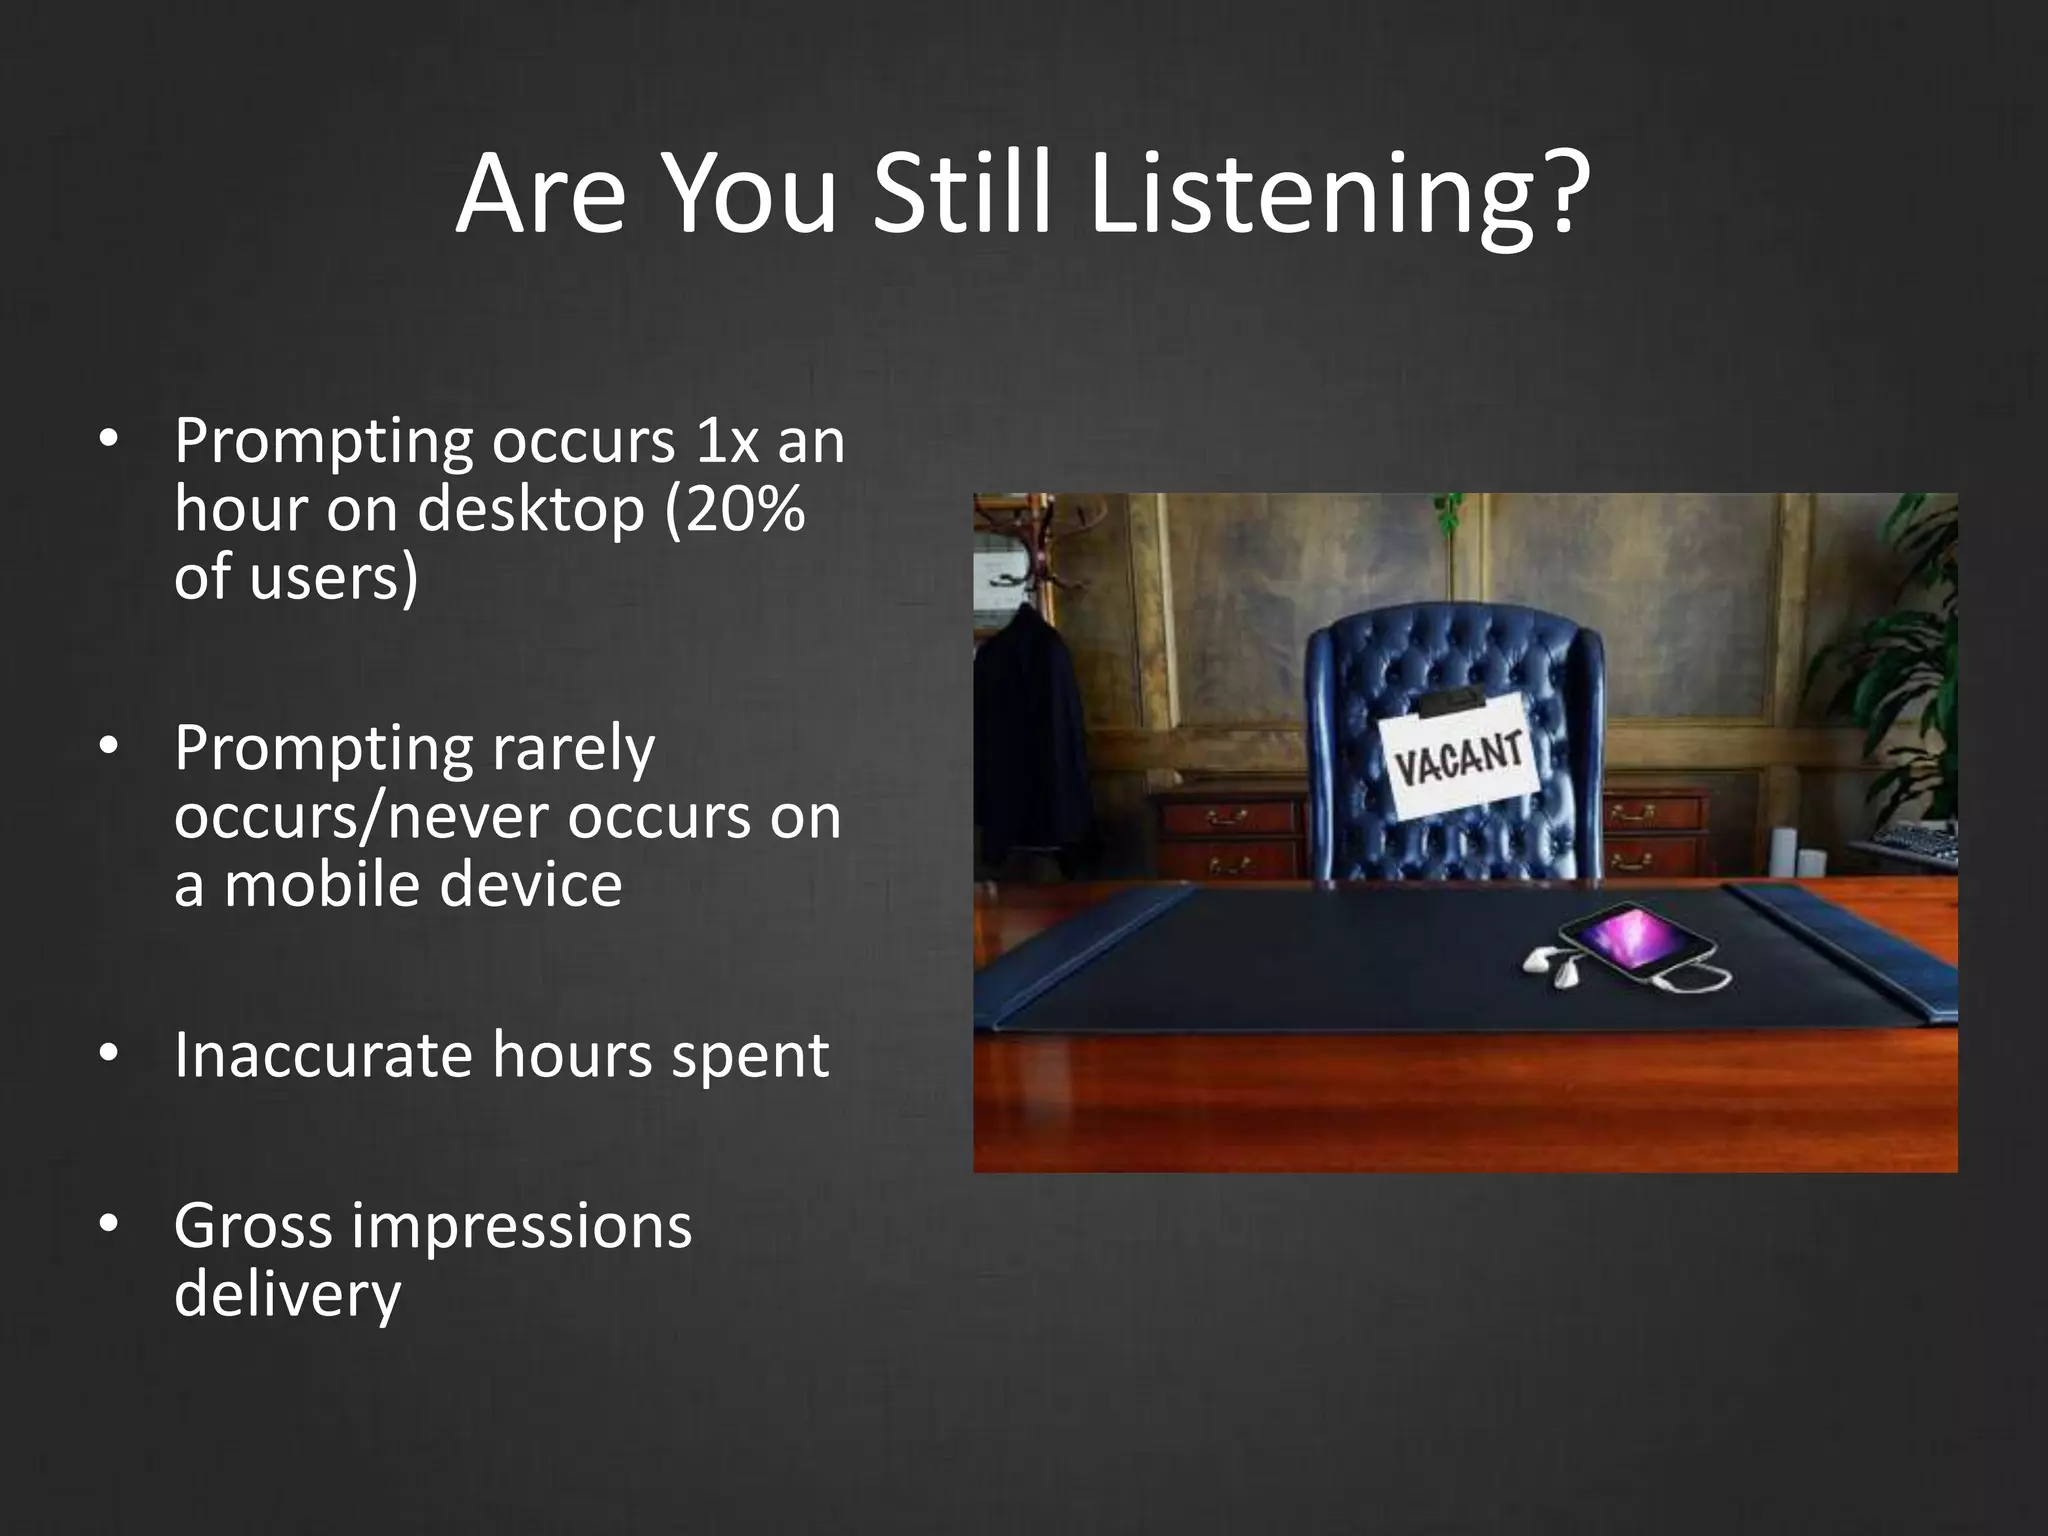
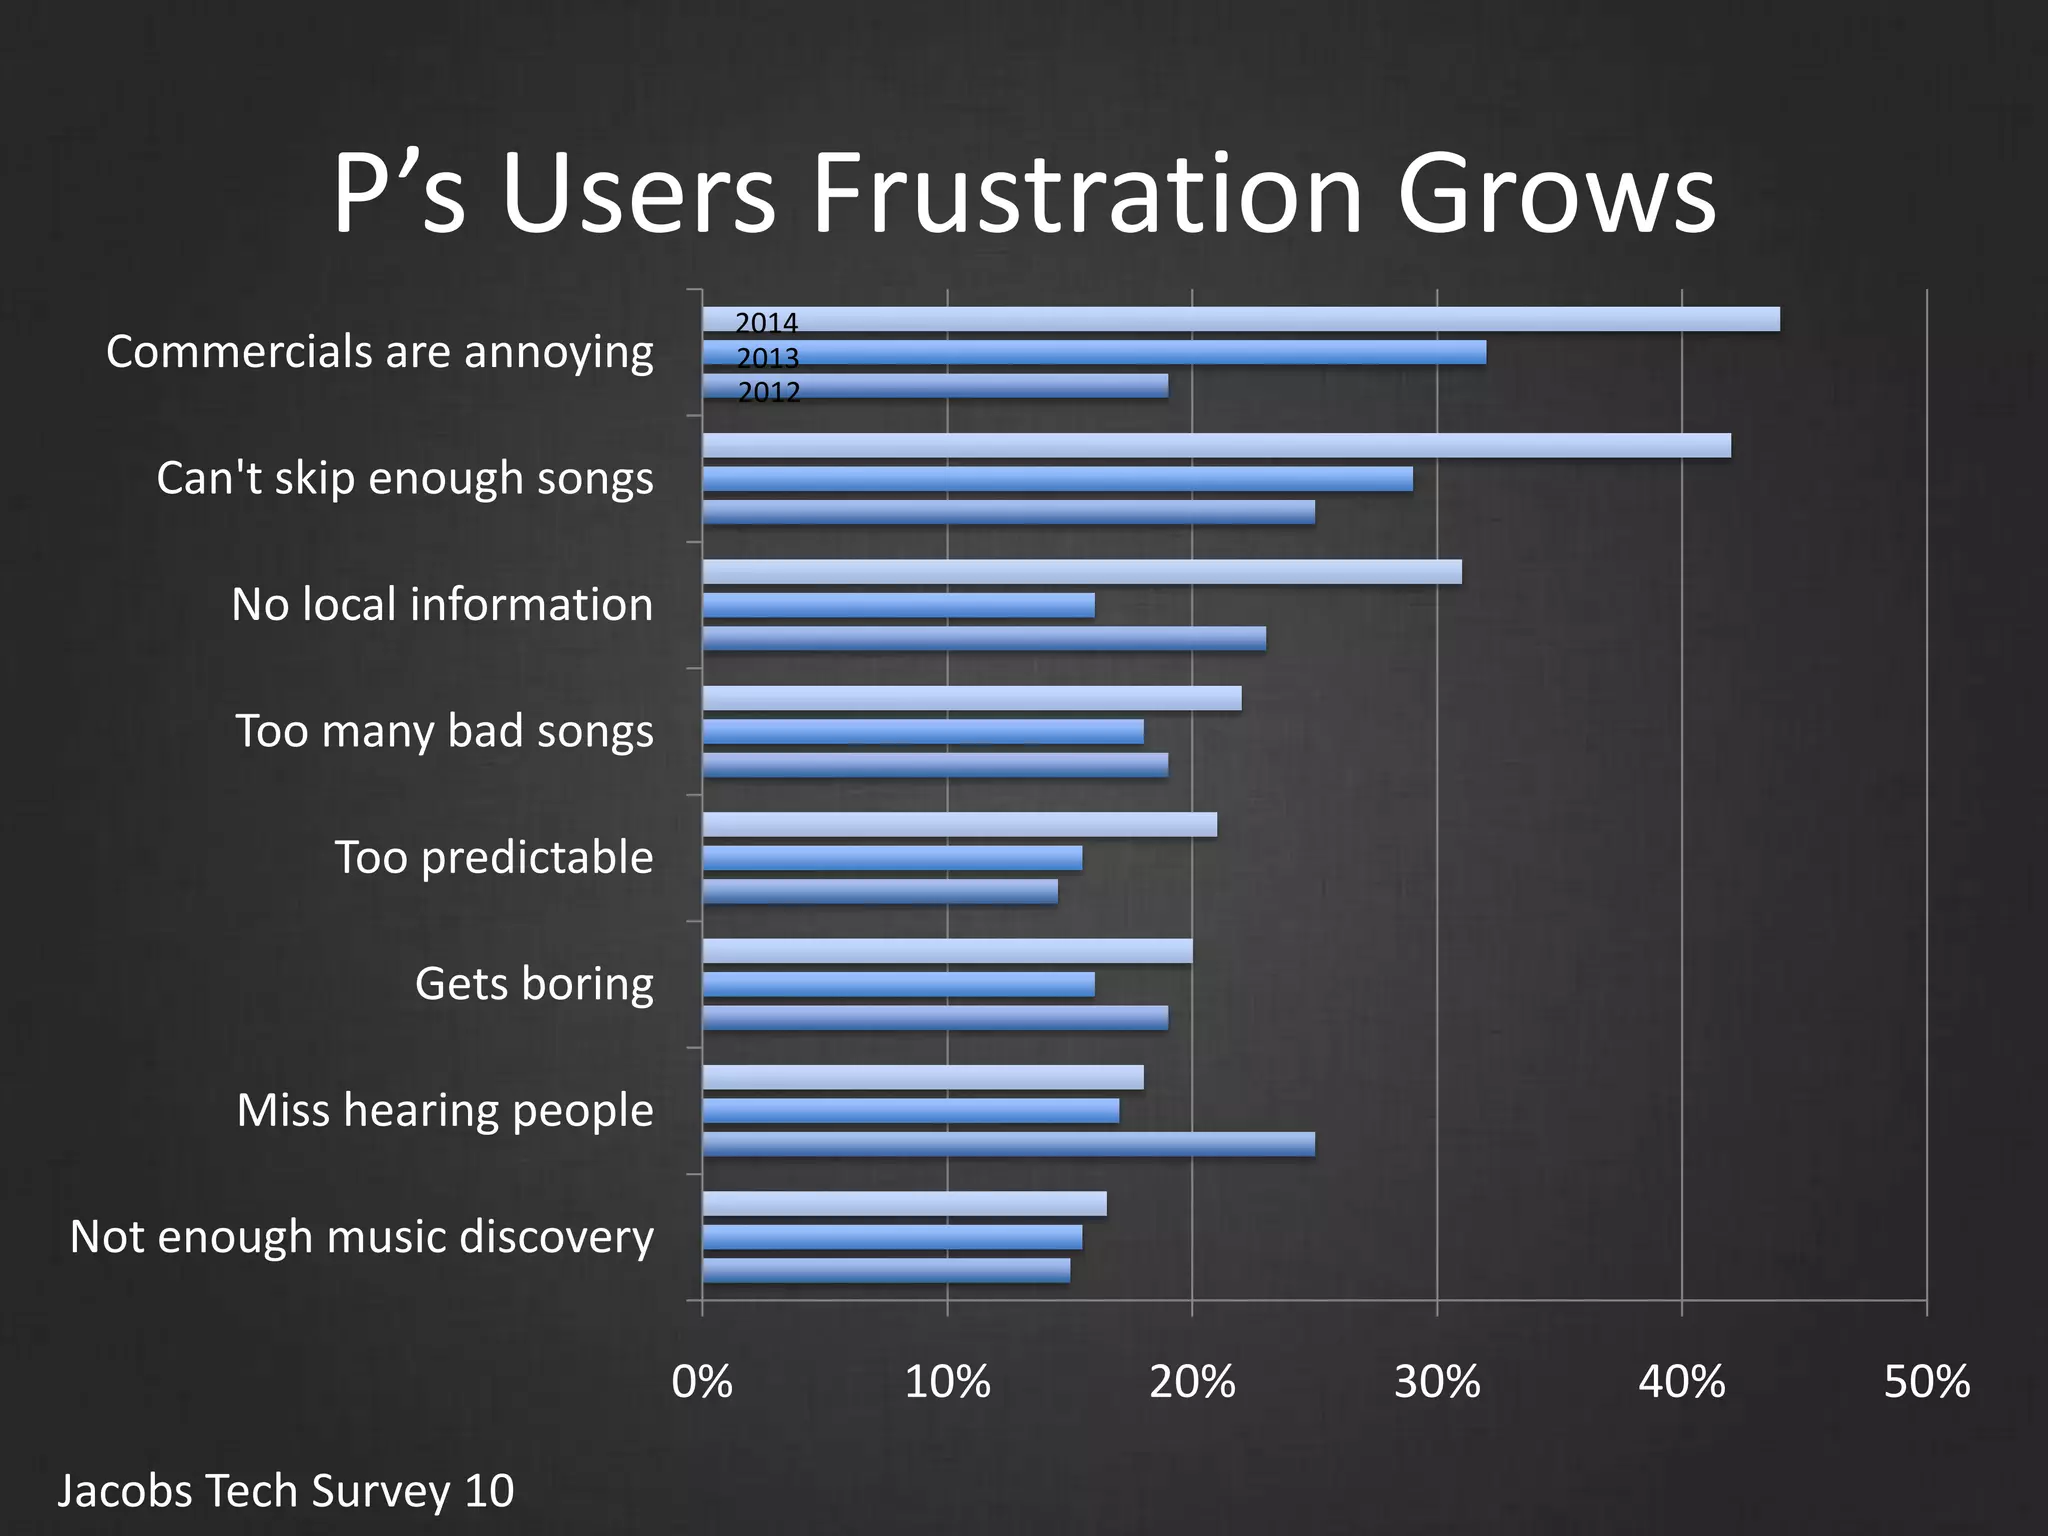
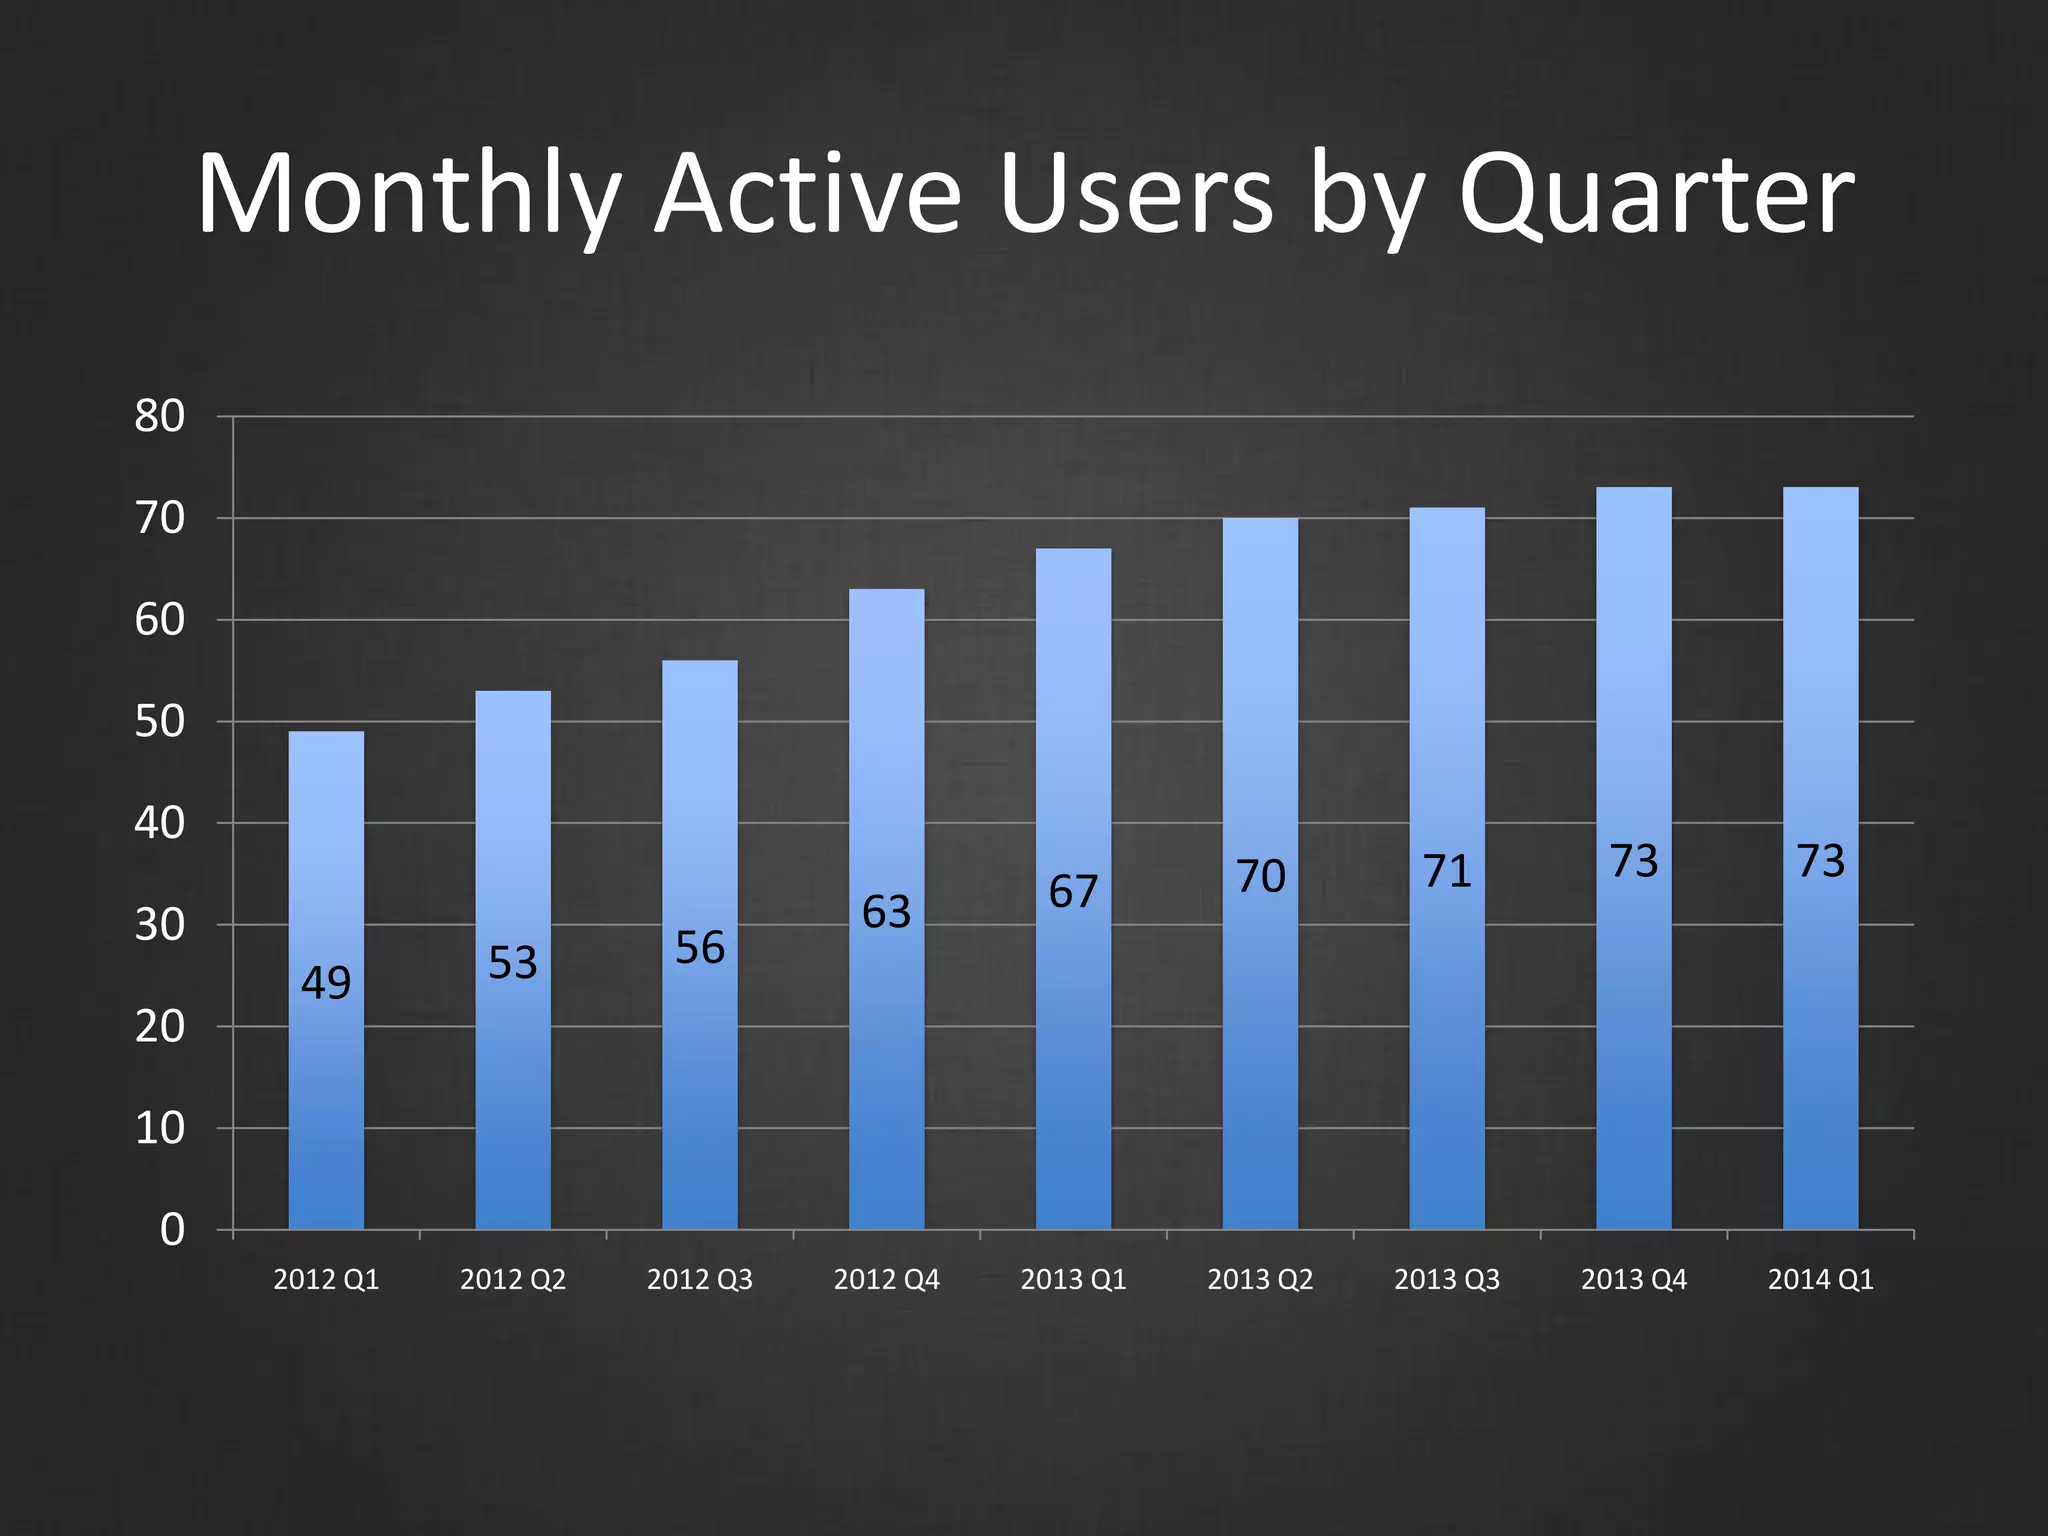
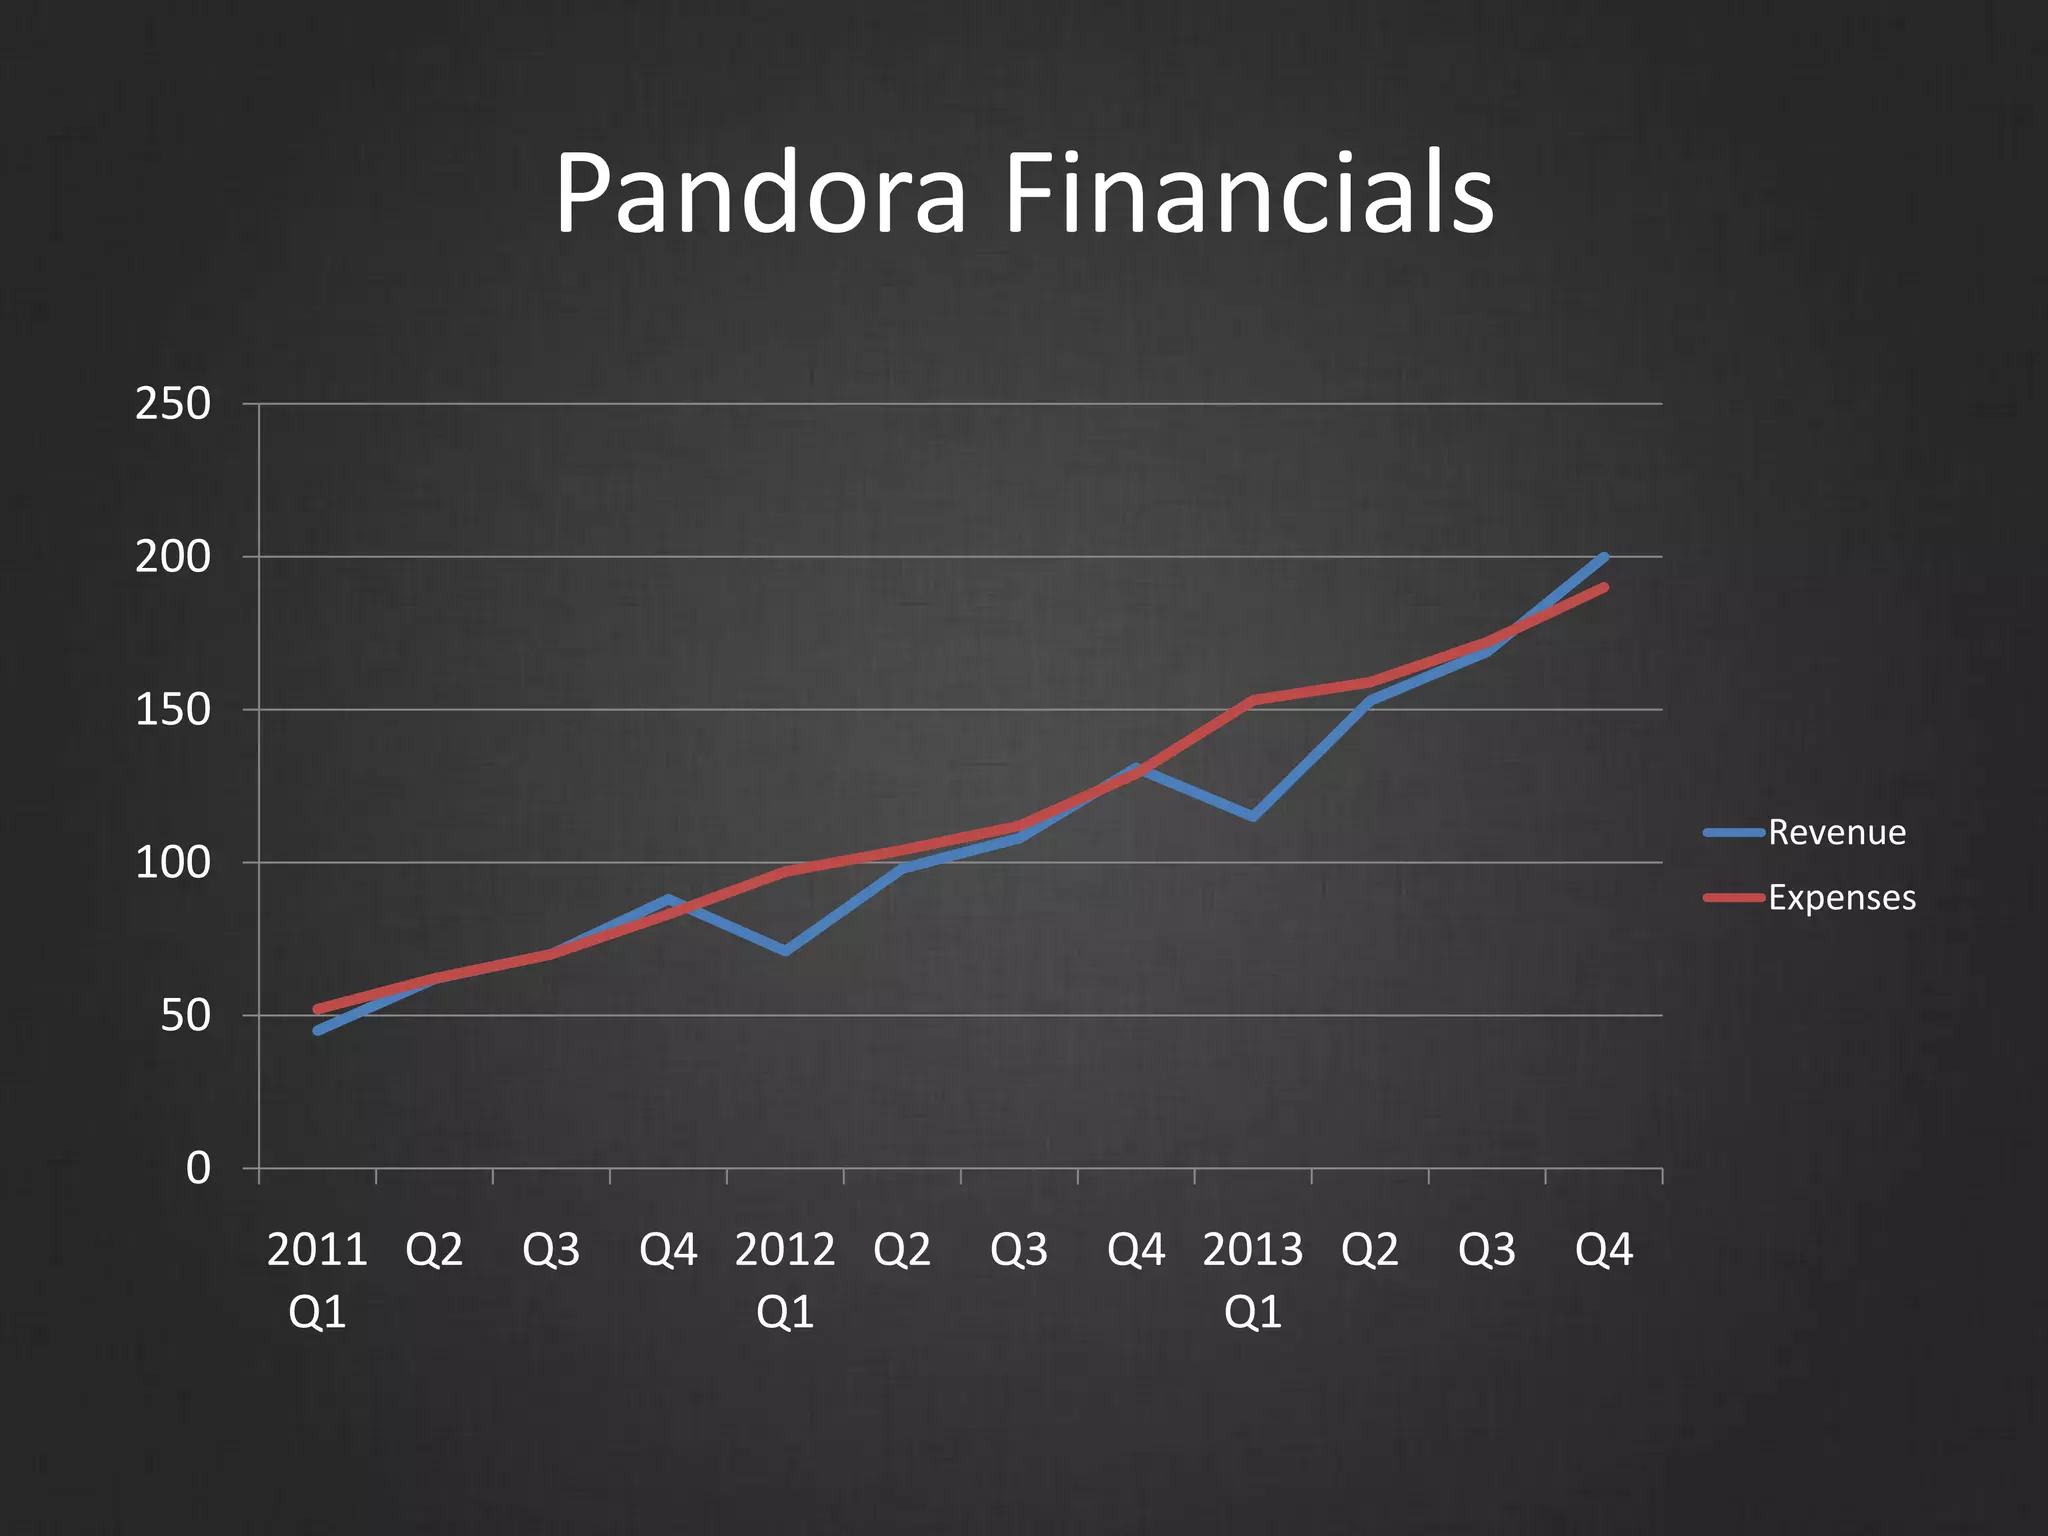
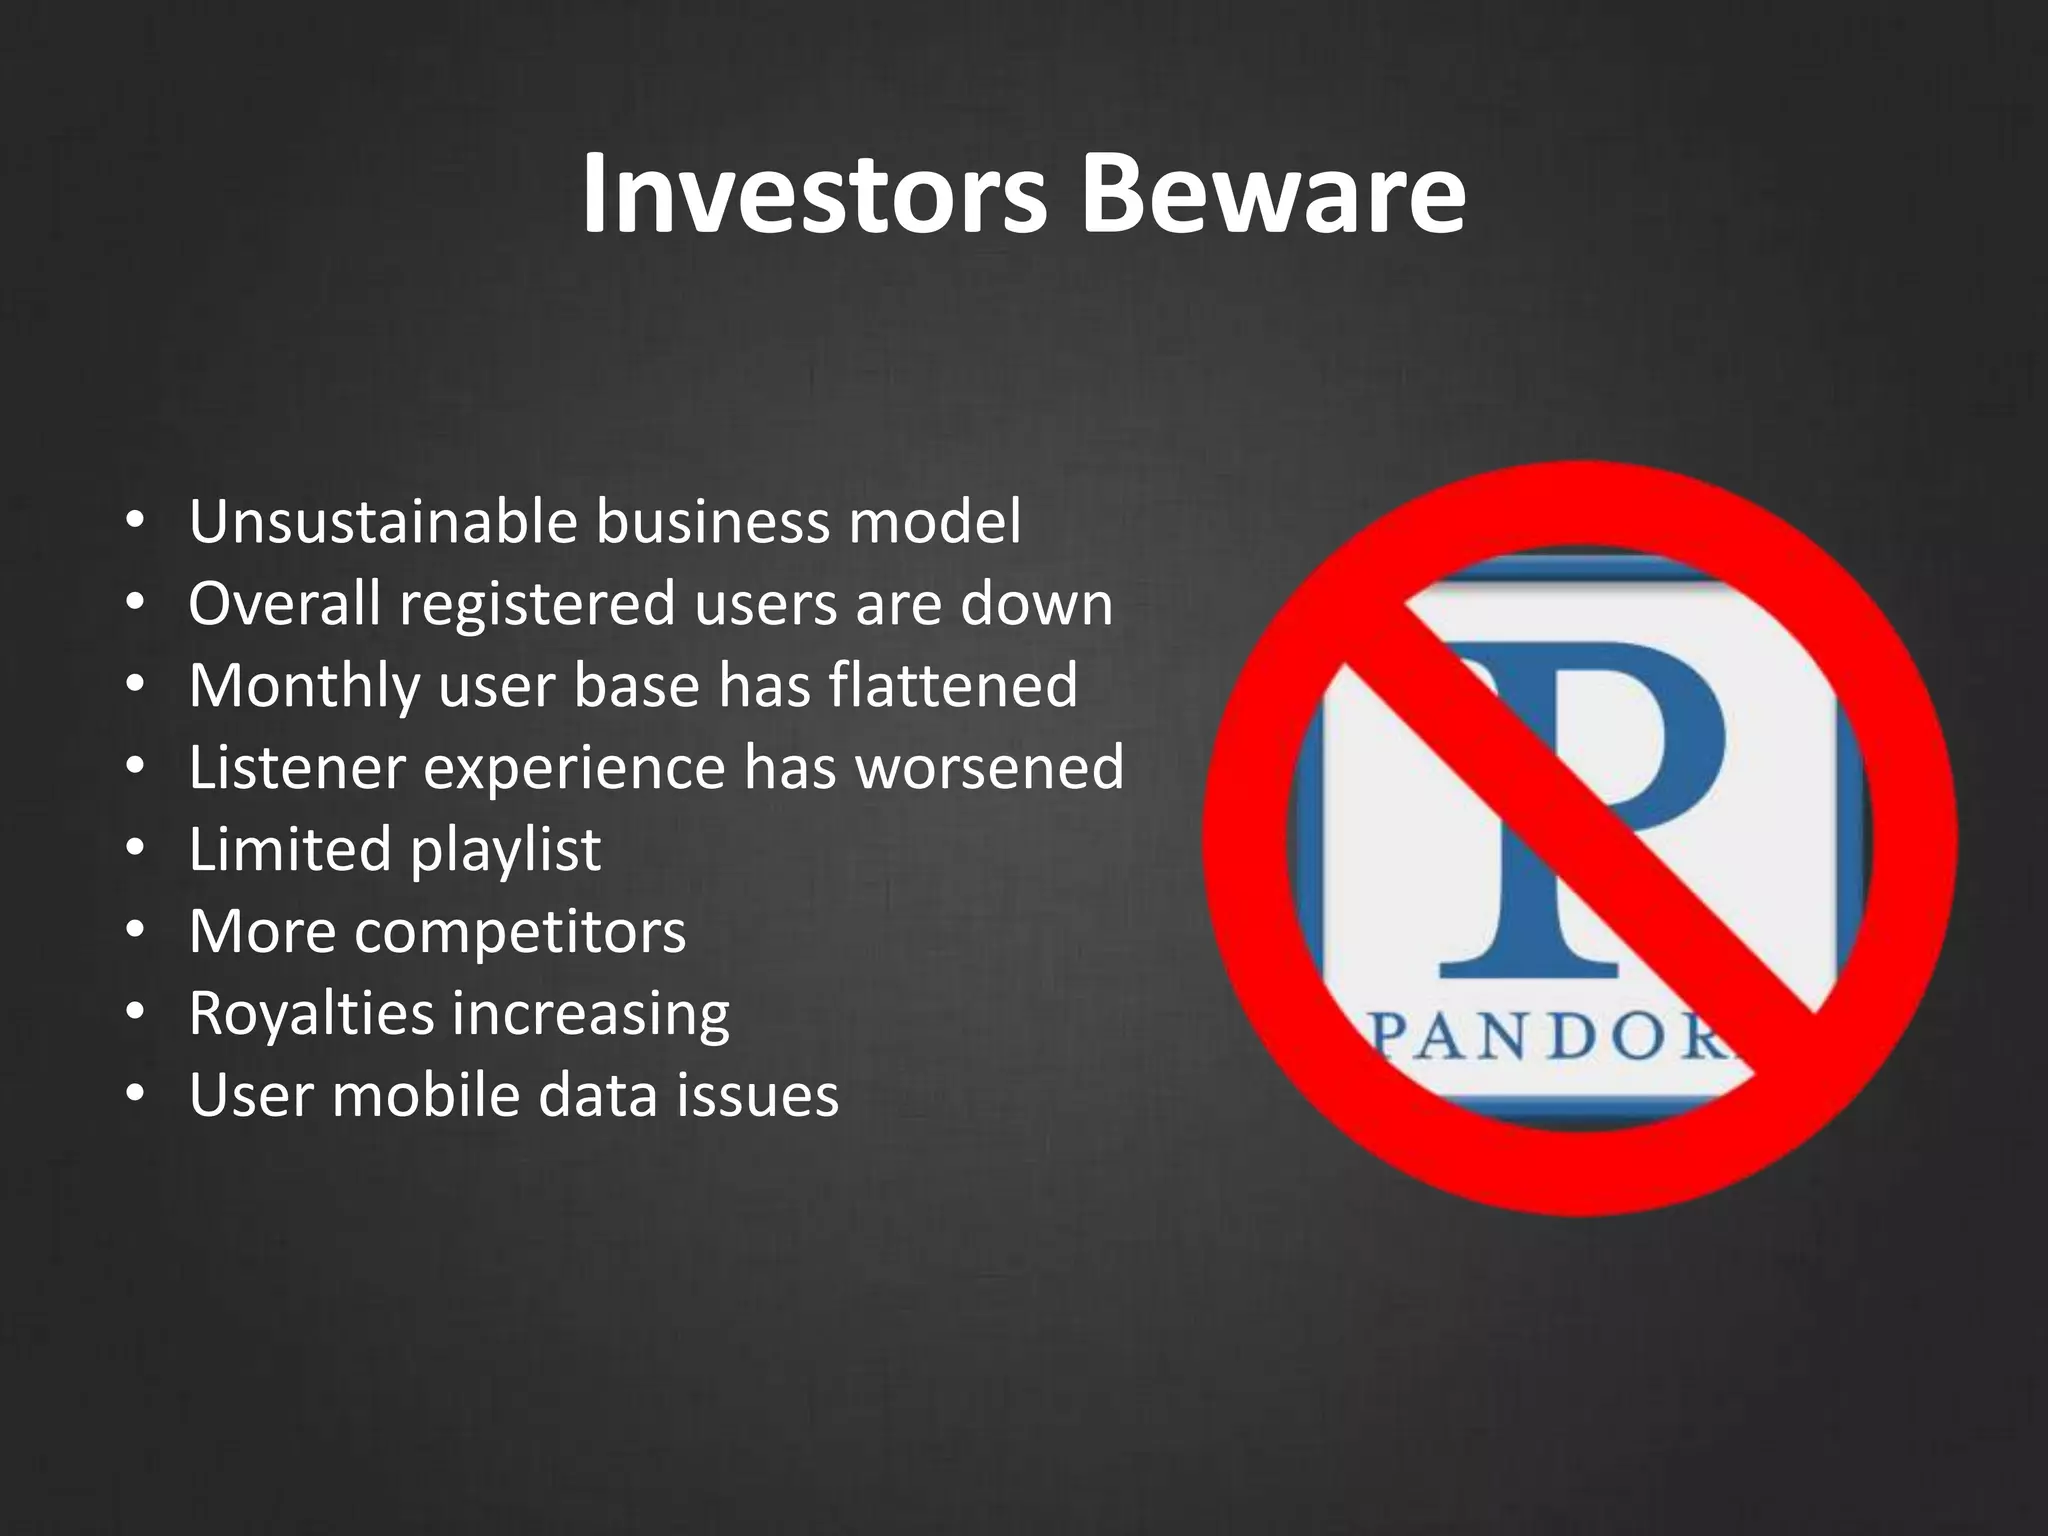
Evolution of the Audio Consumer & Advertiser
• Advances in tech expands listeners options
• Expansion of bandwidth and wireless services
• Advances in smartphone tech mobilize the internet
• As consumer options grow, advertiser’s options grow
• Seamless in dash experience
US Monthly Internet Radio Listeners, 2010-2016
93.1
112.9
132.6
147.3
159.6
169.3
176.5
2010 2011 2012 2013 2014 2015 2016
30%
36.10%
41.90%
46.10%
49.50%
52%
53.70%
% of population
Source: eMarketer, March 2012,confirmed and republished Aug 2012
Up
45%
AM/FM Local
Stations’
streaming
PurePlay
webcasters like
Pandora
Up
18%
Source:
Proxi Digital Audio Landscape: The Major Streamers
Triton monthly Webcast Metrics Top 20. AAS, M-F 6A-8P Domestic . % change August 2012 vs. August 2013
Internet Audio Usage is Growing
•109 million users
•AM/FM live radio
streams
•Delivering Local
Curated
Programming
AM/FM Publishers Continue
Impressive Growth VS. Pure Play
7.11%
0.59%
0.00%
1.00%
2.00%
3.00%
4.00%
5.00%
6.00%
7.00%
8.00%
AM/FM Streams Pure Play
January 2014 Average Active Sessions (AAS) Monday-Sunday 6a-Mid
P’s ad based strategy has been successful
• P has hired great radio
sales people
• With strong radio
client relationships
“We are targeting
radio ad dollars”
-Joe Kennedy
P’s ad based strategy has been successful
• Converted AAS to AQH
• Backend ease of
purchase
“We can offer SMB’s a better
return on investment in
terms of foot traffic & brand
awareness.”
- John Trimble
What Your Buyers Are Saying About “P”?
“Pandora provides
demographic
and geographic targeting”
“Easier to buy with a
conversion of AAS to AQH”
“Affordable and trackable”
“Pandora is the #1 station in
the Market”
“Good click through rates”
Pandora’s Progression
$283.00
$423.40
$598.60
$801.30
Pandora Revenues
2012 2013 2014 2015
$0.00
$100.00
$200.00
$300.00
$400.00
$500.00
$600.00
Web Ads Ad Insertion Subscriptions
Product Breakdown
2012 2013 2014 2015
Source: J.P. Morgan based on company reports
Pandora’s Net Loss by Year
-45
-40
-35
-30
-25
-20
-15
-10
-5
0
2010 2011 2012 2013
- $1.8M
- $1.6M
- $26.7M
- $40M
Pandora’s Market Valuation
0
1
2
3
4
5
6
7
8
2011 2012 2013
$2B $1.75B
$7.09B
SWOT Analysis of Pandora
Strengths
Accessibility
Free
Limited Interruptions vs terrestrial
First to market in pure play space
Strong sales force
More format variety
More variety inside each format
Opportunities
Lower royalty fees and expensive
175M registered users
75M monthly active users
Improving registration accuracy
Ask mobile users for location
Weaknesses
Registration
Prompting
IP address tracking
Increased interruptions
Limited growth
Inaccurate self serving metrics
Limited playlist
Unsustainable business model
Increased competition
Limited skipping ability
Threats
Terrestrial radio push back
Increased competition in pure play
Inaccurate data on users
Elevated commercial load
Expensive overhead – as they grow so do their
expenses disproportionally
Registration
• Privacy Concerns = Flawed Reg. Data
• Almost 9 in 10 users provide false or
incomplete information
• This creates issues with demo, gender, zip
code, and qualitative accuracy
• Reliability
Source: Blue Ink 88% of people who registered on the internet provide false or incomplete information citing privacy issues.
Are You Still Listening?
• Prompting occurs 1x an
hour on desktop (20%
of users)
• Prompting rarely
occurs/never occurs on
a mobile device
• Inaccurate hours spent
• Gross impressions
delivery
Where are you?
• Desktop IP addresses can be INACCURATE
• Reliability of registration process IS
INACCURATE
• Users rarely change cell phone #’s or area
codes when they move
• Cell data is inaccurate
AT&T = NORTHERN CALIFORNIA
SPRINT = KANSAS CITY
VERIZON = SOUTHERN CALIFORNIA
• Cell number portability has made area
code irrelevant
P’s Users Frustration Grows
0% 10% 20% 30% 40% 50%
Not enough music discovery
Miss hearing people
Gets boring
Too predictable
Too many bad songs
No local information
Can't skip enough songs
Commercials are annoying
2014
2013
2012
Jacobs Tech Survey 10
Monthly Active Users by Quarter
49 53 56
63 67 70 71 73 73
0
10
20
30
40
50
60
70
80
2012 Q1 2012 Q2 2012 Q3 2012 Q4 2013 Q1 2013 Q2 2013 Q3 2013 Q4 2014 Q1
Pandora Financials
0
50
100
150
200
250
2011
Q1
Q2 Q3 Q4 2012
Q1
Q2 Q3 Q4 2013
Q1
Q2 Q3 Q4
Revenue
Expenses
Investors Beware
• Unsustainable business model
• Overall registered users are down
• Monthly user base has flattened
• Listener experience has worsened
• Limited playlist
• More competitors
• Royalties increasing
• User mobile data issues

Selling against Pandora in 2014

  • 1.
    Evolution of theAudio Consumer & Advertiser
  • 2.
    • Advances intech expands listeners options • Expansion of bandwidth and wireless services • Advances in smartphone tech mobilize the internet • As consumer options grow, advertiser’s options grow • Seamless in dash experience
  • 3.
    US Monthly InternetRadio Listeners, 2010-2016 93.1 112.9 132.6 147.3 159.6 169.3 176.5 2010 2011 2012 2013 2014 2015 2016 30% 36.10% 41.90% 46.10% 49.50% 52% 53.70% % of population Source: eMarketer, March 2012,confirmed and republished Aug 2012
  • 4.
    Up 45% AM/FM Local Stations’ streaming PurePlay webcasters like Pandora Up 18% Source: ProxiDigital Audio Landscape: The Major Streamers Triton monthly Webcast Metrics Top 20. AAS, M-F 6A-8P Domestic . % change August 2012 vs. August 2013 Internet Audio Usage is Growing •109 million users •AM/FM live radio streams •Delivering Local Curated Programming
  • 5.
    AM/FM Publishers Continue ImpressiveGrowth VS. Pure Play 7.11% 0.59% 0.00% 1.00% 2.00% 3.00% 4.00% 5.00% 6.00% 7.00% 8.00% AM/FM Streams Pure Play January 2014 Average Active Sessions (AAS) Monday-Sunday 6a-Mid
  • 6.
    P’s ad basedstrategy has been successful • P has hired great radio sales people • With strong radio client relationships “We are targeting radio ad dollars” -Joe Kennedy
  • 7.
    P’s ad basedstrategy has been successful • Converted AAS to AQH • Backend ease of purchase “We can offer SMB’s a better return on investment in terms of foot traffic & brand awareness.” - John Trimble
  • 8.
    What Your BuyersAre Saying About “P”? “Pandora provides demographic and geographic targeting” “Easier to buy with a conversion of AAS to AQH” “Affordable and trackable” “Pandora is the #1 station in the Market” “Good click through rates”
  • 9.
    Pandora’s Progression $283.00 $423.40 $598.60 $801.30 Pandora Revenues 20122013 2014 2015 $0.00 $100.00 $200.00 $300.00 $400.00 $500.00 $600.00 Web Ads Ad Insertion Subscriptions Product Breakdown 2012 2013 2014 2015 Source: J.P. Morgan based on company reports
  • 10.
    Pandora’s Net Lossby Year -45 -40 -35 -30 -25 -20 -15 -10 -5 0 2010 2011 2012 2013 - $1.8M - $1.6M - $26.7M - $40M
  • 11.
  • 12.
    SWOT Analysis ofPandora Strengths Accessibility Free Limited Interruptions vs terrestrial First to market in pure play space Strong sales force More format variety More variety inside each format Opportunities Lower royalty fees and expensive 175M registered users 75M monthly active users Improving registration accuracy Ask mobile users for location Weaknesses Registration Prompting IP address tracking Increased interruptions Limited growth Inaccurate self serving metrics Limited playlist Unsustainable business model Increased competition Limited skipping ability Threats Terrestrial radio push back Increased competition in pure play Inaccurate data on users Elevated commercial load Expensive overhead – as they grow so do their expenses disproportionally
  • 13.
    Registration • Privacy Concerns= Flawed Reg. Data • Almost 9 in 10 users provide false or incomplete information • This creates issues with demo, gender, zip code, and qualitative accuracy • Reliability Source: Blue Ink 88% of people who registered on the internet provide false or incomplete information citing privacy issues.
  • 14.
    Are You StillListening? • Prompting occurs 1x an hour on desktop (20% of users) • Prompting rarely occurs/never occurs on a mobile device • Inaccurate hours spent • Gross impressions delivery
  • 15.
    Where are you? •Desktop IP addresses can be INACCURATE • Reliability of registration process IS INACCURATE • Users rarely change cell phone #’s or area codes when they move • Cell data is inaccurate AT&T = NORTHERN CALIFORNIA SPRINT = KANSAS CITY VERIZON = SOUTHERN CALIFORNIA • Cell number portability has made area code irrelevant
  • 16.
    P’s Users FrustrationGrows 0% 10% 20% 30% 40% 50% Not enough music discovery Miss hearing people Gets boring Too predictable Too many bad songs No local information Can't skip enough songs Commercials are annoying 2014 2013 2012 Jacobs Tech Survey 10
  • 17.
    Monthly Active Usersby Quarter 49 53 56 63 67 70 71 73 73 0 10 20 30 40 50 60 70 80 2012 Q1 2012 Q2 2012 Q3 2012 Q4 2013 Q1 2013 Q2 2013 Q3 2013 Q4 2014 Q1
  • 18.
    Pandora Financials 0 50 100 150 200 250 2011 Q1 Q2 Q3Q4 2012 Q1 Q2 Q3 Q4 2013 Q1 Q2 Q3 Q4 Revenue Expenses
  • 19.
    Investors Beware • Unsustainablebusiness model • Overall registered users are down • Monthly user base has flattened • Listener experience has worsened • Limited playlist • More competitors • Royalties increasing • User mobile data issues