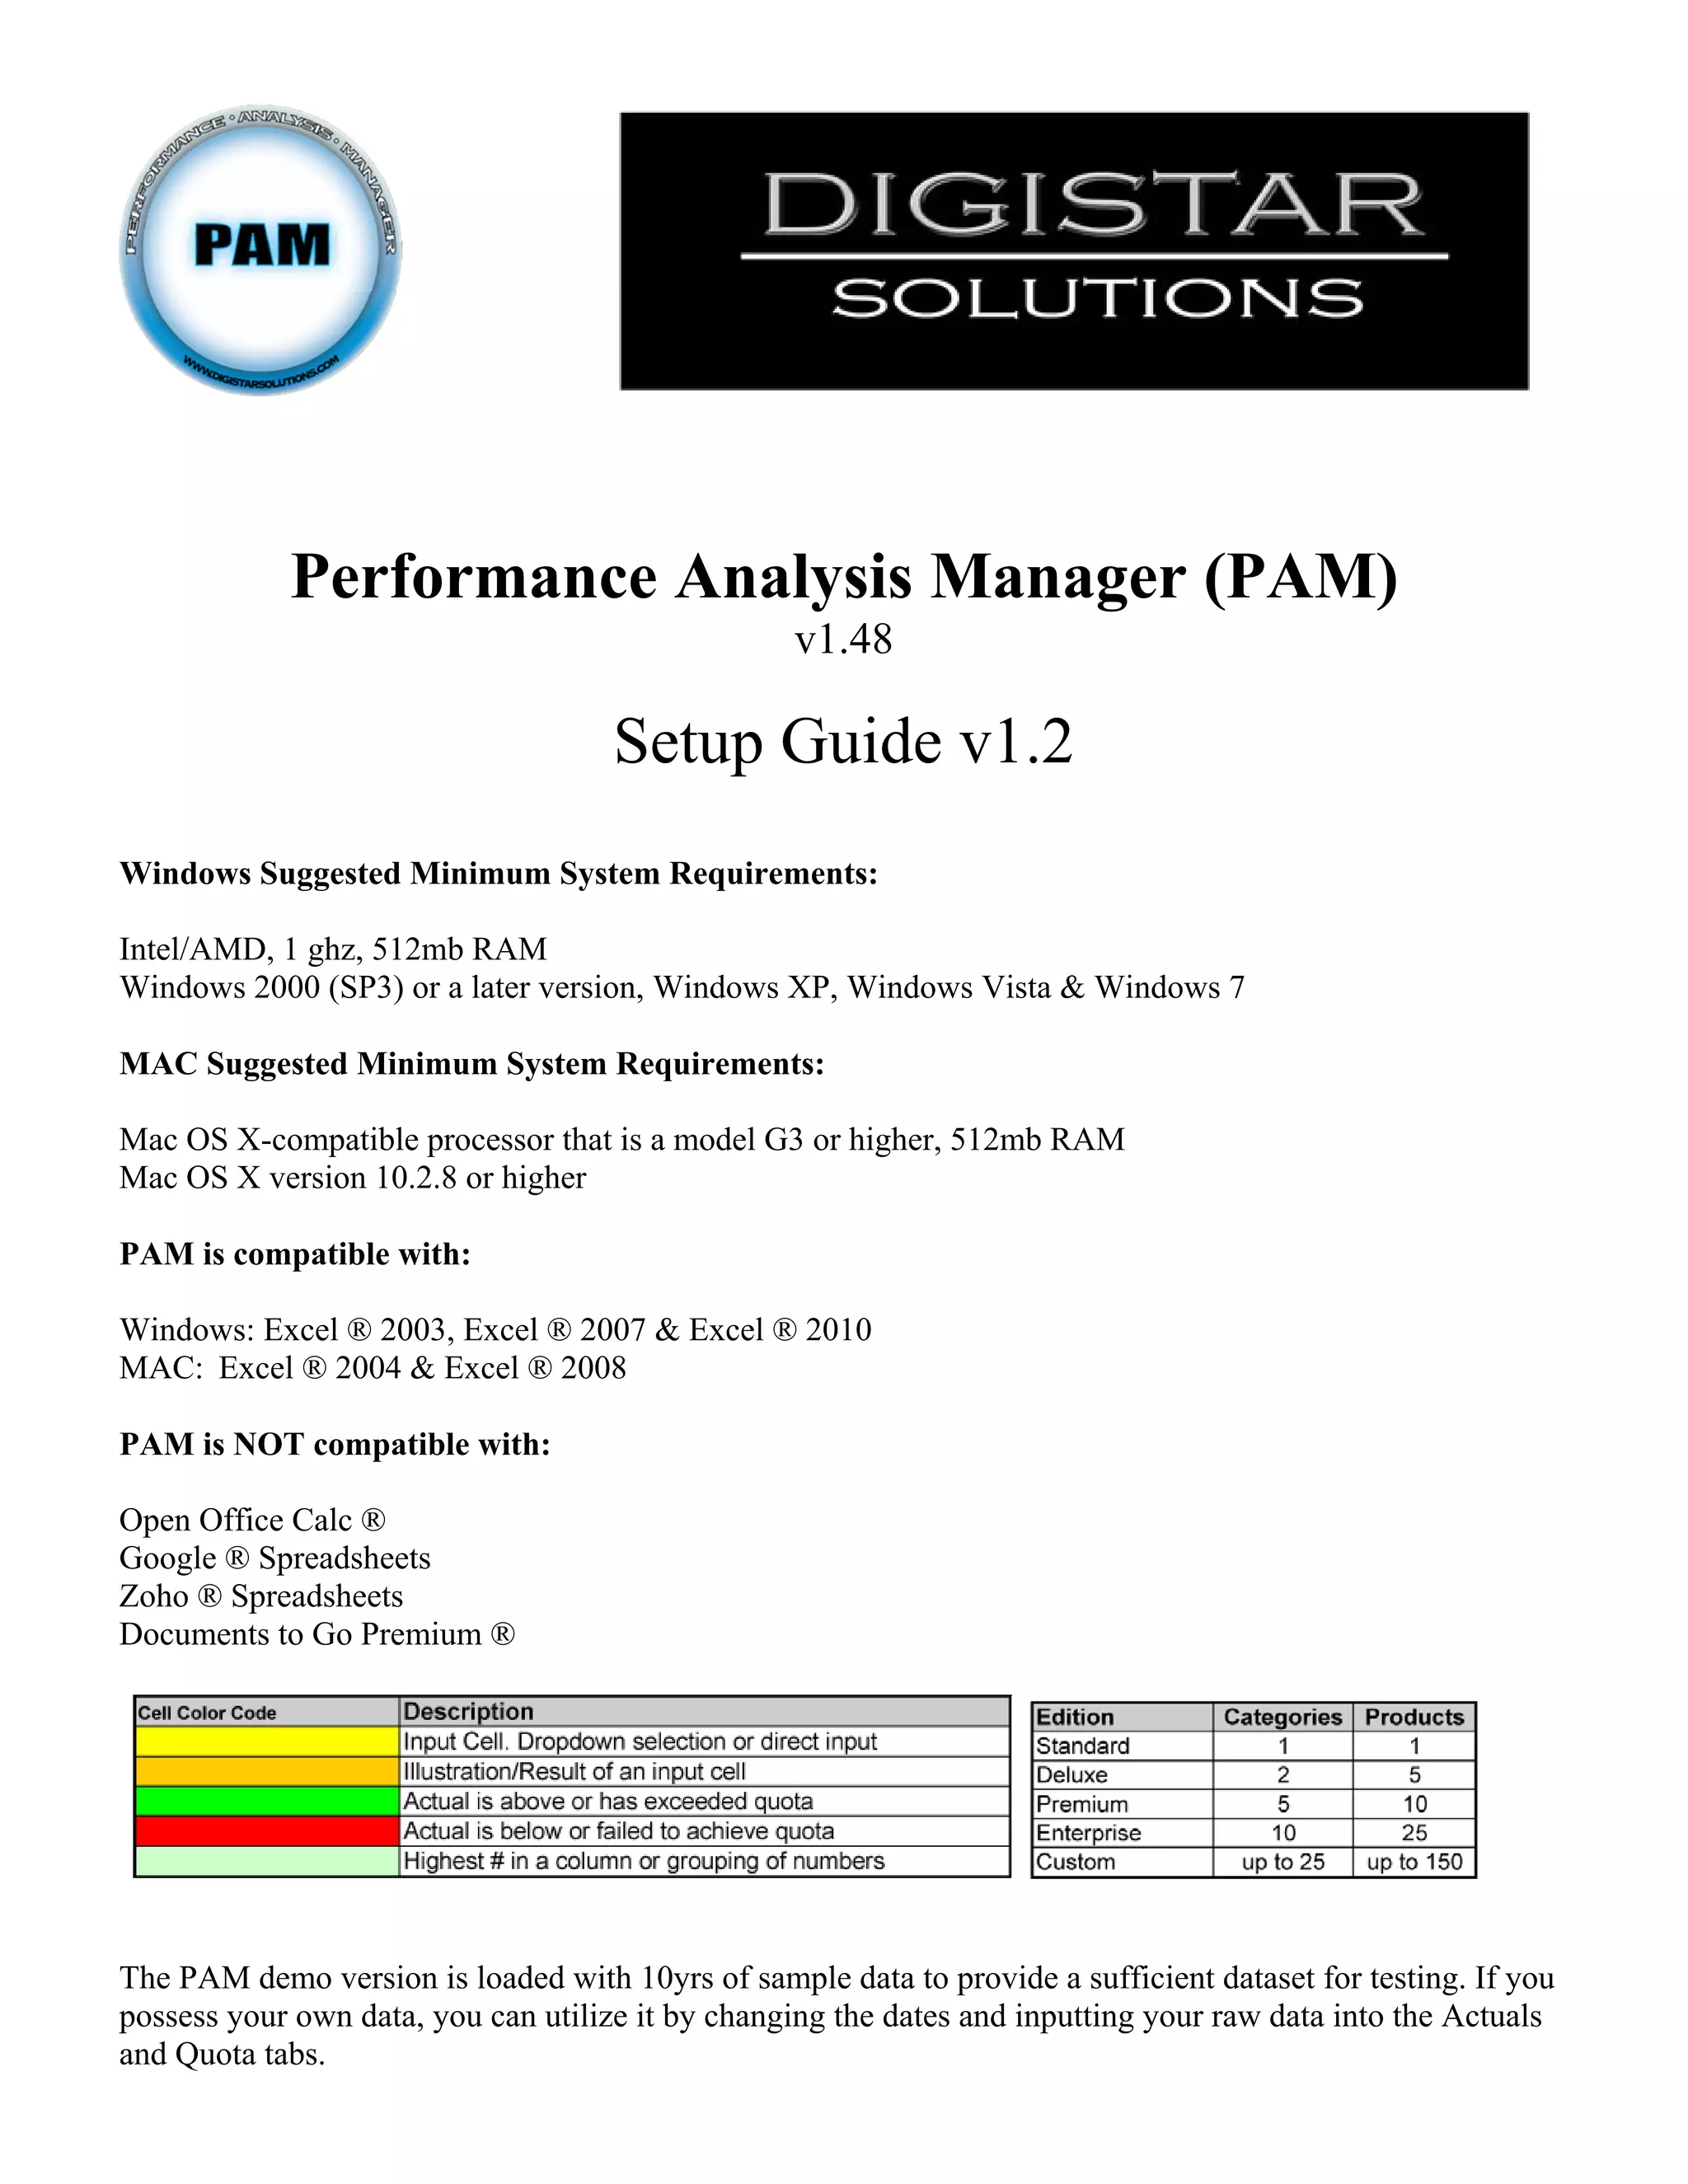
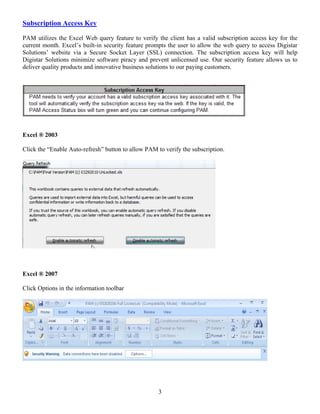
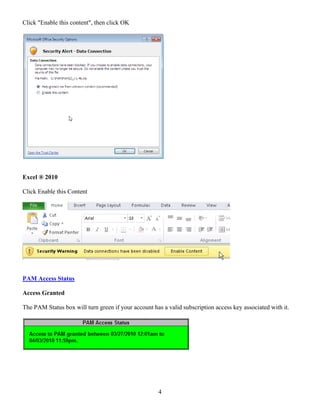
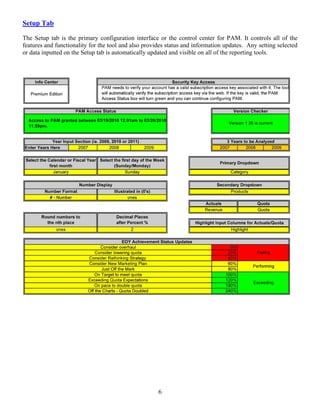
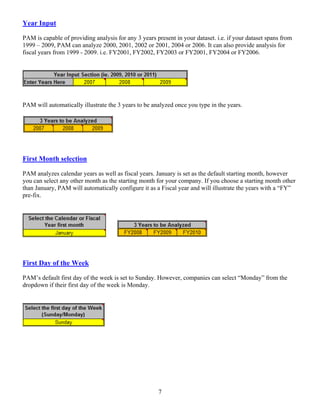
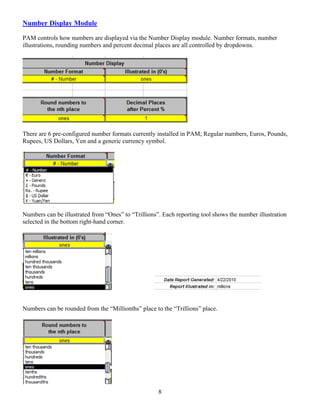
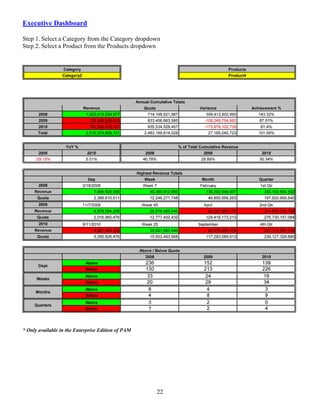
Performance Analysis Manager (PAM)
                                                  v1.48

                                     Setup Guide v1.2
Windows Suggested Minimum System Requirements:

Intel/AMD, 1 ghz, 512mb RAM
Windows 2000 (SP3) or a later version, Windows XP, Windows Vista & Windows 7

MAC Suggested Minimum System Requirements:

Mac OS X-compatible processor that is a model G3 or higher, 512mb RAM
Mac OS X version 10.2.8 or higher

PAM is compatible with:

Windows: Excel ® 2003, Excel ® 2007 & Excel ® 2010
MAC: Excel ® 2004 & Excel ® 2008

PAM is NOT compatible with:

Open Office Calc ®
Google ® Spreadsheets
Zoho ® Spreadsheets
Documents to Go Premium ®


The PAM demo version is loaded with 10yrs of sample data to provide a sufficient dataset for testing. If you
possess your own data, you can utilize it by changing the dates and inputting your raw data into the Actuals
and Quota tabs.
Table of Contents

I.     PAM Security
       a. Subscription Access Key (pg 3)
              i. 2003 (pg 3)
             ii. 2007 (pg 3)
            iii. 2010 (pg 4)
       b. PAM Access Status (pg 4)
              i. Access Granted (pg 4)
             ii. Access Denied (pg 5)
II.    Data Input (pg 5)
III.   Setup Tab (pg 6)
       a. Year Input (pg 7)
       b. First Month Selection (pg 7)
       c. First Day of the Week (pg 7)
       d. Number Display Module (pg 8)
       e. Field Names Input (pg 9)
       f. EOY Achievement Status Updates (pg 10)
IV.    Calculation (pg 10)
       a. Calculating status (pg 10)
       b. Automatic Calculation Verification (pg 11)
              i. Windows
                    1. Excel ® 2003 (pg 11)
                    2. Excel ® 2007 (pg 12)
                    3. Excel ® 2010 (pg 13)
             ii. MAC
                    1. Excel ® 2004/2008 (pg 14)
       c. Manual Calculation (pg 15)
V.     Report Modules (pg 16)
       a. Daily Trend Analyzer (pg 16)
       b. Weekly Trend Analyzer (pg 17)
       c. Monthly Trend Analyzer (pg 18)
       d. Multi Comparison Utility (pg 19)
       e. Monthly Calendar View (pg 20)
       f. Annual Calendar View (pg 21)
       g. Executive Dashboard (pg 22)


                                           2
Subscription Access Key

PAM utilizes the Excel Web query feature to verify the client has a valid subscription access key for the
current month. Excel’s built-in security feature prompts the user to allow the web query to access Digistar
Solutions’ website via a Secure Socket Layer (SSL) connection. The subscription access key will help
Digistar Solutions minimize software piracy and prevent unlicensed use. Our security feature allows us to
deliver quality products and innovative business solutions to our paying customers.


Excel ® 2003

Click the “Enable Auto-refresh” button to allow PAM to verify the subscription.


Excel ® 2007

Click Options in the information toolbar


                                                     3
Click "Enable this content", then click OK


Excel ® 2010

Click Enable this Content


PAM Access Status

Access Granted

The PAM Status box will turn green if your account has a valid subscription access key associated with it.


                                                      4
Access Denied

The PAM Status box will turn red if your account does NOT have a valid subscription access key associated
with it.


Data Input

Raw data can be copied and pasted or manually entered directly into the cells on the Actuals and Quota tabs.
You are not required to pre-format the data prior to inputting it into PAM. Formatting will be controlled via
the Number Display module on the Setup tab.


                                                      5
Setup Tab

The Setup tab is the primary configuration interface or the control center for PAM. It controls all of the
features and functionality for the tool and also provides status and information updates. Any setting selected
or data inputted on the Setup tab is automatically updated and visible on all of the reporting tools.


                                                      6
Year Input

PAM is capable of providing analysis for any 3 years present in your dataset. i.e. if your dataset spans from
1999 – 2009, PAM can analyze 2000, 2001, 2002 or 2001, 2004 or 2006. It can also provide analysis for
fiscal years from 1999 - 2009. i.e. FY2001, FY2002, FY2003 or FY2001, FY2004 or FY2006.


PAM will automatically illustrate the 3 years to be analyzed once you type in the years.


First Month selection

PAM analyzes calendar years as well as fiscal years. January is set as the default starting month, however
you can select any other month as the starting month for your company. If you choose a starting month other
than January, PAM will automatically configure it as a Fiscal year and will illustrate the years with a “FY”
pre-fix.


First Day of the Week

PAM’s default first day of the week is set to Sunday. However, companies can select “Monday” from the
dropdown if their first day of the week is Monday.


                                                      7
Number Display Module

PAM controls how numbers are displayed via the Number Display module. Number formats, number
illustrations, rounding numbers and percent decimal places are all controlled by dropdowns.


There are 6 pre-configured number formats currently installed in PAM; Regular numbers, Euros, Pounds,
Rupees, US Dollars, Yen and a generic currency symbol.


Numbers can be illustrated from “Ones” to “Trillions”. Each reporting tool shows the number illustration
selected in the bottom right-hand corner.


Numbers can be rounded from the “Millionths” place to the “Trillions” place.


                                                     8
Percents can be shown with no decimals or up to 6 decimals. i.e. 76%, 76.234% or 76.234764%


Field Names Input

The field names for the Primary and Secondary dropdowns can also be modified. The Primary dropdown is
the name of the grouping or the category of products, services, salespeople, etc. being analyzed. The
Secondary dropdown is the name of the list of products, services, salespeople, etc. being analyzed. The
Actuals field is the name of the metric being analyzed. i.e. Revenue, Sales, Downloads, Households, etc. The
Quota field is the name of the metric being measured against or compared to. i.e. Quota, Goal, Target,
Budget, etc.


If you select “Highlight”, PAM will indicate the columns available for data input on the Actuals and Quota
tabs. The number of yellow highlighted columns will vary depending on the edition of PAM you are using or
if you have purchased additional categories or products.


                                                     9
End of Year Achievement Status


The EOY Achievement Status Advisor is an advanced feature found on the Monthly Trend Analyzer in the
Premium Edition of PAM. It utilizes the historical data of the selected item to determine or forecast the
likelihood of reaching the EOY Quota. The EOY Achievement Status phrases can be modified to match your
company’s standard reporting terminology.


Calculation


PAM's dynamic calculation functionality depends on automatic calculation being enabled in Excel ®.
Without it, PAM’s advanced calculations and analysis will not function or operate correctly.

Calculating Status


Depending on the speed and processing power of your computer, you may see “Calculating” or “Calculating
Cells” while your computer is crunching numbers. Once your computer is finished calculating, you can
proceed to the next dropdown. i.e. After you select a Category from the Primary dropdown, you may have to
wait a couple of seconds before the Secondary dropdown is updated and ready.


                                                   10
Automatic Calculation

Please verify your Automatic Calculation settings by following the instructions below.


In Excel ® 2003

Click on Tools, then Options.


Click on the Calculation tab at the top. Ensure “Automatic” is selected. Then click OK.


                                                     11
In Excel ® 2007

Click the Microsoft Office Button.


Click the Excel Options button at the bottom


Click on Formulas and verify "Automatic" under Workbook Calculations is selected. Click OK


                                                  12
In Excel ® 2010


Click on File


Click on Options


                   13
Click on Formulas in the left navigation pane. Verify Automatic is selected. Click OK


In Excel ® 2004 / 2008 for the MAC.

Click the Excel menu, then click Preferences.


                                                    14
On the Preferences window, click Calculation. Verify Automatic is selected then click OK.


Manual Calculation


At times, you may need to invoke or force Excel ® to do a manual calculation.

In Windows versions:
Press the F9 key

In MAC versions:


                                                    15
Daily Trend Analyzer

Step 1. Select the Year, Month and Day
Step 2. Select a Category from the Category dropdown
Step 3. Select a Product from the Products dropdown


*     The Daily Above/Below Quota is only available in the Deluxe, Premium & Enterprise Editions of PAM
**    The APS – Automated Performance Summary is only available in the Enterprise Edition of PAM
***   The Daily Average Needed to Obtain the EOY Quota is only available in the Premium & Enterprise Editions of PAM


                                                          16
Weekly Trend Analyzer

Step 1. Select the Year and Week Ending Date
Step 2. Select a Category from the Category dropdown
Step 3. Select a Product from the Products dropdown


*     The Weekly Above/Below Quota is only available in the Deluxe, Premium & Enterprise Editions of PAM
**    The APS – Automated Performance Summary is only available in the Enterprise Edition of PAM
***   The Weekly Average Needed to Obtain the EOY Quota is only available in the Premium & Enterprise Editions of PAM


                                                          17
Monthly Trend Analyzer

Step 1. Select the Month-Year combination
Step 2. Select a Category from the Category dropdown
Step 3. Select a Product from the Products dropdown


*      The Monthly Above/Below Quota is only available in the Deluxe, Premium & Enterprise Editions of PAM
**     The APS – Automated Performance Summary is only available in the Enterprise Edition of PAM
***    The Average Needed to Obtain the EOY Quota is only available in the Premium & Enterprise Editions of PAM
****   The EOY Quota Advisor is only available in the Enterprise Edition of PAM


                                                           18
Multi Comparison Utility

Step 1. Select the Year
Step 2. Select a Category from the Category dropdown
Step 3. Select a Product from the Products dropdown

Repeat Steps 1 – 3 for each additional item you would like to compare.


*    The Multi Comparison Utility is only available in the Enterprise Edition of PAM
**   The APS – Automated Performance Summary is only available in the Enterprise Edition of PAM


                                                        19
Monthly Calendar View

Step 1. Select the Month-Year Combination
Step 2. Select a Category from the Category dropdown
Step 3. Select a Product from the Products dropdown


* Only available in the Enterprise Edition of PAM


                                                    20
Annual Calendar View

Step 1. Select a Category from the Category dropdown
Step 2. Select a Product from the Products dropdown


* Only available in the Enterprise Edition of PAM


                                                    21
Executive Dashboard

Step 1. Select a Category from the Category dropdown
Step 2. Select a Product from the Products dropdown


* Only available in the Enterprise Edition of PAM


                                                    22

PAM Setup Guide v1.2

  • 1.
    Performance Analysis Manager(PAM) v1.48 Setup Guide v1.2 Windows Suggested Minimum System Requirements: Intel/AMD, 1 ghz, 512mb RAM Windows 2000 (SP3) or a later version, Windows XP, Windows Vista & Windows 7 MAC Suggested Minimum System Requirements: Mac OS X-compatible processor that is a model G3 or higher, 512mb RAM Mac OS X version 10.2.8 or higher PAM is compatible with: Windows: Excel ® 2003, Excel ® 2007 & Excel ® 2010 MAC: Excel ® 2004 & Excel ® 2008 PAM is NOT compatible with: Open Office Calc ® Google ® Spreadsheets Zoho ® Spreadsheets Documents to Go Premium ® The PAM demo version is loaded with 10yrs of sample data to provide a sufficient dataset for testing. If you possess your own data, you can utilize it by changing the dates and inputting your raw data into the Actuals and Quota tabs.
  • 2.
    Table of Contents I. PAM Security a. Subscription Access Key (pg 3) i. 2003 (pg 3) ii. 2007 (pg 3) iii. 2010 (pg 4) b. PAM Access Status (pg 4) i. Access Granted (pg 4) ii. Access Denied (pg 5) II. Data Input (pg 5) III. Setup Tab (pg 6) a. Year Input (pg 7) b. First Month Selection (pg 7) c. First Day of the Week (pg 7) d. Number Display Module (pg 8) e. Field Names Input (pg 9) f. EOY Achievement Status Updates (pg 10) IV. Calculation (pg 10) a. Calculating status (pg 10) b. Automatic Calculation Verification (pg 11) i. Windows 1. Excel ® 2003 (pg 11) 2. Excel ® 2007 (pg 12) 3. Excel ® 2010 (pg 13) ii. MAC 1. Excel ® 2004/2008 (pg 14) c. Manual Calculation (pg 15) V. Report Modules (pg 16) a. Daily Trend Analyzer (pg 16) b. Weekly Trend Analyzer (pg 17) c. Monthly Trend Analyzer (pg 18) d. Multi Comparison Utility (pg 19) e. Monthly Calendar View (pg 20) f. Annual Calendar View (pg 21) g. Executive Dashboard (pg 22) 2
  • 3.
    Subscription Access Key PAMutilizes the Excel Web query feature to verify the client has a valid subscription access key for the current month. Excel’s built-in security feature prompts the user to allow the web query to access Digistar Solutions’ website via a Secure Socket Layer (SSL) connection. The subscription access key will help Digistar Solutions minimize software piracy and prevent unlicensed use. Our security feature allows us to deliver quality products and innovative business solutions to our paying customers. Excel ® 2003 Click the “Enable Auto-refresh” button to allow PAM to verify the subscription. Excel ® 2007 Click Options in the information toolbar 3
  • 4.
    Click "Enable thiscontent", then click OK Excel ® 2010 Click Enable this Content PAM Access Status Access Granted The PAM Status box will turn green if your account has a valid subscription access key associated with it. 4
  • 5.
    Access Denied The PAMStatus box will turn red if your account does NOT have a valid subscription access key associated with it. Data Input Raw data can be copied and pasted or manually entered directly into the cells on the Actuals and Quota tabs. You are not required to pre-format the data prior to inputting it into PAM. Formatting will be controlled via the Number Display module on the Setup tab. 5
  • 6.
    Setup Tab The Setuptab is the primary configuration interface or the control center for PAM. It controls all of the features and functionality for the tool and also provides status and information updates. Any setting selected or data inputted on the Setup tab is automatically updated and visible on all of the reporting tools. 6
  • 7.
    Year Input PAM iscapable of providing analysis for any 3 years present in your dataset. i.e. if your dataset spans from 1999 – 2009, PAM can analyze 2000, 2001, 2002 or 2001, 2004 or 2006. It can also provide analysis for fiscal years from 1999 - 2009. i.e. FY2001, FY2002, FY2003 or FY2001, FY2004 or FY2006. PAM will automatically illustrate the 3 years to be analyzed once you type in the years. First Month selection PAM analyzes calendar years as well as fiscal years. January is set as the default starting month, however you can select any other month as the starting month for your company. If you choose a starting month other than January, PAM will automatically configure it as a Fiscal year and will illustrate the years with a “FY” pre-fix. First Day of the Week PAM’s default first day of the week is set to Sunday. However, companies can select “Monday” from the dropdown if their first day of the week is Monday. 7
  • 8.
    Number Display Module PAMcontrols how numbers are displayed via the Number Display module. Number formats, number illustrations, rounding numbers and percent decimal places are all controlled by dropdowns. There are 6 pre-configured number formats currently installed in PAM; Regular numbers, Euros, Pounds, Rupees, US Dollars, Yen and a generic currency symbol. Numbers can be illustrated from “Ones” to “Trillions”. Each reporting tool shows the number illustration selected in the bottom right-hand corner. Numbers can be rounded from the “Millionths” place to the “Trillions” place. 8
  • 9.
    Percents can beshown with no decimals or up to 6 decimals. i.e. 76%, 76.234% or 76.234764% Field Names Input The field names for the Primary and Secondary dropdowns can also be modified. The Primary dropdown is the name of the grouping or the category of products, services, salespeople, etc. being analyzed. The Secondary dropdown is the name of the list of products, services, salespeople, etc. being analyzed. The Actuals field is the name of the metric being analyzed. i.e. Revenue, Sales, Downloads, Households, etc. The Quota field is the name of the metric being measured against or compared to. i.e. Quota, Goal, Target, Budget, etc. If you select “Highlight”, PAM will indicate the columns available for data input on the Actuals and Quota tabs. The number of yellow highlighted columns will vary depending on the edition of PAM you are using or if you have purchased additional categories or products. 9
  • 10.
    End of YearAchievement Status The EOY Achievement Status Advisor is an advanced feature found on the Monthly Trend Analyzer in the Premium Edition of PAM. It utilizes the historical data of the selected item to determine or forecast the likelihood of reaching the EOY Quota. The EOY Achievement Status phrases can be modified to match your company’s standard reporting terminology. Calculation PAM's dynamic calculation functionality depends on automatic calculation being enabled in Excel ®. Without it, PAM’s advanced calculations and analysis will not function or operate correctly. Calculating Status Depending on the speed and processing power of your computer, you may see “Calculating” or “Calculating Cells” while your computer is crunching numbers. Once your computer is finished calculating, you can proceed to the next dropdown. i.e. After you select a Category from the Primary dropdown, you may have to wait a couple of seconds before the Secondary dropdown is updated and ready. 10
  • 11.
    Automatic Calculation Please verifyyour Automatic Calculation settings by following the instructions below. In Excel ® 2003 Click on Tools, then Options. Click on the Calculation tab at the top. Ensure “Automatic” is selected. Then click OK. 11
  • 12.
    In Excel ®2007 Click the Microsoft Office Button. Click the Excel Options button at the bottom Click on Formulas and verify "Automatic" under Workbook Calculations is selected. Click OK 12
  • 13.
    In Excel ®2010 Click on File Click on Options 13
  • 14.
    Click on Formulasin the left navigation pane. Verify Automatic is selected. Click OK In Excel ® 2004 / 2008 for the MAC. Click the Excel menu, then click Preferences. 14
  • 15.
    On the Preferenceswindow, click Calculation. Verify Automatic is selected then click OK. Manual Calculation At times, you may need to invoke or force Excel ® to do a manual calculation. In Windows versions: Press the F9 key In MAC versions: 15
  • 16.
    Daily Trend Analyzer Step1. Select the Year, Month and Day Step 2. Select a Category from the Category dropdown Step 3. Select a Product from the Products dropdown * The Daily Above/Below Quota is only available in the Deluxe, Premium & Enterprise Editions of PAM ** The APS – Automated Performance Summary is only available in the Enterprise Edition of PAM *** The Daily Average Needed to Obtain the EOY Quota is only available in the Premium & Enterprise Editions of PAM 16
  • 17.
    Weekly Trend Analyzer Step1. Select the Year and Week Ending Date Step 2. Select a Category from the Category dropdown Step 3. Select a Product from the Products dropdown * The Weekly Above/Below Quota is only available in the Deluxe, Premium & Enterprise Editions of PAM ** The APS – Automated Performance Summary is only available in the Enterprise Edition of PAM *** The Weekly Average Needed to Obtain the EOY Quota is only available in the Premium & Enterprise Editions of PAM 17
  • 18.
    Monthly Trend Analyzer Step1. Select the Month-Year combination Step 2. Select a Category from the Category dropdown Step 3. Select a Product from the Products dropdown * The Monthly Above/Below Quota is only available in the Deluxe, Premium & Enterprise Editions of PAM ** The APS – Automated Performance Summary is only available in the Enterprise Edition of PAM *** The Average Needed to Obtain the EOY Quota is only available in the Premium & Enterprise Editions of PAM **** The EOY Quota Advisor is only available in the Enterprise Edition of PAM 18
  • 19.
    Multi Comparison Utility Step1. Select the Year Step 2. Select a Category from the Category dropdown Step 3. Select a Product from the Products dropdown Repeat Steps 1 – 3 for each additional item you would like to compare. * The Multi Comparison Utility is only available in the Enterprise Edition of PAM ** The APS – Automated Performance Summary is only available in the Enterprise Edition of PAM 19
  • 20.
    Monthly Calendar View Step1. Select the Month-Year Combination Step 2. Select a Category from the Category dropdown Step 3. Select a Product from the Products dropdown * Only available in the Enterprise Edition of PAM 20
  • 21.
    Annual Calendar View Step1. Select a Category from the Category dropdown Step 2. Select a Product from the Products dropdown * Only available in the Enterprise Edition of PAM 21
  • 22.
    Executive Dashboard Step 1.Select a Category from the Category dropdown Step 2. Select a Product from the Products dropdown * Only available in the Enterprise Edition of PAM 22