OUTLAY 2010, SICAV S.A.- Performance
•
1 like•83 views

The performance data shown in tables and graphs on this page is calculated in GBP of the fund/index/average (as applicable), on a Bid To Bid / Nav to Nav basis, with gross dividends re-invested on ex-dividend date. Past performance is not necessarily a guide to future performance; unit prices may fall as well as rise.

Recommended
More Related Content
Viewers also liked
Similar to OUTLAY 2010, SICAV S.A.- Performance
Similar to OUTLAY 2010, SICAV S.A.- Performance (20)
More from Osprzet Technologies Pvt. Ltd
More from Osprzet Technologies Pvt. Ltd (9)
Recently uploaded
Recently uploaded (20)
OUTLAY 2010, SICAV S.A.- Performance
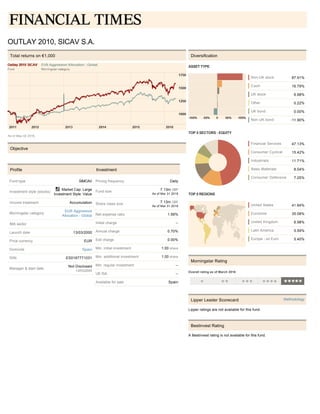
- 1. OUTLAY 2010, SICAV S.A. As of May 02 2016. Total returns on €1,000 Objective Market Cap: Large Investment Style: Value Fund type SIMCAV Investment style (stocks) Income treatment Accumulation Morningstar category EUR Aggressive Allocation - Global IMA sector Launch date 13/03/2000 Price currency EUR Domicile Spain ISIN ES0167771031 Manager & start date Not Disclosed 13/03/2000 Profile Pricing frequency Daily Fund size 7.13m GBP As of Mar 31 2016 Share class size 7.13m GBP As of Mar 31 2016 Net expense ratio 1.56% Initial charge -- Annual charge 0.70% Exit charge 0.00% Min. initial investment 1.00 share Min. additional investment 1.00 share Min. regular investment -- UK ISA -- Available for sale Spain Investment Non-UK stock 87.91% Cash 16.79% UK stock 6.98% Other 0.22% UK bond 0.00% Non-UK bond -11.90% Financial Services 47.13% Consumer Cyclical 15.42% Industrials 11.71% Basic Materials 8.04% Consumer Defensive 7.25% United States 41.84% Eurozone 35.08% United Kingdom 6.98% Latin America 5.59% Europe - ex Euro 5.40% Diversification ASSET TYPE TOP 5 SECTORS - EQUITY TOP 5 REGIONS Overall rating as of March 2016 Morningstar Rating Lipper ratings are not available for this fund. Lipper Leader Scorecard Methodology A Bestinvest rating is not available for this fund. Bestinvest Rating
- 2. As of Apr 28 2016. Trailing total returns 5 years 3 years 1 year 6 months 3 months 1 month OUTLAY 2010, SICAV S.A. Fund +5.75% +5.64% +7.31% +7.46% +11.71% +4.21% EUR Aggressive Allocation - Global Morningstar category +2.14% +2.81% -2.07% +4.59% +6.23% +1.21% Fund quartile 1st 1st 1st 1st 1st 1st Funds in category 198 222 270 283 294 299 As of Mar 31 2016. Trailing returns analysis Trailing period- 3 months The chart shows how frequently the fund's 3-month return is positive or negative. Each bar is an observation period (the fund's return over the past 3 months, at month's end). Best & worst 3 month trailing return since inception Rate of return February 2009 - May 2009 +29.00% August 2008 - November 2008 -38.70% As of Mar 31 2016. Risk vs return Data delayed at least 15 minutes, as of Feb 29 2016. Top 10 holdings Company Portfolio weight Short allocation Long allocation Futuro|bundesrepub Deutschland 02/15/2025 - 15.42% Berkshire Hathaway Inc B 10.69% American International Group Inc 8.92% Bank of America Corporation 7.01% Citigroup Inc 5.43% Tesco PLC 4.80% Tecnicas Reunidas SA 4.70% Qualitas Controladora SAB de CV 4.47% Rosenbauer International AG 3.76% Semapa SA 3.70% Per cent of portfolio in top 10 holdings: 38.05% As of Mar 31 2016. Risk measures - 3 year Benchmark used: Cat 25%Barclays EurAgg TR&75%FTSE Wld TR Fund Category average Alpha 0.02 -- Beta 0.79 -- Information ratio -0.39 -- R squared 66.17 -- Sharpe ratio 0.61 -- Standard deviation 7.98% --