Major factors may affect your Business
•
0 likes•168 views

Major reasons which may affect my business or may sustain your business in market.

Recommended
Recommended
More Related Content
Similar to Major factors may affect your Business
Similar to Major factors may affect your Business (20)
More from Osprzet Technologies Pvt. Ltd
More from Osprzet Technologies Pvt. Ltd (13)
Recently uploaded
Recently uploaded (20)
Major factors may affect your Business
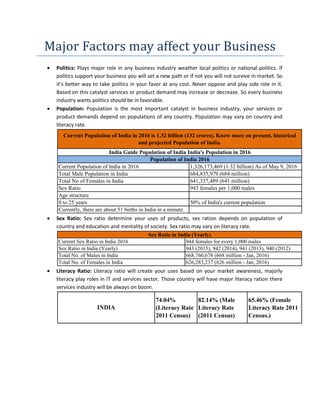
- 1. Major Factors may affect your Business Politics: Plays major role in any business industry weather local politics or national politics. If politics support your business you will set a new path or if not you will not survive in market. So it’s better way to take politics in your favor at any cost. Never oppose and play side role in it. Based on this catalyst services or product demand may increase or decrease. So every business industry wants politics should be in favorable. Population: Population is the most important catalyst in business industry, your services or product demands depend on populations of any country. Population may vary on country and literacy rate. Sex Ratio: Sex ratio determine your uses of products, sex ration depends on population of country and education and mentality of society. Sex ratio may vary on literacy rate. Literacy Ratio: Literacy ratio will create your uses based on your market awareness, majorly literacy play roles in IT and services sector. Those country will have major literacy ration there services industry will be always on boom. Current Population of India in 2016 1,326,173,469 (1.32 billion) As of May 9, 2016 Total Male Population in India 684,835,979 (684 million) Total No of Females in India 641,337,489 (641 million) Sex Ratio 943 females per 1,000 males Age structure 0 to 25 years 50% of India's current population Currently, there are about 51 births in India in a minute. Population of India 2016 India Guide Population of India India's Population in 2016 Current Population of India in 2016 is 1.32 billion (132 crores). Know more on present, historical and projected Population of India. Current Sex Ratio in India 2016 944 females for every 1,000 males Sex Ratio in India (Yearly) 943 (2015), 942 (2014), 941 (2013), 940 (2012) Total No. of Males in India 668,760,678 (668 million - Jan, 2016) Total No. of Females in India 626,283,237 (626 million - Jan, 2016) Sex Ratio in India (Yearly) 74.04% (Literacy Rate 2011 Census) 82.14% (Male Literacy Rate (2011 Census) 65.46% (Female Literacy Rate 2011 Census.) INDIA
- 2. Telecom Services providers: Now in digital age, every services industry wants to come online with latest platform and 90% industry prefers mobile technology. And many of them playing major role in market via this technology and latest technology, because via mobile technology reduces the gap between consumer and suppliers. But the fact is that, in digital age without internet you will not allow to operate online. And everyone knows smart phone is common and becomes 4th important needs (Food, Shelter, Cloths & 4th on is Mobile) in human life. But internet connectivity finally depends on telecom operators, and data cost. An in India, data cost is much more higher compare to other developed country and due to low income ratio most of the peoples are not able to buy internet data. Due to this still many industries are not able to provide services on ruler area. So if you want to be a player in this market, not only you but it’s for all business person, it’s very important to reduce cost of internet data somehow or bring some strong telecom players in market or create competition in telecom industry. A report from Akamai has released its latest report on the State of Internet for Q1 2015 “India’s position in the list of connected nations in Asia Pacific.” S.No State Literacy Rate (2011 Census) Male Literacy Rate (2011 Census) Female Literacy Rate (2011 Census) 1 Andaman & Nicobar Islands 86.30% 90.10% 81.80% 2 Andhra Pradesh 67.70% 75.60% 59.70% 3 Arunachal Pradesh 67.00% 73.70% 59.60% 4 Assam 73.20% 78.80% 67.30% 5 Bihar 63.80% 73.50% 53.30% 6 Chandigarh 86.40% 90.50% 81.40% 7 Chattisgarh 71.00% 81.50% 60.60% 8 Dadra & Nagar Haveli 77.70% 86.50% 65.90% 9 Daman & Diu 87.10% 91.50% 79.60% 10 Delhi 86.30% 91.00% 80.90% 11 Goa 87.40% 92.80% 81.80% 12 Gujarat 79.30% 87.20% 70.70% 13 Haryana 76.60% 85.40% 66.80% 14 Himachal Pradesh 83.80% 90.80% 76.60% 15 Jammu and Kashmir 68.70% 78.30% 58.00% 16 Jharkhand 67.60% 78.50% 56.20% 17 Karnataka 75.60% 82.80% 68.10% 18 Kerala 93.90% 96.00% 92.00% 19 Lakshadweep 92.30% 96.10% 88.20% 20 Madhya Pradesh 70.60% 80.50% 60.00% 21 Maharashtra 82.90% 89.80% 75.50% 22 Manipur 79.80% 86.50% 73.20% 23 Meghalaya 75.50% 77.20% 73.80% 24 Mizoram 91.60% 93.70% 89.40% 25 Nagaland 80.10% 83.30% 76.70% 26 Orissa 73.50% 82.40% 64.40% 27 Puducherry 86.50% 92.10% 81.20% 28 Punjab 76.70% 81.50% 71.30% 29 Rajasthan 67.10% 80.50% 52.70% 30 Sikkim 82.20% 87.30% 76.40% 31 Tamil Nadu 80.30% 86.80% 73.90% 32 Tripura 87.80% 92.20% 83.10% 33 Uttar Pradesh 69.70% 79.20% 59.30% 34 Uttarakhand 79.60% 88.30% 70.70% 35 West Bengal 77.10% 82.70% 71.20%
- 3. Akamai points out that the first quarter of 2015 shows strong, positive connectivity growth overall. The average connection speed increased 10 percent quarter-over-quarter (QoQ) and 30 percent year-over-year (YoY) to 5 Mbps while the global average peak connection speed increased 8.2 percent QoQ and 37 percent YoY to a whopping 29.1Mbps. In Asia-Pacific, South Korea bagged the top position with 23.6Mbps connection. Singapore shows the highest peak connection speed at 98.5 Mbps, while India had the lowest at 17.4 Mbps. The report also talks about IPv6 adoption across the world. It should be noted that not a single country from the Asia-Pacfic region was able to crack the top 10. European countries continue to dominate IPv6 adoption, with 8 out of the top 10 spots. In fact, IPv6 adoption was weaker
- 4. than the previous quarter. Mobile connectivity – Average connection speed Earnings Ratio: “Gross Income ratio of any country plays role as back bone for country.” Report from: Trending Economics
- 5. The Gross Domestic Product per capita in India was last recorded at 1262.64 US dollars in 2014. The GDP per Capita in India is equivalent to 10 percent of th India averaged 477.50 USD from 1960 until 2014, reaching an all time high of 1262.64 USD in 2014 and a record low of 228.34 USD in 1960. GDP per capita in India is reported by the World Bank. A report from GSM mobile economy report The Gross Domestic Product per capita in India was last recorded at 1262.64 US dollars in 2014. The GDP per Capita in India is equivalent to 10 percent of the world's average. GDP per capita in India averaged 477.50 USD from 1960 until 2014, reaching an all time high of 1262.64 USD in 2014 and a record low of 228.34 USD in 1960. GDP per capita in India is reported by the World GSM mobile economy report: The Gross Domestic Product per capita in India was last recorded at 1262.64 US dollars in 2014. e world's average. GDP per capita in India averaged 477.50 USD from 1960 until 2014, reaching an all time high of 1262.64 USD in 2014 and a record low of 228.34 USD in 1960. GDP per capita in India is reported by the World
- 7. Transport System (Road Connectivity) For more you can contact me: riturj89@gmail.com Follow me on: www.facebook.com/digitalrituraj www.linkedin.com/in/riturajsingh1 https://twitter.com/riturajsinghin Length(In Km) Expressways 200 National Highways 96,260.72 State Highways 1,31,899 Major District Roads 4,67,763 Rural and Other Roads 26,50,000 Total Length 33 Lakhs Kms(Approx) Indian Road Network Indian road network of 33 lakh Km.is second largest in the world and consists of : About 65% of freight and 80% passenger traffic is carried by the roads. National Highways constitute only about 1.7% of the road network but carry about 40% of the total road traffic. Number of vehicles has been growing at an average pace of 10.16% per annum over the last five years. Modal Shift States/UTs Total Surfaced States/UTs Total Surfaced Andhra Pradesh 164026 89302 Maharashtra 123497 106897 Arunachal Pradesh 3345 3345 Manipur 6680 2964 Assam 217734 23269 Meghalaya 1613 1014 Bihar 108759 42747 Mizoram 2103 2103 Chhattisgarh 19462 19462 Nagaland 22120 9267 Goa 5246 2860 Odisha 194151 23081 Gujarat 52022 49355 Punjab 59495 59495 Haryana 4484 4484 Rajasthan 92904 56776 Himachal Pradesh 10585 10154 Sikkim 2401 2401 Jammu and Kashmir 5624 4577 Tamil Nadu 138099 101319 Jharkhand 7285 7285 Tripura 16767 7578 Karnataka 162753 89056 Uttarakhand 4051 4051 Kerala 155285 71481 Uttar Pradesh 87350 53265 Madhya Pradesh 96611 54607 West Bengal 172462 26530 Daman and Diu 111 111 Puducherry 1195 953 ALL INDIA Total - 1938220 Surfaced - 929789 State/UT wise total and surfaced length of rural roads in India as on 31st March 2012