Outcomes based teaching learning plan (obtlp) elementary statistics & probability
•Download as DOCX, PDF•
2 likes•676 views

Outcomes-Based Teaching Learning Plan in Graph Theory for BSED-Math Students in College

Recommended
Recommended
More Related Content
What's hot
What's hot (20)
Similar to Outcomes based teaching learning plan (obtlp) elementary statistics & probability
Similar to Outcomes based teaching learning plan (obtlp) elementary statistics & probability (20)
More from Elton John Embodo
More from Elton John Embodo (20)
Recently uploaded
Recently uploaded (20)
Outcomes based teaching learning plan (obtlp) elementary statistics & probability
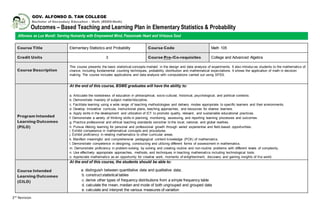
- 1. 2nd Revision GOV. ALFONSO D. TAN COLLEGE Bachelor of Secondary Education – Math (BSED-Math) Outcomes – Based Teaching and Learning Plan in Elementary Statistics & Probability Course Title Elementary Statistics and Probability Course Code Math 105 Credit Units 3 Course Pre-/Co-requisites College and Advanced Algebra Course Description This course presents the basic statistical concepts involved in the design and data analysis of experiments. It also introduc es students to the mathematics of chance, including fundamental counting techniques, probability distribution and mathematical expectations. It shows the application of math in decision making. The course includes applications and data analysis with computations carried out using SPSS. Program Intended Learning Outcomes (PILO) At the end of this course, BSME graduates will have the ability to: a. Articulate the rootedness of education in philosophical, socio-cultural, historical, psychological, and political contexts. b. Demonstrate mastery of subject matter/discipline. c. Facilitate learning using a wide range of teaching methodologies and delivery modes appropriate to specific learners and their environments. d. Develop innovative curricula, instructional plans, teaching approaches, and resources for diverse learners. e. Apply skills in the development and utilization of ICT to promote quality, relevant, and sustainable educational practices. f. Demonstrate a variety of thinking skills in planning, monitoring, assessing, and reporting learning processes and outcomes . g. Practice professional and ethical teaching standards sensitive to the local, national, and global realities. h. Pursue lifelong learning for personal and professional growth through varied experiential and field-based opportunities. i. Exhibit competence in mathematical concepts and procedures. j. Exhibit proficiency in relating mathematics to other curricular areas. k. Manifest meaningful and comprehensive pedagogical content knowledge (PCK) of mathematics. l. Demonstrate competence in designing, constructing and utilizing different forms of assessment in mathematics. m. Demonstrate proficiency in problem-solving by solving and creating routine and non-routine problems with different levels of complexity. n. Use effectively appropriate approaches, methods, and techniques in teaching mathematics including technological tools. o. Appreciate mathematics as an opportunity for creative work, moments of enlightenment, discovery and gaining insights of the world. Course Intended Learning Outcomes (CILO) At the end of this course, the students should be able to: a. distinguish between quantitative data and qualitative data; b. construct statistical tables c. derive other types of frequency distributions from a simple frequency table d. calculate the mean, median and mode of both ungrouped and grouped data e. calculate and interpret the various measures of variation Alfonsos as Lux Mundi: Serving Humanity with Empowered Mind, Passionate Heart and Virtuous Soul
- 2. 2nd Revision f. differentiate permutations and combinations g. apply the different laws of probability h. determine probability values using the appropriate probability distribution i. apply the concept of a sampling distribution to probability problems j. distinguish between a point estimate and an interval estimate k. formulate statistical hypotheses MIDTERM Essential Learning Intended Learning Outcomes (ILO) Suggested Teaching/Learning Activities (TLAs) Assessment Tasks (ATs)Week Content Standards Declarative Knowledge Functional Knowledge 1-2 Demonstrate familiarity in Frequency Distributions Frequency Distribution 1. The Array 2. The FrequencyDistribution 3. Construction ofa Frequency Distribution 4. DerivedFrequency Distributions 5. GraphicalRepresentations of FrequencyDistributions -discussing the array and the concept of frequency distribution -discussing the process in constructing frequency distribution -graphing the frequency distrbution -set up a frequency distribution for a mass of data -derive other types of frequency distribution from a simple frequency table -interpret different types of frequencies -construct histograms, frequency polygons, and ogives Lecture Method Group Interactive discussion Board Work Group Activity Evaluative Quiz Group Output: Construction of Frequency distribution 3-4 Demonstrate Understanding in Measures of Central Tendency and Other Measures of Position Measures of Central tendency and Other Measures of Position 1. Statistics, Parameters, and Symbols 2. The Mean 3. The Median 4. The Mode 5. Mean, MedianandSkewness 6. Other Measures of Position -discussing the process of computing the measures of central tendency: mean, median and mode of both ungrouped and grouped data -discussing the other measures of positions: quartiles, decile, percentile and percentile ranks -discuss the use of and limitations of each measure of central tendency -calculate the mean, median, mode of ungrouped data -calculate the mean, median, and mode of grouped data -calculate and interpret the various measures of position -determine the percentile rank of a given value with a distribution Lecture Method Group Interactive discussion Board Work Group Activity Evaluative Quiz Group Output: Computation of the measures of the central tendency of the gathered data 5-7 Demonstrate understanding in Measures of Variation . Measures of Variation 1. The Range 2. Interquartile Range and Quartile Deviation 3. The MeanDeviation 4. The Variance andStandard Deviation 5. Uses of the StandardDeviation 6. Measures ofRelative Dispersion -discussing the process in computation each measure of Variation; range, interquartile and quartile deviation, mean deviation, variance and standard deviation -discussing the measures of relative dispersion, skewness and kurtosis -discuss the importance of a measure of variation -calculate and interpret the various mesures of variation -describe a given set of data in terms of variability, skewness, and kurtosis Lecture Method Group Interactive discussion Board Work Group Activity Evaluative Quiz Concept Paper on the Uses of Variance and Standard deviation
- 3. 2nd Revision 7. Measures ofSkewness 8. Measure of Kurtosis 8 Demonstrate understanding in Permutations and Combinations Permutations and Combinations 1. The FundamentalPrinciple of Counting 2. Permutations 3. Combinations -discussing the process of the fundamental principle of counting, permutations and combinations -count efficiently by applying the Fundamental Principle of Counting -differentiate permutations and combinations -perform combinatorial analyses Lecture Method Group Interactive discussion Board Work Group Activity Evaluative Quiz Individual Output on Obtaining permutation and combination from the given distinct cases 9-10 Demonstrate understanding in Probability Probability 1. Definitionof Probability 2. Types of Probability 3. Marginal Probabilityand Joint Probability 4. MutuallyExclusive andNon- mutuallyExclusive Events 5. The AdditionRule 6. Conditional Probability 7. Dependent andIndependent Events 8. The MultiplicationRule 9. ContingencyTables - defining probability and explain the its types -differentiating mutually exclusive and non-mutually exclusive events -discussing the process of addition rule -discussing the conditional probability -differentiating the dependent and independent events -discussing the process of the multiplication rule -discussing contingency tables -define probability -discuss the three different approaches to the study of probability theory -apply the different laws pf probability -interpret probability values -make use of the concept of probability in ordinary decision-making problems Lecture Method Group Interactive discussion Board Work Group Activity Evaluative Quiz FINALS 11-13 Demonstrate understanding in Probability Distributions Probability Distributions 1. Random Variables 2. ProbabilityDistributions 3. Binomial Probability Distribution 4. Hypergeometric Probability Distribution 5. PoissonProbabilityDistribution 6. The Meanof a Discrete Probability 7. The Variance of a Discrete ProbabilityDistribution 8. The Normal Distribution 9. The Normal Approximation to the Binomial Distribution -identifying random variables and discussing the process of probability distributions -differentiating the binomial probability distribution and Hypergeometric distribution and Poisson probability distribution Discussing the mean and the variance of the discrete probability distribution -discussing the concept of normal distribution and the normal approximation to the binomial distribution - discuss the concept of random variables -identify the different types of probability distributions -discuss the Bernoulli process -calculate the mean and standard deviation of a discrete probability distribution -choose the appropriate probability distribution for a given situation -determine probability values using the appropriate probability distribution -explain the significance of the standard normal distribution Lecture Method Group Interactive discussion Board Work Group Activity Evaluative Quiz Group PowerPoint presentation with rubrics on the distribution of probability with distinct case each group 14-15 Demonstrate understanding in Sampling Distributions Sampling Distributions 1. The Concept of Sampling Distribution 2. SamplingDistributionof the -explaining the concept of sampling distribution -discussing the process of getting the mean of sampling distribution - generate a sampling distribution rom a small population -discuss the properties of a sampling distribution of the mean Lecture Method Group Interactive discussion Group Activity Evaluative Quiz
- 4. 2nd Revision Mean 3. The central Limit Theorem -explaining the central limit theorem -compute the mean and the standard deviation pf a sampling distribution of the mean -apply the concept of a sampling distribution to probability problems Board Work Group presentation with rubrics on Sampling distribution 16-18 Demonstrate Understanding in Test of Hypothesis Test of Hypothesis 1. Statistical Hypotheses 2. Two types ofErrors 3. Level of Significance 4. One-tailedandTwo-tailed Tests 5. Steps inHypothesis testing 6. Testing a Hypothesized Value of the mean 7. Testing the Difference BetweenTwo Means -creating statistical hypothesis -identifying and differentiating two types of Errors; Type I: Rejecting the True and Type II: Accepting the False -discussing each step in testing hypothesis -discussing the process of testing a hypothesized value of the mean -determining and testing the difference between two means -formulate statistical hypotheses -discuss the two types of errorsin hypotheses testing -establish a decision rule for accepting ro rejecting a statistical hypothesis at a specified level of significance -distinguish between the one-sample case and two-sample case in test of hypothesis concerning means -choose the appropriate test statistics for a particular set of data Lecture Method Group Interactive discussion Board Work Group Activity Evaluative Quiz Individual output of Testing Hypothesis Basic Readings Febre, F. (2002). Introduction to Statistics. Extended Readings ElementaryStatistics: A step by Step Process Course Assessment As identifiedin the Assessment Task Course Policies LanguageofInstructions English Attendance As identifiedin the student handbook Homework,Quizzes,Written Reports,ReactionPapersand Portfolio Special Requirement GradingSystem SummativeQuizzes - 50% PerformanceTask–40% Periodical Exam - 50% 100% Classroom RulesandRegulations Respectmustexercise all the time
- 5. 2nd Revision Committee Members CommitteeLeader : Elton John B.Embodo Members : Consultation Schedule FacultyMember : EltonJohn B. Embodo ContactNumber : 09107619989 E-mailaddress : eltonjohn439@yahoo.com ConsultationHours: 8:00AM-5:00PM Friday TimeandVenue : 8:00AM-5:00PM FridayITE Office Course Title A.Y. Term of Effectivity Prepared by Checked by Approved by Page/s Elementary Statistics 2018 - 2019 ELTON JOHN B. EMBODO. LPT Mathematics Instructor NORIEL B. ERAP, MEd Dean, ITE LOVE H. FALLORAN, MSCRIM VP for Academics 5