Downloaded 12 times
![OSHA INJ U RY AND I L LNE S S P R E V ENT ION P ROG R AMS WHI T E PA P E R
• Any wages paid to injured workers for absences not covered by workers’ compensation;
• The wage costs related to time lost through work stoppage;
• Administrative time spent by supervisors following injuries;
• Employee training and replacement costs;
• Lost productivity related to new employee learning curves and accommodation of injured
employees; and
• Replacement costs of damaged material, machinery and property.
OSHA has historically used the results of one study (Stanford University, 1981) that found the
indirect costs can range from 1.1 (for the most severe injuries) to 4.5 (for the least severe injuries)
times the direct costs.3
“Establishing safety as a value rather than a priority
tells our employees and our customers that safety is
built into our culture, not something we do to merely
comply with regulations.
Our excellent safety performance over the past seven
years has been a key factor in reducing our insurance
cost. Our low EMR [Experience Modification Rate],
incidents rates, and SHARP Management System have
impressed our customers and, in many cases, was a key
factor in selecting Parsons to perform their project.”
– Charles L. Harrington, Chairman & CEO, Parsons Corp.
Source: National Safety Council.
4
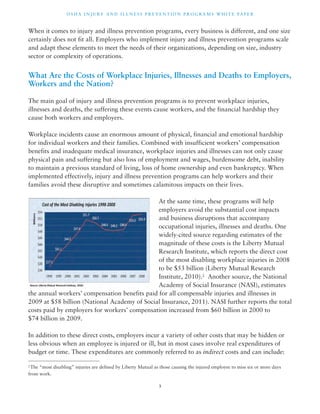
When workers are killed, are injured or
become ill, there are substantial costs
beyond those borne by employers. A variety
of approaches can be used to estimate these
costs. For example, Viscusi and Aldy (2003)
provided estimates of the monetary value
of each life lost. OSHA updated these
estimates (to account for inflation) to 2010
dollars, yielding a value of $8.7 million for
each life lost. Multiplying this value by the
4,547 workplace deaths reported by the
Bureau of Labor Statistics for 2010, OSHA
estimates the annual cost of known work-place
fatalities to be nearly $40 billion.
This estimate does not include the cost of non-fatal injuries, or of occupational illnesses like
cancer and lung disease. These illnesses generally may occur many years or even decades after
workers are exposed and are therefore seldom recorded in government statistics or employer
surveillance activities.
The human and economic costs of these conditions are indisputably enormous. Leigh et al.
(1997) estimated that more than 60,000 workers die each year from occupational illnesses, and
more than 850,000 develop new illnesses annually. Similarly, Steenland et al. (2003) estimated
that between 10,000 and 20,000 workers die each year from cancer due to occupational
exposures, and between 5,000 and 24,000 die from work-related Chronic Obstructive
Pulmonary Disease.
3For more details see OSHA’s Safety and Health Management Systems eTool, available at www.osha.gov/SLTC/etools/
safetyhealth/mod1_costs.html.](https://image.slidesharecdn.com/oshawhite-paper-january2012sm-140906143355-phpapp01/85/Osha-white-paper-january2012sm-5-320.jpg)
![OSHA INJ U RY AND I L LNE S S P R E V ENT ION P ROG R AMS WHI T E PA P E R
active worker participation are effective in reducing injury risk, while “paper” programs are, not
surprisingly, ineffective.
The literature on injury and illness prevention programs also includes numerous studies that
attempt to identify the critical success features associated with superior health and safety
performance. Gallagher (2001) concludes that management commitment and employee involve-ment
are the keys to program success: “[R]ecurring findings across these studies were the critical
role played by senior managers in successful health and safety management systems, and the
importance of effective communication, employee involvement and consultation.”
There are many benefits from developing a safety
culture at your company - none of which is more
valuable than employee loyalty. When employees know
you care about their personal well-being and you prove
that to them in their workplace, it increases morale,
engagement, awareness, motivation and productivity.”
– Daniel R. Nobbe, Plant Leader, Fiberteq LLC,
Danville, IL.
Source: National Safety Council.
7
Worker participation, a fundamental
element of injury and illness prevention
programs, makes an important contribution
to an employer’s bottom line. When work-ers
are encouraged to offer their ideas and
they see their contributions being taken
seriously, they tend to be more satisfied
and more productive (Huang et al., 2006).
Engaging employees in dialogue with
management and each other about safety
and health can lead to improved relation-ships
and better overall communication, along with reduced injury rates. Improved employee
morale and satisfaction translates to greater loyalty, lower absenteeism and higher productivity.
This body of research, combined with studies of individual companies (see boxes, below, with
Case Studies of Programs Implemented under OSHA’s Voluntary Protection Program (VPP) and
Safety and Health Achievement Recognition Program (SHARP)) demonstrate clearly that injury
and illness prevention programs are effective at the establishment level in dramatically reducing
risk of workplace injury. This effect has also been detected in state-wide comparisons.
Based on its review of the literature on the effectiveness of these programs and on the experience
of the states that have implemented injury and illness prevention program requirements, OSHA
estimates that implementation of injury and illness prevention programs will reduce injuries by
15 percent to 35 percent for employers who do not now have safety and health programs. At the
15 percent program effectiveness level, this saves $9 billion per year in workers’ compensation
costs; at the 35 percent effectiveness level the savings are $23 billion per year.4 In addition to
4 If injury and illness prevention programs achieve a 15 percent reduction in injuries and illnesses for employers who do not
currently have safety and health programs, the overall reduction in injuries and illnesses for all employers including those that
already have programs is estimated at 12.4 percent. Applying this 12.4 percent to NASI’s estimate of the $74 billion in direct
workers’ compensation costs in 2009, workers’ compensation savings could be as high as $9 billion per year. With a 35 percent
program effectiveness, the overall reduction in injuries and illnesses for all employers is estimated at 30.8 percent and workers’
compensation savings could reach $23 billion per year.](https://image.slidesharecdn.com/oshawhite-paper-january2012sm-140906143355-phpapp01/85/Osha-white-paper-january2012sm-8-320.jpg)

The document discusses injury and illness prevention programs (IIPPs), which are proactive processes that help employers identify and fix workplace hazards before workers get hurt. The key is management leadership, worker participation, hazard identification and control, training, and program evaluation. Studies show IIPPs can dramatically reduce injuries and illnesses, lower costs from insurance and lost productivity, and improve workplace culture. They are required in many countries and 34 US states due to their effectiveness.


