Download to read offline

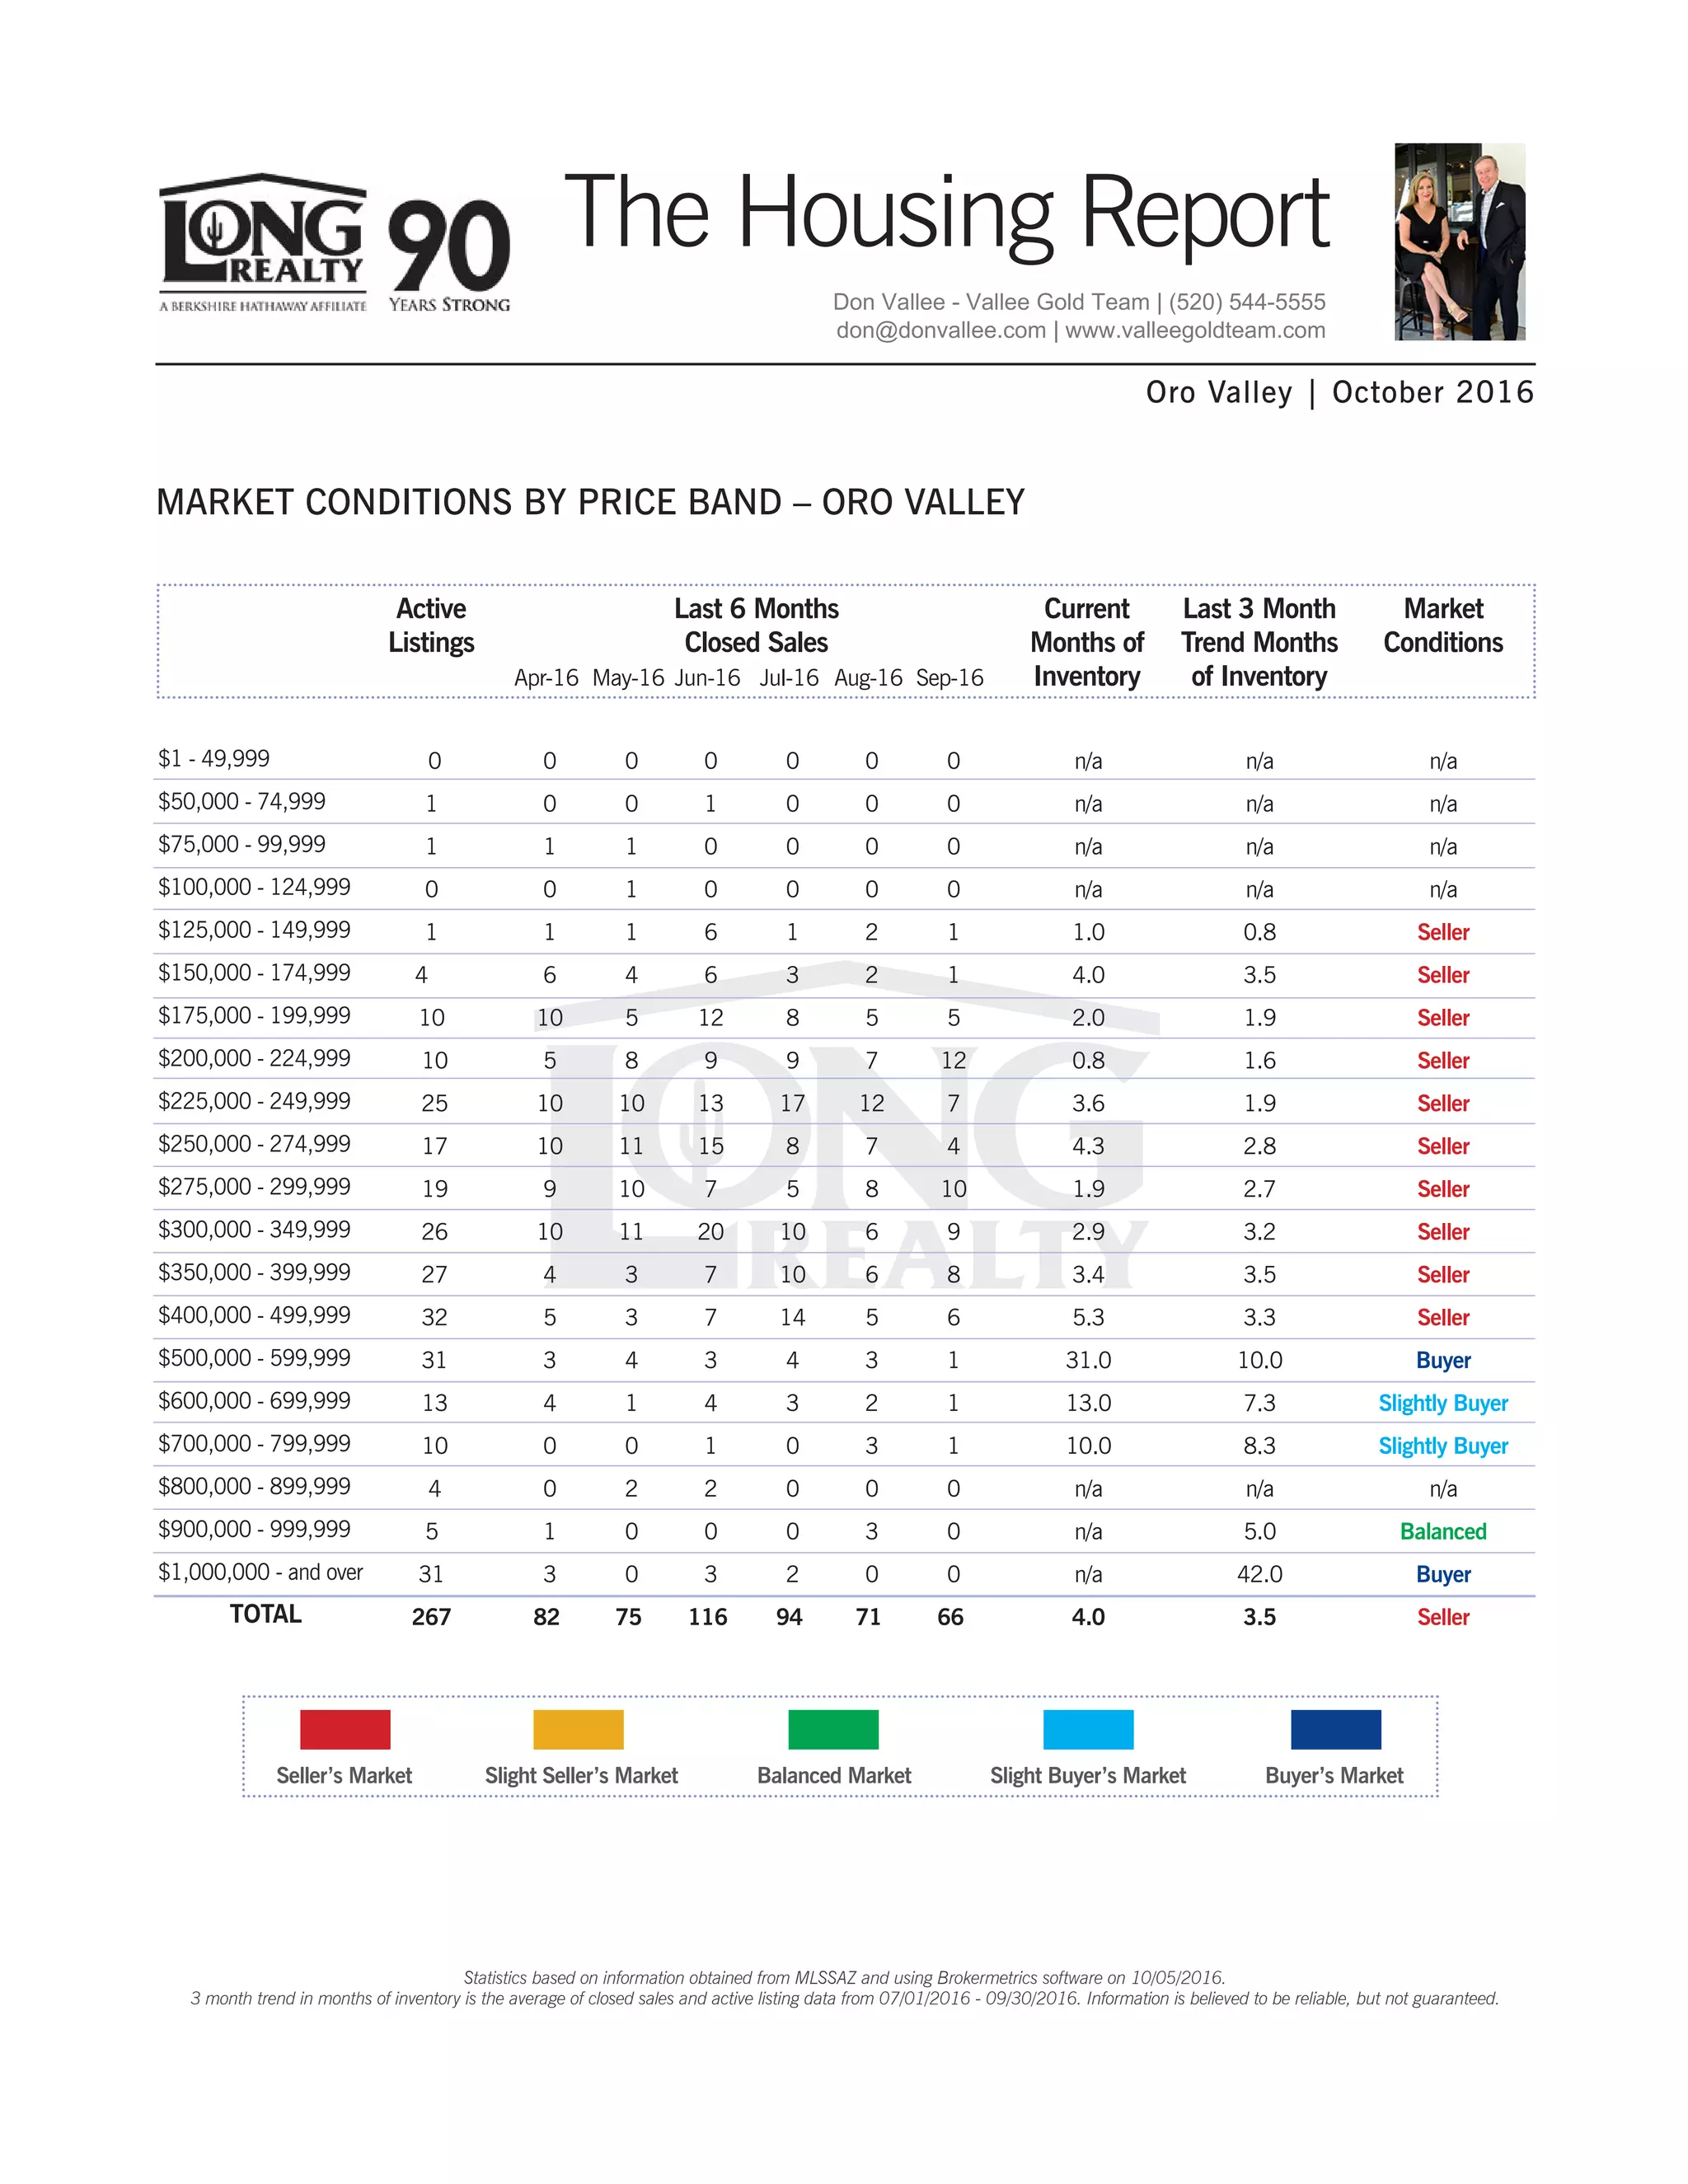
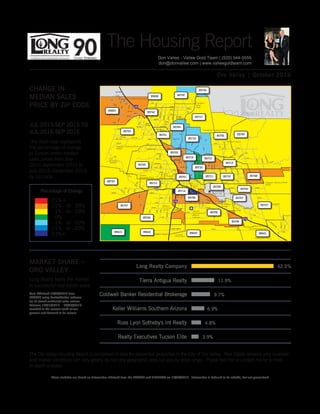

This document is a housing report for Oro Valley from October 2016. It provides statistics on housing inventory, sales, and market conditions from July to September 2016 based on MLS data. The market is currently a seller's market overall, but conditions vary by price range, with higher price ranges trending more toward a buyer's market. Accompanying charts show Long Realty leads the market share in Oro Valley and the percentage change in median sales prices from July to September 2015 to the same period in 2016 by zip code in the Tucson metro area.


