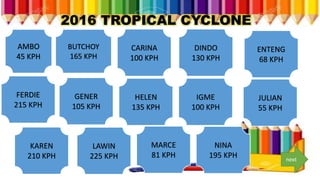
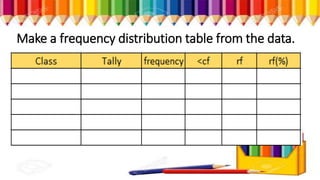
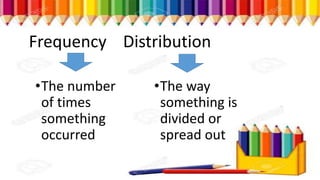
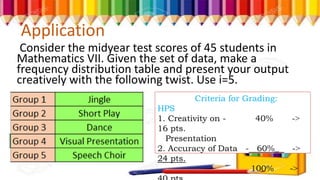
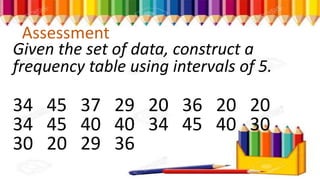
Organizing data in a
Frequency Distribution
Table
Statistics (Grade 7)
2016 TROPICAL CYCLONE
AMBO
45 KPH
BUTCHOY
165 KPH
CARINA
100 KPH
DINDO
130 KPH
ENTENG
68 KPH
FERDIE
215 KPH
GENER
105 KPH
HELEN
135 KPH
IGME
100 KPH
JULIAN
55 KPH
KAREN
210 KPH
LAWIN
225 KPH
MARCE
81 KPH
NINA
195 KPH next
TROPICAL
DEPRESSION (TD)
TROPICAL STORM (TS)
SEVERE TROPICAL
STORM (STS)
TYPHOON (TY)
SUPER
TYPHOON (STY)
1. How did you know which data
goes together?
2. What does the list tell us?
3. So, what can we do with the
list?
Make a frequency distribution table from the data.
Frequency Distribution
•The number
of times
something
occurred
•The way
something is
divided or
spread out
Frequency Distribution
• -a tabulation of grouping data
that shows the different values
of the variable.
Class
The classification of values or
categories
-start from the least value
Class Interval
Numerical width (number of
values on a certain class)
Cumulative Frequency
(<cf) this can be obtained by
taking the sum of the frequency
of the class and the frequencies
of the lower classes.
Relative Frequency
•Is the frequency divided by the
total frequency of all class
expressed as %.
1. Why is it advantageous to
group data?
2. What do the data on the table
tell us?
Analysis
Generalization
1. How do we organize data in a
frequency distribution table?
2. What are the information found
on the frequency distribution
table?
Application
Consider the midyear test scores of 45 students in
Mathematics VII. Given the set of data, make a
frequency distribution table and present your output
creatively with the following twist. Use i=5.
Criteria for Grading:
HPS
1. Creativity on - 40% -˃
16 pts.
Presentation
2. Accuracy of Data - 60%_ -˃
24 pts.
100% -˃
Assessment
Given the set of data, construct a
frequency table using intervals of 5.
34 45 37 29 20 36 20 20
34 45 40 40 34 45 40 30
30 20 29 36
Assignment
Do an advance study or research on:
How to make frequency histogram?
Let’s think!
What instances can we use the
frequency distribution table?

Organizing data in a frequency distribution table