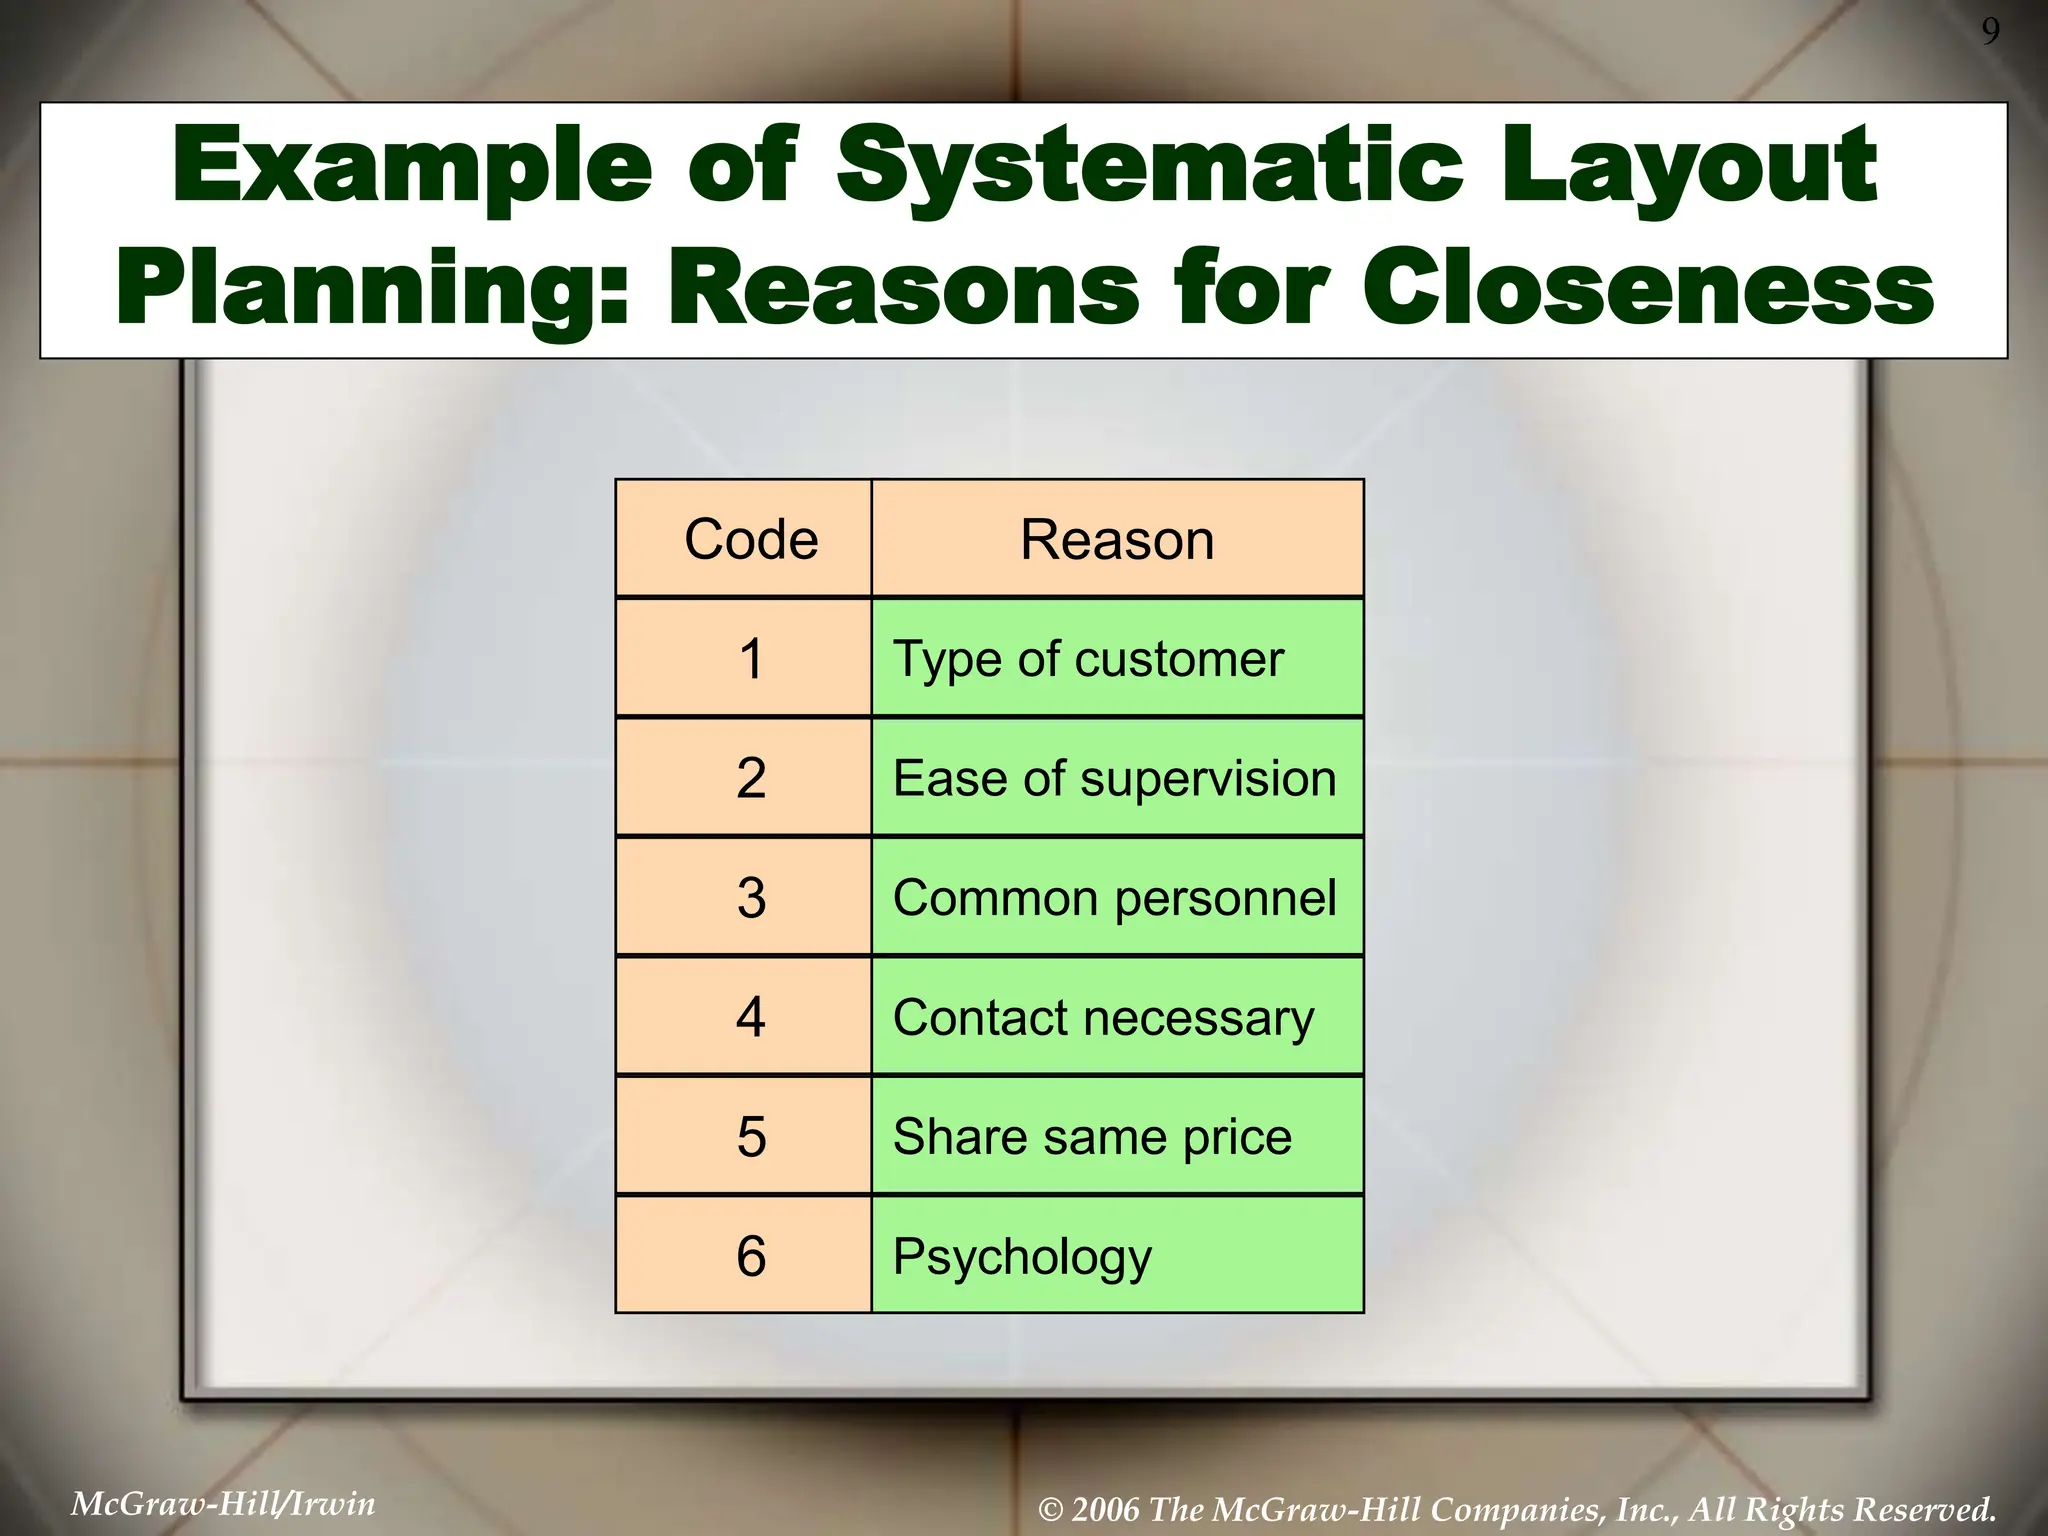
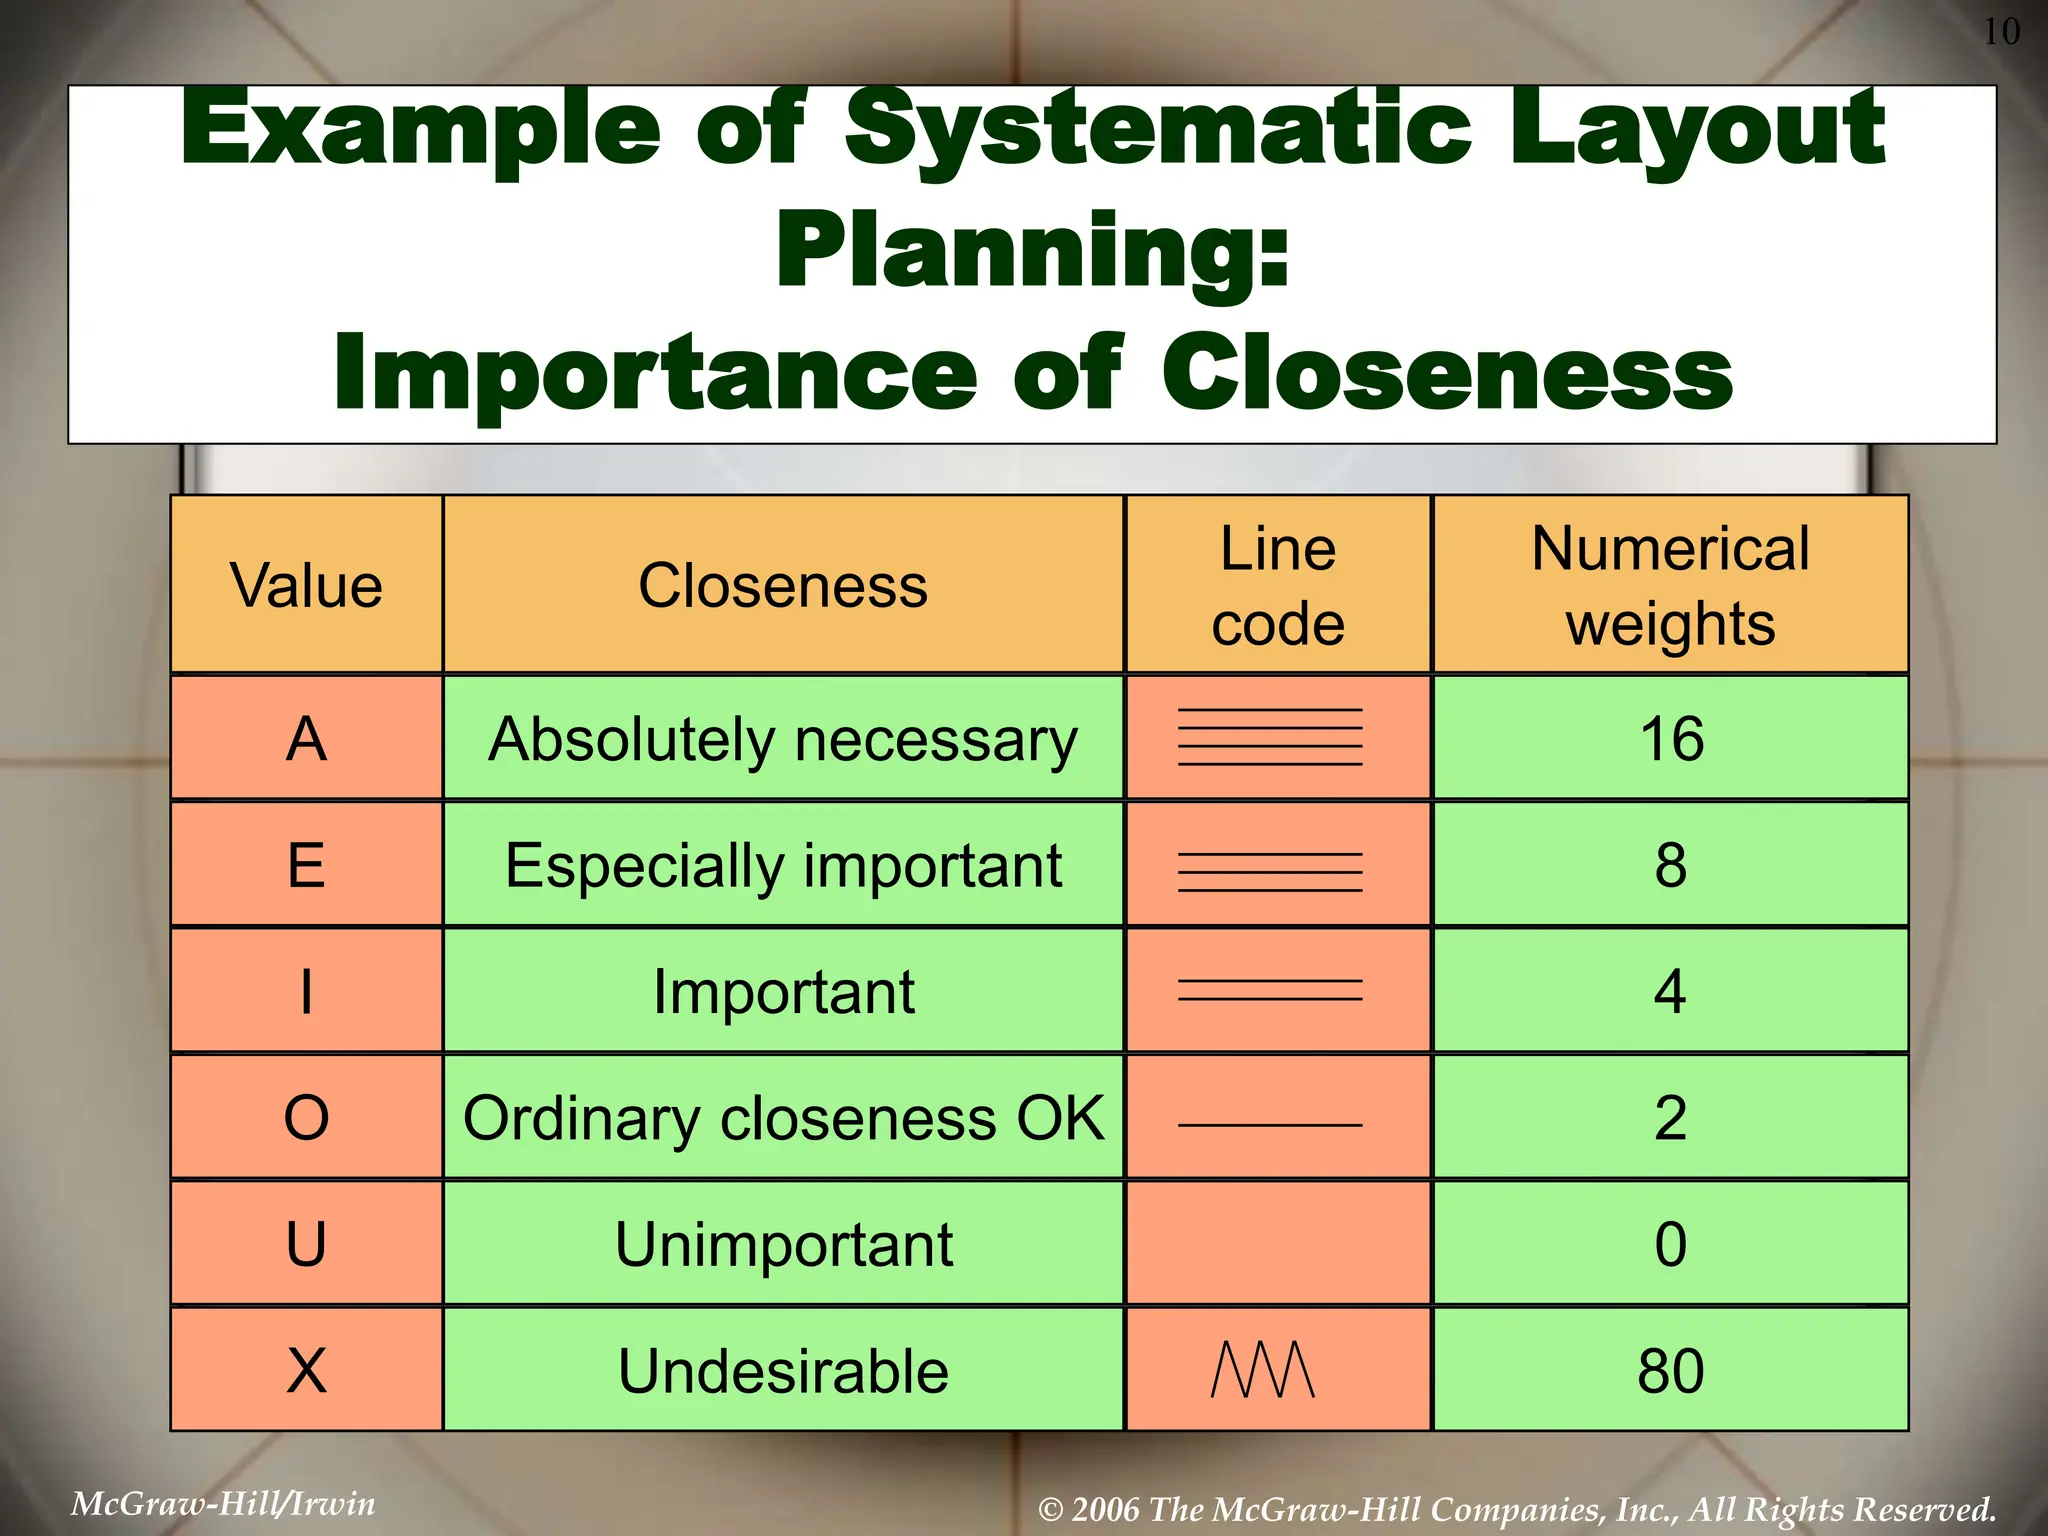
McGraw-Hill/Irwin © 2006 The McGraw-Hill Companies, Inc., All Rights Reserved.
1
McGraw-Hill/Irwin © 2006 The McGraw-Hill Companies, Inc., All Rights Reserved.
2
Technical Note 6
Facility Layout
McGraw-Hill/Irwin © 2006 The McGraw-Hill Companies, Inc., All Rights Reserved.
3
 Facility Layout and Basic Formats
 Process Layout
 Layout Planning
 Assembly Line balancing
 Service Layout
OBJECTIVES
McGraw-Hill/Irwin © 2006 The McGraw-Hill Companies, Inc., All Rights Reserved.
4
Facility Layout
Defined
Facility layout can be defined as the process by which the
placement of departments, workgroups within
departments, workstations, machines, and stock-
holding points within a facility are determined
This process requires the following inputs:
– Specification of objectives of the system in terms of output
and flexibility
– Estimation of product or service demand on the system
– Processing requirements in terms of number of operations
and amount of flow between departments and work centers
– Space requirements for the elements in the layout
– Space availability within the facility itself
McGraw-Hill/Irwin © 2006 The McGraw-Hill Companies, Inc., All Rights Reserved.
5
Basic Production Layout Formats
 Process Layout (also called job-shop or
functional layout)
 Product Layout (also called flow-shop
layout)
 Group Technology (Cellular) Layout
 Fixed-Position Layout
McGraw-Hill/Irwin © 2006 The McGraw-Hill Companies, Inc., All Rights Reserved.
6
Process Layout: Interdepartmental Flow
 Given
– The flow (number of moves) to and from all
departments
– The cost of moving from one department to
another
– The existing or planned physical layout of
the plant
 Determine
– The “best” locations for each department,
where best means maximizing flow, which
minimizing costs
McGraw-Hill/Irwin © 2006 The McGraw-Hill Companies, Inc., All Rights Reserved.
7
Process Layout: CRAFT Approach
 It is a heuristic program; it uses a simple
rule of thumb in making evaluations:
– "Compare two departments at a time and
exchange them if it reduces the total cost of
the layout."
 It does not guarantee an optimal solution
 CRAFT assumes the existence of variable
path material handling equipment such as
forklift trucks
McGraw-Hill/Irwin © 2006 The McGraw-Hill Companies, Inc., All Rights Reserved.
8
Process Layout: Systematic Layout
Planning
 Numerical flow of items between departments
– Can be impractical to obtain
– Does not account for the qualitative factors that
may be crucial to the placement decision
 Systematic Layout Planning
– Accounts for the importance of having each
department located next to every other
department
– Is also guided by trial and error
 Switching departments then checking the results of
the “closeness” score
McGraw-Hill/Irwin © 2006 The McGraw-Hill Companies, Inc., All Rights Reserved.
9
Example of Systematic Layout
Planning: Reasons for Closeness
Code
1
2
3
4
5
6
Reason
Type of customer
Ease of supervision
Common personnel
Contact necessary
Share same price
Psychology
McGraw-Hill/Irwin © 2006 The McGraw-Hill Companies, Inc., All Rights Reserved.
10
Example of Systematic Layout
Planning:
Importance of Closeness
Value
A
E
I
O
U
X
Closeness
Line
code
Numerical
weights
Absolutely necessary
Especially important
Important
Ordinary closeness OK
Unimportant
Undesirable
16
8
4
2
0
80
McGraw-Hill/Irwin © 2006 The McGraw-Hill Companies, Inc., All Rights Reserved.
11
Example of Systematic Layout Planning:
Relating Reasons and Importance
From
1. Credit department
2. Toy department
3. Wine department
4. Camera department
5. Candy department
6
I
--
U
4
A
--
U
--
U
1
I
1,6
A
--
U
1
X
1
X
To
2 3 4 5
Area
(sq. ft.)
100
400
300
100
100
Closeness rating
Reason for rating
Note here
that the (1)
Credit Dept.
and (2) Toy
Dept. are
given a high
rating of 6.
Letter
Number
Note here that
the (2) Toy Dept.
and the (5)
Candy Dept. are
given a high
rating of 6.
McGraw-Hill/Irwin © 2006 The McGraw-Hill Companies, Inc., All Rights Reserved.
12
Example of Systematic Layout Planning:
Initial Relationship Diagram
1
2
4
3
5
U U
E
A
I
The number of lines
here represent paths
required to be taken in
transactions between
the departments. The
more lines, the more
the interaction between
departments.
Note here again, Depts. (1) and
(2) are linked together, and
Depts. (2) and (5) are linked
together by multiple lines or
required transactions.
McGraw-Hill/Irwin © 2006 The McGraw-Hill Companies, Inc., All Rights Reserved.
13
Example of Systematic Layout Planning:
Initial and Final Layouts
1
2 4
3
5
Initial Layout
Ignoring space and
building constraints
2
5 1 4
3
50 ft
20 ft
Final Layout
Adjusted by square
footage and building
size
Note in the
Final Layout
that Depts.
(1) and (5)
are not both
placed
directly next
to Dept. (2).
McGraw-Hill/Irwin © 2006 The McGraw-Hill Companies, Inc., All Rights Reserved.
14
Station 1
Minutes
per Unit 6
Station 2
7
Station 3
3
Assembly Lines Balancing Concepts
Question: Suppose you load work into the three work
stations below such that each will take the corresponding
number of minutes as shown. What is the cycle time of
this line?
Answer: The cycle time of the line is always
determined by the work station taking the longest
time. In this problem, the cycle time of the line is 7
minutes. There is also going to be idle time at the
other two work stations.
McGraw-Hill/Irwin © 2006 The McGraw-Hill Companies, Inc., All Rights Reserved.
15
Example of Line Balancing
 You’ve just been assigned the job a setting up
an electric fan assembly line with the
following tasks:
Task Time (Mins) Description Predecessors
A 2 Assemble frame None
B 1 Mount switch A
C 3.25 Assemble motor housing None
D 1.2 Mount motor housing in frame A, C
E 0.5 Attach blade D
F 1 Assemble and attach safety grill E
G 1 Attach cord B
H 1.4 Test F, G
McGraw-Hill/Irwin © 2006 The McGraw-Hill Companies, Inc., All Rights Reserved.
16
Example of Line Balancing:
Structuring the Precedence Diagram
Task Predecessors
A None
A
B A
B
C None
C
D A, C
D
Task Predecessors
E D
E
F E
F
G B
G
H E, G
H
McGraw-Hill/Irwin © 2006 The McGraw-Hill Companies, Inc., All Rights Reserved.
17
Example of Line Balancing:
Precedence Diagram
A
C
B
D E F
G
H
2
3.25
1
1.2 .5
1
1.4
1
Question: Which process step defines the maximum
rate of production?
Answer: Task C is the cycle time of the line and
therefore, the maximum rate of production.
McGraw-Hill/Irwin © 2006 The McGraw-Hill Companies, Inc., All Rights Reserved.
19
Example of Line Balancing: Determine
Cycle Time
Required Cycle Time, C =
Production time per period
Required output per period
C =
420 mins / day
100 units / day
= 4.2 mins / unit
Question: Suppose we want to
assemble 100 fans per day. What
would our cycle time have to be?
Answer:
McGraw-Hill/Irwin © 2006 The McGraw-Hill Companies, Inc., All Rights Reserved.
20
Example of Line Balancing: Determine
Theoretical Minimum Number of
Workstations
Question: What is the theoretical minimum
number of workstations for this problem?
Answer:
Theoretical Min. Number of Workstations, N
N =
Sum of task times (T)
Cycle time (C)
t
t
N =
11.35 mins / unit
4.2 mins / unit
= 2.702, or 3
t
McGraw-Hill/Irwin © 2006 The McGraw-Hill Companies, Inc., All Rights Reserved.
21
Example of Line Balancing: Rules To Follow
for Loading Workstations
 Assign tasks to station 1, then 2, etc. in sequence. Keep
assigning to a workstation ensuring that precedence is
maintained and total work is less than or equal to the
cycle time. Use the following rules to select tasks for
assignment.
 Primary: Assign tasks in order of the largest number of
following tasks
 Secondary (tie-breaking): Assign tasks in order of the
longest operating time
McGraw-Hill/Irwin © 2006 The McGraw-Hill Companies, Inc., All Rights Reserved.
22
A
C
B
D E F
G
H
2
3.25
1
1.2 .5
1
1.4
1
Station 1 Station 2 Station 3
Task Followers Time (Mins)
A 6 2
C 4 3.25
D 3 1.2
B 2 1
E 2 0.5
F 1 1
G 1 1
H 0 1.4
McGraw-Hill/Irwin © 2006 The McGraw-Hill Companies, Inc., All Rights Reserved.
23
A
C
B
D E F
G
H
2
3.25
1
1.2 .5
1
1.4
1
Station 1 Station 2 Station 3
A (4.2-2=2.2)
Task Followers Time (Mins)
A 6 2
C 4 3.25
D 3 1.2
B 2 1
E 2 0.5
F 1 1
G 1 1
H 0 1.4
McGraw-Hill/Irwin © 2006 The McGraw-Hill Companies, Inc., All Rights Reserved.
24
A
C
B
D E F
G
H
2
3.25
1
1.2 .5
1
1.4
1
A (4.2-2=2.2)
B (2.2-1=1.2)
Task Followers Time (Mins)
A 6 2
C 4 3.25
D 3 1.2
B 2 1
E 2 0.5
F 1 1
G 1 1
H 0 1.4
Station 1 Station 2 Station 3
McGraw-Hill/Irwin © 2006 The McGraw-Hill Companies, Inc., All Rights Reserved.
25
A
C
B
D E F
G
H
2
3.25
1
1.2 .5
1
1.4
1
A (4.2-2=2.2)
B (2.2-1=1.2)
G (1.2-1= .2)
Idle= .2
Task Followers Time (Mins)
A 6 2
C 4 3.25
D 3 1.2
B 2 1
E 2 0.5
F 1 1
G 1 1
H 0 1.4
Station 1 Station 2 Station 3
McGraw-Hill/Irwin © 2006 The McGraw-Hill Companies, Inc., All Rights Reserved.
26
A
C
B
D E F
G
H
2
3.25
1
1.2 .5
1
1.4
1
C (4.2-3.25)=.95
Task Followers Time (Mins)
A 6 2
C 4 3.25
D 3 1.2
B 2 1
E 2 0.5
F 1 1
G 1 1
H 0 1.4
A (4.2-2=2.2)
B (2.2-1=1.2)
G (1.2-1= .2)
Idle= .2
Station 1 Station 2 Station 3
McGraw-Hill/Irwin © 2006 The McGraw-Hill Companies, Inc., All Rights Reserved.
27
C (4.2-3.25)=.95
Idle = .95
A
C
B
D E F
G
H
2
3.25
1
1.2 .5
1
1.4
1
Task Followers Time (Mins)
A 6 2
C 4 3.25
D 3 1.2
B 2 1
E 2 0.5
F 1 1
G 1 1
H 0 1.4
A (4.2-2=2.2)
B (2.2-1=1.2)
G (1.2-1= .2)
Idle= .2
Station 1 Station 2 Station 3
McGraw-Hill/Irwin © 2006 The McGraw-Hill Companies, Inc., All Rights Reserved.
28
C (4.2-3.25)=.95
Idle = .95
A
C
B
D E F
G
H
2
3.25
1
1.2 .5
1
1.4
1
D (4.2-1.2)=3
Task Followers Time (Mins)
A 6 2
C 4 3.25
D 3 1.2
B 2 1
E 2 0.5
F 1 1
G 1 1
H 0 1.4
A (4.2-2=2.2)
B (2.2-1=1.2)
G (1.2-1= .2)
Idle= .2
Station 1 Station 2 Station 3
McGraw-Hill/Irwin © 2006 The McGraw-Hill Companies, Inc., All Rights Reserved.
29
A
C
B
D E F
G
H
2
3.25
1
1.2 .5
1
1.4
1
C (4.2-3.25)=.95
Idle = .95
D (4.2-1.2)=3
E (3-.5)=2.5
Task Followers Time (Mins)
A 6 2
C 4 3.25
D 3 1.2
B 2 1
E 2 0.5
F 1 1
G 1 1
H 0 1.4
A (4.2-2=2.2)
B (2.2-1=1.2)
G (1.2-1= .2)
Idle= .2
Station 1 Station 2 Station 3
McGraw-Hill/Irwin © 2006 The McGraw-Hill Companies, Inc., All Rights Reserved.
30
A
C
B
D E F
G
H
2
3.25
1
1.2 .5
1
1.4
1
C (4.2-3.25)=.95
Idle = .95
D (4.2-1.2)=3
E (3-.5)=2.5
F (2.5-1)=1.5
Task Followers Time (Mins)
A 6 2
C 4 3.25
D 3 1.2
B 2 1
E 2 0.5
F 1 1
G 1 1
H 0 1.4
A (4.2-2=2.2)
B (2.2-1=1.2)
G (1.2-1= .2)
Idle= .2
Station 1 Station 2 Station 3
McGraw-Hill/Irwin © 2006 The McGraw-Hill Companies, Inc., All Rights Reserved.
31
A
C
B
D E F
G
H
2
3.25
1
1.2 .5
1
1.4
1
C (4.2-3.25)=.95
Idle = .95
D (4.2-1.2)=3
E (3-.5)=2.5
F (2.5-1)=1.5
H (1.5-1.4)=.1
Idle = .1
Task Followers Time (Mins)
A 6 2
C 4 3.25
D 3 1.2
B 2 1
E 2 0.5
F 1 1
G 1 1
H 0 1.4
A (4.2-2=2.2)
B (2.2-1=1.2)
G (1.2-1= .2)
Idle= .2
Station 1 Station 2 Station 3
Which station is the bottleneck? What is the effective cycle time?
McGraw-Hill/Irwin © 2006 The McGraw-Hill Companies, Inc., All Rights Reserved.
32
Example of Line Balancing: Determine the
Efficiency of the Assembly Line
Efficiency =
Sum of task times (T)
Actual number of workstations (Na) x Cycle time (C)
Efficiency =
11.35 mins / unit
(3)(4.2mins / unit)
=.901
McGraw-Hill/Irwin © 2006 The McGraw-Hill Companies, Inc., All Rights Reserved.
33
McGraw-Hill/Irwin © 2006 The McGraw-Hill Companies, Inc., All Rights Reserved.
34
McGraw-Hill/Irwin © 2006 The McGraw-Hill Companies, Inc., All Rights Reserved.
35
Group Technology:
Benefits
1. Better human relations
2. Improved operator expertise
3. Less in-process inventory and
material handling
4. Faster production setup
McGraw-Hill/Irwin © 2006 The McGraw-Hill Companies, Inc., All Rights Reserved.
36
Group Technology:
Transition from Process Layout
1. Grouping parts into families that
follow a common sequence of steps
2. Identifying dominant flow patterns
of parts families as a basis for
location or relocation of processes
3. Physically grouping machines and
processes into cells
McGraw-Hill/Irwin © 2006 The McGraw-Hill Companies, Inc., All Rights Reserved.
37
Fixed Position Layout
Question: What are our primary
considerations for a fixed position
layout?
Answer: Arranging materials and equipment
concentrically around the production point in
their order of use.
McGraw-Hill/Irwin © 2006 The McGraw-Hill Companies, Inc., All Rights Reserved.
38
Retail Service Layout
 Goal--maximize net profit per
square foot of floor space
 Servicescapes
– Ambient Conditions
– Spatial Layout and Functionality
– Signs, Symbols, and Artifacts
McGraw-Hill/Irwin © 2006 The McGraw-Hill Companies, Inc., All Rights Reserved.
39
End of Technical Note 6

OPERATIONS MANAGEMENT FOR COMPETITIVE ADVANTAGE

  • 1.
    McGraw-Hill/Irwin © 2006The McGraw-Hill Companies, Inc., All Rights Reserved. 1
  • 2.
    McGraw-Hill/Irwin © 2006The McGraw-Hill Companies, Inc., All Rights Reserved. 2 Technical Note 6 Facility Layout
  • 3.
    McGraw-Hill/Irwin © 2006The McGraw-Hill Companies, Inc., All Rights Reserved. 3  Facility Layout and Basic Formats  Process Layout  Layout Planning  Assembly Line balancing  Service Layout OBJECTIVES
  • 4.
    McGraw-Hill/Irwin © 2006The McGraw-Hill Companies, Inc., All Rights Reserved. 4 Facility Layout Defined Facility layout can be defined as the process by which the placement of departments, workgroups within departments, workstations, machines, and stock- holding points within a facility are determined This process requires the following inputs: – Specification of objectives of the system in terms of output and flexibility – Estimation of product or service demand on the system – Processing requirements in terms of number of operations and amount of flow between departments and work centers – Space requirements for the elements in the layout – Space availability within the facility itself
  • 5.
    McGraw-Hill/Irwin © 2006The McGraw-Hill Companies, Inc., All Rights Reserved. 5 Basic Production Layout Formats  Process Layout (also called job-shop or functional layout)  Product Layout (also called flow-shop layout)  Group Technology (Cellular) Layout  Fixed-Position Layout
  • 6.
    McGraw-Hill/Irwin © 2006The McGraw-Hill Companies, Inc., All Rights Reserved. 6 Process Layout: Interdepartmental Flow  Given – The flow (number of moves) to and from all departments – The cost of moving from one department to another – The existing or planned physical layout of the plant  Determine – The “best” locations for each department, where best means maximizing flow, which minimizing costs
  • 7.
    McGraw-Hill/Irwin © 2006The McGraw-Hill Companies, Inc., All Rights Reserved. 7 Process Layout: CRAFT Approach  It is a heuristic program; it uses a simple rule of thumb in making evaluations: – "Compare two departments at a time and exchange them if it reduces the total cost of the layout."  It does not guarantee an optimal solution  CRAFT assumes the existence of variable path material handling equipment such as forklift trucks
  • 8.
    McGraw-Hill/Irwin © 2006The McGraw-Hill Companies, Inc., All Rights Reserved. 8 Process Layout: Systematic Layout Planning  Numerical flow of items between departments – Can be impractical to obtain – Does not account for the qualitative factors that may be crucial to the placement decision  Systematic Layout Planning – Accounts for the importance of having each department located next to every other department – Is also guided by trial and error  Switching departments then checking the results of the “closeness” score
  • 9.
    McGraw-Hill/Irwin © 2006The McGraw-Hill Companies, Inc., All Rights Reserved. 9 Example of Systematic Layout Planning: Reasons for Closeness Code 1 2 3 4 5 6 Reason Type of customer Ease of supervision Common personnel Contact necessary Share same price Psychology
  • 10.
    McGraw-Hill/Irwin © 2006The McGraw-Hill Companies, Inc., All Rights Reserved. 10 Example of Systematic Layout Planning: Importance of Closeness Value A E I O U X Closeness Line code Numerical weights Absolutely necessary Especially important Important Ordinary closeness OK Unimportant Undesirable 16 8 4 2 0 80
  • 11.
    McGraw-Hill/Irwin © 2006The McGraw-Hill Companies, Inc., All Rights Reserved. 11 Example of Systematic Layout Planning: Relating Reasons and Importance From 1. Credit department 2. Toy department 3. Wine department 4. Camera department 5. Candy department 6 I -- U 4 A -- U -- U 1 I 1,6 A -- U 1 X 1 X To 2 3 4 5 Area (sq. ft.) 100 400 300 100 100 Closeness rating Reason for rating Note here that the (1) Credit Dept. and (2) Toy Dept. are given a high rating of 6. Letter Number Note here that the (2) Toy Dept. and the (5) Candy Dept. are given a high rating of 6.
  • 12.
    McGraw-Hill/Irwin © 2006The McGraw-Hill Companies, Inc., All Rights Reserved. 12 Example of Systematic Layout Planning: Initial Relationship Diagram 1 2 4 3 5 U U E A I The number of lines here represent paths required to be taken in transactions between the departments. The more lines, the more the interaction between departments. Note here again, Depts. (1) and (2) are linked together, and Depts. (2) and (5) are linked together by multiple lines or required transactions.
  • 13.
    McGraw-Hill/Irwin © 2006The McGraw-Hill Companies, Inc., All Rights Reserved. 13 Example of Systematic Layout Planning: Initial and Final Layouts 1 2 4 3 5 Initial Layout Ignoring space and building constraints 2 5 1 4 3 50 ft 20 ft Final Layout Adjusted by square footage and building size Note in the Final Layout that Depts. (1) and (5) are not both placed directly next to Dept. (2).
  • 14.
    McGraw-Hill/Irwin © 2006The McGraw-Hill Companies, Inc., All Rights Reserved. 14 Station 1 Minutes per Unit 6 Station 2 7 Station 3 3 Assembly Lines Balancing Concepts Question: Suppose you load work into the three work stations below such that each will take the corresponding number of minutes as shown. What is the cycle time of this line? Answer: The cycle time of the line is always determined by the work station taking the longest time. In this problem, the cycle time of the line is 7 minutes. There is also going to be idle time at the other two work stations.
  • 15.
    McGraw-Hill/Irwin © 2006The McGraw-Hill Companies, Inc., All Rights Reserved. 15 Example of Line Balancing  You’ve just been assigned the job a setting up an electric fan assembly line with the following tasks: Task Time (Mins) Description Predecessors A 2 Assemble frame None B 1 Mount switch A C 3.25 Assemble motor housing None D 1.2 Mount motor housing in frame A, C E 0.5 Attach blade D F 1 Assemble and attach safety grill E G 1 Attach cord B H 1.4 Test F, G
  • 16.
    McGraw-Hill/Irwin © 2006The McGraw-Hill Companies, Inc., All Rights Reserved. 16 Example of Line Balancing: Structuring the Precedence Diagram Task Predecessors A None A B A B C None C D A, C D Task Predecessors E D E F E F G B G H E, G H
  • 17.
    McGraw-Hill/Irwin © 2006The McGraw-Hill Companies, Inc., All Rights Reserved. 17 Example of Line Balancing: Precedence Diagram A C B D E F G H 2 3.25 1 1.2 .5 1 1.4 1 Question: Which process step defines the maximum rate of production? Answer: Task C is the cycle time of the line and therefore, the maximum rate of production.
  • 18.
    McGraw-Hill/Irwin © 2006The McGraw-Hill Companies, Inc., All Rights Reserved. 19 Example of Line Balancing: Determine Cycle Time Required Cycle Time, C = Production time per period Required output per period C = 420 mins / day 100 units / day = 4.2 mins / unit Question: Suppose we want to assemble 100 fans per day. What would our cycle time have to be? Answer:
  • 19.
    McGraw-Hill/Irwin © 2006The McGraw-Hill Companies, Inc., All Rights Reserved. 20 Example of Line Balancing: Determine Theoretical Minimum Number of Workstations Question: What is the theoretical minimum number of workstations for this problem? Answer: Theoretical Min. Number of Workstations, N N = Sum of task times (T) Cycle time (C) t t N = 11.35 mins / unit 4.2 mins / unit = 2.702, or 3 t
  • 20.
    McGraw-Hill/Irwin © 2006The McGraw-Hill Companies, Inc., All Rights Reserved. 21 Example of Line Balancing: Rules To Follow for Loading Workstations  Assign tasks to station 1, then 2, etc. in sequence. Keep assigning to a workstation ensuring that precedence is maintained and total work is less than or equal to the cycle time. Use the following rules to select tasks for assignment.  Primary: Assign tasks in order of the largest number of following tasks  Secondary (tie-breaking): Assign tasks in order of the longest operating time
  • 21.
    McGraw-Hill/Irwin © 2006The McGraw-Hill Companies, Inc., All Rights Reserved. 22 A C B D E F G H 2 3.25 1 1.2 .5 1 1.4 1 Station 1 Station 2 Station 3 Task Followers Time (Mins) A 6 2 C 4 3.25 D 3 1.2 B 2 1 E 2 0.5 F 1 1 G 1 1 H 0 1.4
  • 22.
    McGraw-Hill/Irwin © 2006The McGraw-Hill Companies, Inc., All Rights Reserved. 23 A C B D E F G H 2 3.25 1 1.2 .5 1 1.4 1 Station 1 Station 2 Station 3 A (4.2-2=2.2) Task Followers Time (Mins) A 6 2 C 4 3.25 D 3 1.2 B 2 1 E 2 0.5 F 1 1 G 1 1 H 0 1.4
  • 23.
    McGraw-Hill/Irwin © 2006The McGraw-Hill Companies, Inc., All Rights Reserved. 24 A C B D E F G H 2 3.25 1 1.2 .5 1 1.4 1 A (4.2-2=2.2) B (2.2-1=1.2) Task Followers Time (Mins) A 6 2 C 4 3.25 D 3 1.2 B 2 1 E 2 0.5 F 1 1 G 1 1 H 0 1.4 Station 1 Station 2 Station 3
  • 24.
    McGraw-Hill/Irwin © 2006The McGraw-Hill Companies, Inc., All Rights Reserved. 25 A C B D E F G H 2 3.25 1 1.2 .5 1 1.4 1 A (4.2-2=2.2) B (2.2-1=1.2) G (1.2-1= .2) Idle= .2 Task Followers Time (Mins) A 6 2 C 4 3.25 D 3 1.2 B 2 1 E 2 0.5 F 1 1 G 1 1 H 0 1.4 Station 1 Station 2 Station 3
  • 25.
    McGraw-Hill/Irwin © 2006The McGraw-Hill Companies, Inc., All Rights Reserved. 26 A C B D E F G H 2 3.25 1 1.2 .5 1 1.4 1 C (4.2-3.25)=.95 Task Followers Time (Mins) A 6 2 C 4 3.25 D 3 1.2 B 2 1 E 2 0.5 F 1 1 G 1 1 H 0 1.4 A (4.2-2=2.2) B (2.2-1=1.2) G (1.2-1= .2) Idle= .2 Station 1 Station 2 Station 3
  • 26.
    McGraw-Hill/Irwin © 2006The McGraw-Hill Companies, Inc., All Rights Reserved. 27 C (4.2-3.25)=.95 Idle = .95 A C B D E F G H 2 3.25 1 1.2 .5 1 1.4 1 Task Followers Time (Mins) A 6 2 C 4 3.25 D 3 1.2 B 2 1 E 2 0.5 F 1 1 G 1 1 H 0 1.4 A (4.2-2=2.2) B (2.2-1=1.2) G (1.2-1= .2) Idle= .2 Station 1 Station 2 Station 3
  • 27.
    McGraw-Hill/Irwin © 2006The McGraw-Hill Companies, Inc., All Rights Reserved. 28 C (4.2-3.25)=.95 Idle = .95 A C B D E F G H 2 3.25 1 1.2 .5 1 1.4 1 D (4.2-1.2)=3 Task Followers Time (Mins) A 6 2 C 4 3.25 D 3 1.2 B 2 1 E 2 0.5 F 1 1 G 1 1 H 0 1.4 A (4.2-2=2.2) B (2.2-1=1.2) G (1.2-1= .2) Idle= .2 Station 1 Station 2 Station 3
  • 28.
    McGraw-Hill/Irwin © 2006The McGraw-Hill Companies, Inc., All Rights Reserved. 29 A C B D E F G H 2 3.25 1 1.2 .5 1 1.4 1 C (4.2-3.25)=.95 Idle = .95 D (4.2-1.2)=3 E (3-.5)=2.5 Task Followers Time (Mins) A 6 2 C 4 3.25 D 3 1.2 B 2 1 E 2 0.5 F 1 1 G 1 1 H 0 1.4 A (4.2-2=2.2) B (2.2-1=1.2) G (1.2-1= .2) Idle= .2 Station 1 Station 2 Station 3
  • 29.
    McGraw-Hill/Irwin © 2006The McGraw-Hill Companies, Inc., All Rights Reserved. 30 A C B D E F G H 2 3.25 1 1.2 .5 1 1.4 1 C (4.2-3.25)=.95 Idle = .95 D (4.2-1.2)=3 E (3-.5)=2.5 F (2.5-1)=1.5 Task Followers Time (Mins) A 6 2 C 4 3.25 D 3 1.2 B 2 1 E 2 0.5 F 1 1 G 1 1 H 0 1.4 A (4.2-2=2.2) B (2.2-1=1.2) G (1.2-1= .2) Idle= .2 Station 1 Station 2 Station 3
  • 30.
    McGraw-Hill/Irwin © 2006The McGraw-Hill Companies, Inc., All Rights Reserved. 31 A C B D E F G H 2 3.25 1 1.2 .5 1 1.4 1 C (4.2-3.25)=.95 Idle = .95 D (4.2-1.2)=3 E (3-.5)=2.5 F (2.5-1)=1.5 H (1.5-1.4)=.1 Idle = .1 Task Followers Time (Mins) A 6 2 C 4 3.25 D 3 1.2 B 2 1 E 2 0.5 F 1 1 G 1 1 H 0 1.4 A (4.2-2=2.2) B (2.2-1=1.2) G (1.2-1= .2) Idle= .2 Station 1 Station 2 Station 3 Which station is the bottleneck? What is the effective cycle time?
  • 31.
    McGraw-Hill/Irwin © 2006The McGraw-Hill Companies, Inc., All Rights Reserved. 32 Example of Line Balancing: Determine the Efficiency of the Assembly Line Efficiency = Sum of task times (T) Actual number of workstations (Na) x Cycle time (C) Efficiency = 11.35 mins / unit (3)(4.2mins / unit) =.901
  • 32.
    McGraw-Hill/Irwin © 2006The McGraw-Hill Companies, Inc., All Rights Reserved. 33
  • 33.
    McGraw-Hill/Irwin © 2006The McGraw-Hill Companies, Inc., All Rights Reserved. 34
  • 34.
    McGraw-Hill/Irwin © 2006The McGraw-Hill Companies, Inc., All Rights Reserved. 35 Group Technology: Benefits 1. Better human relations 2. Improved operator expertise 3. Less in-process inventory and material handling 4. Faster production setup
  • 35.
    McGraw-Hill/Irwin © 2006The McGraw-Hill Companies, Inc., All Rights Reserved. 36 Group Technology: Transition from Process Layout 1. Grouping parts into families that follow a common sequence of steps 2. Identifying dominant flow patterns of parts families as a basis for location or relocation of processes 3. Physically grouping machines and processes into cells
  • 36.
    McGraw-Hill/Irwin © 2006The McGraw-Hill Companies, Inc., All Rights Reserved. 37 Fixed Position Layout Question: What are our primary considerations for a fixed position layout? Answer: Arranging materials and equipment concentrically around the production point in their order of use.
  • 37.
    McGraw-Hill/Irwin © 2006The McGraw-Hill Companies, Inc., All Rights Reserved. 38 Retail Service Layout  Goal--maximize net profit per square foot of floor space  Servicescapes – Ambient Conditions – Spatial Layout and Functionality – Signs, Symbols, and Artifacts
  • 38.
    McGraw-Hill/Irwin © 2006The McGraw-Hill Companies, Inc., All Rights Reserved. 39 End of Technical Note 6