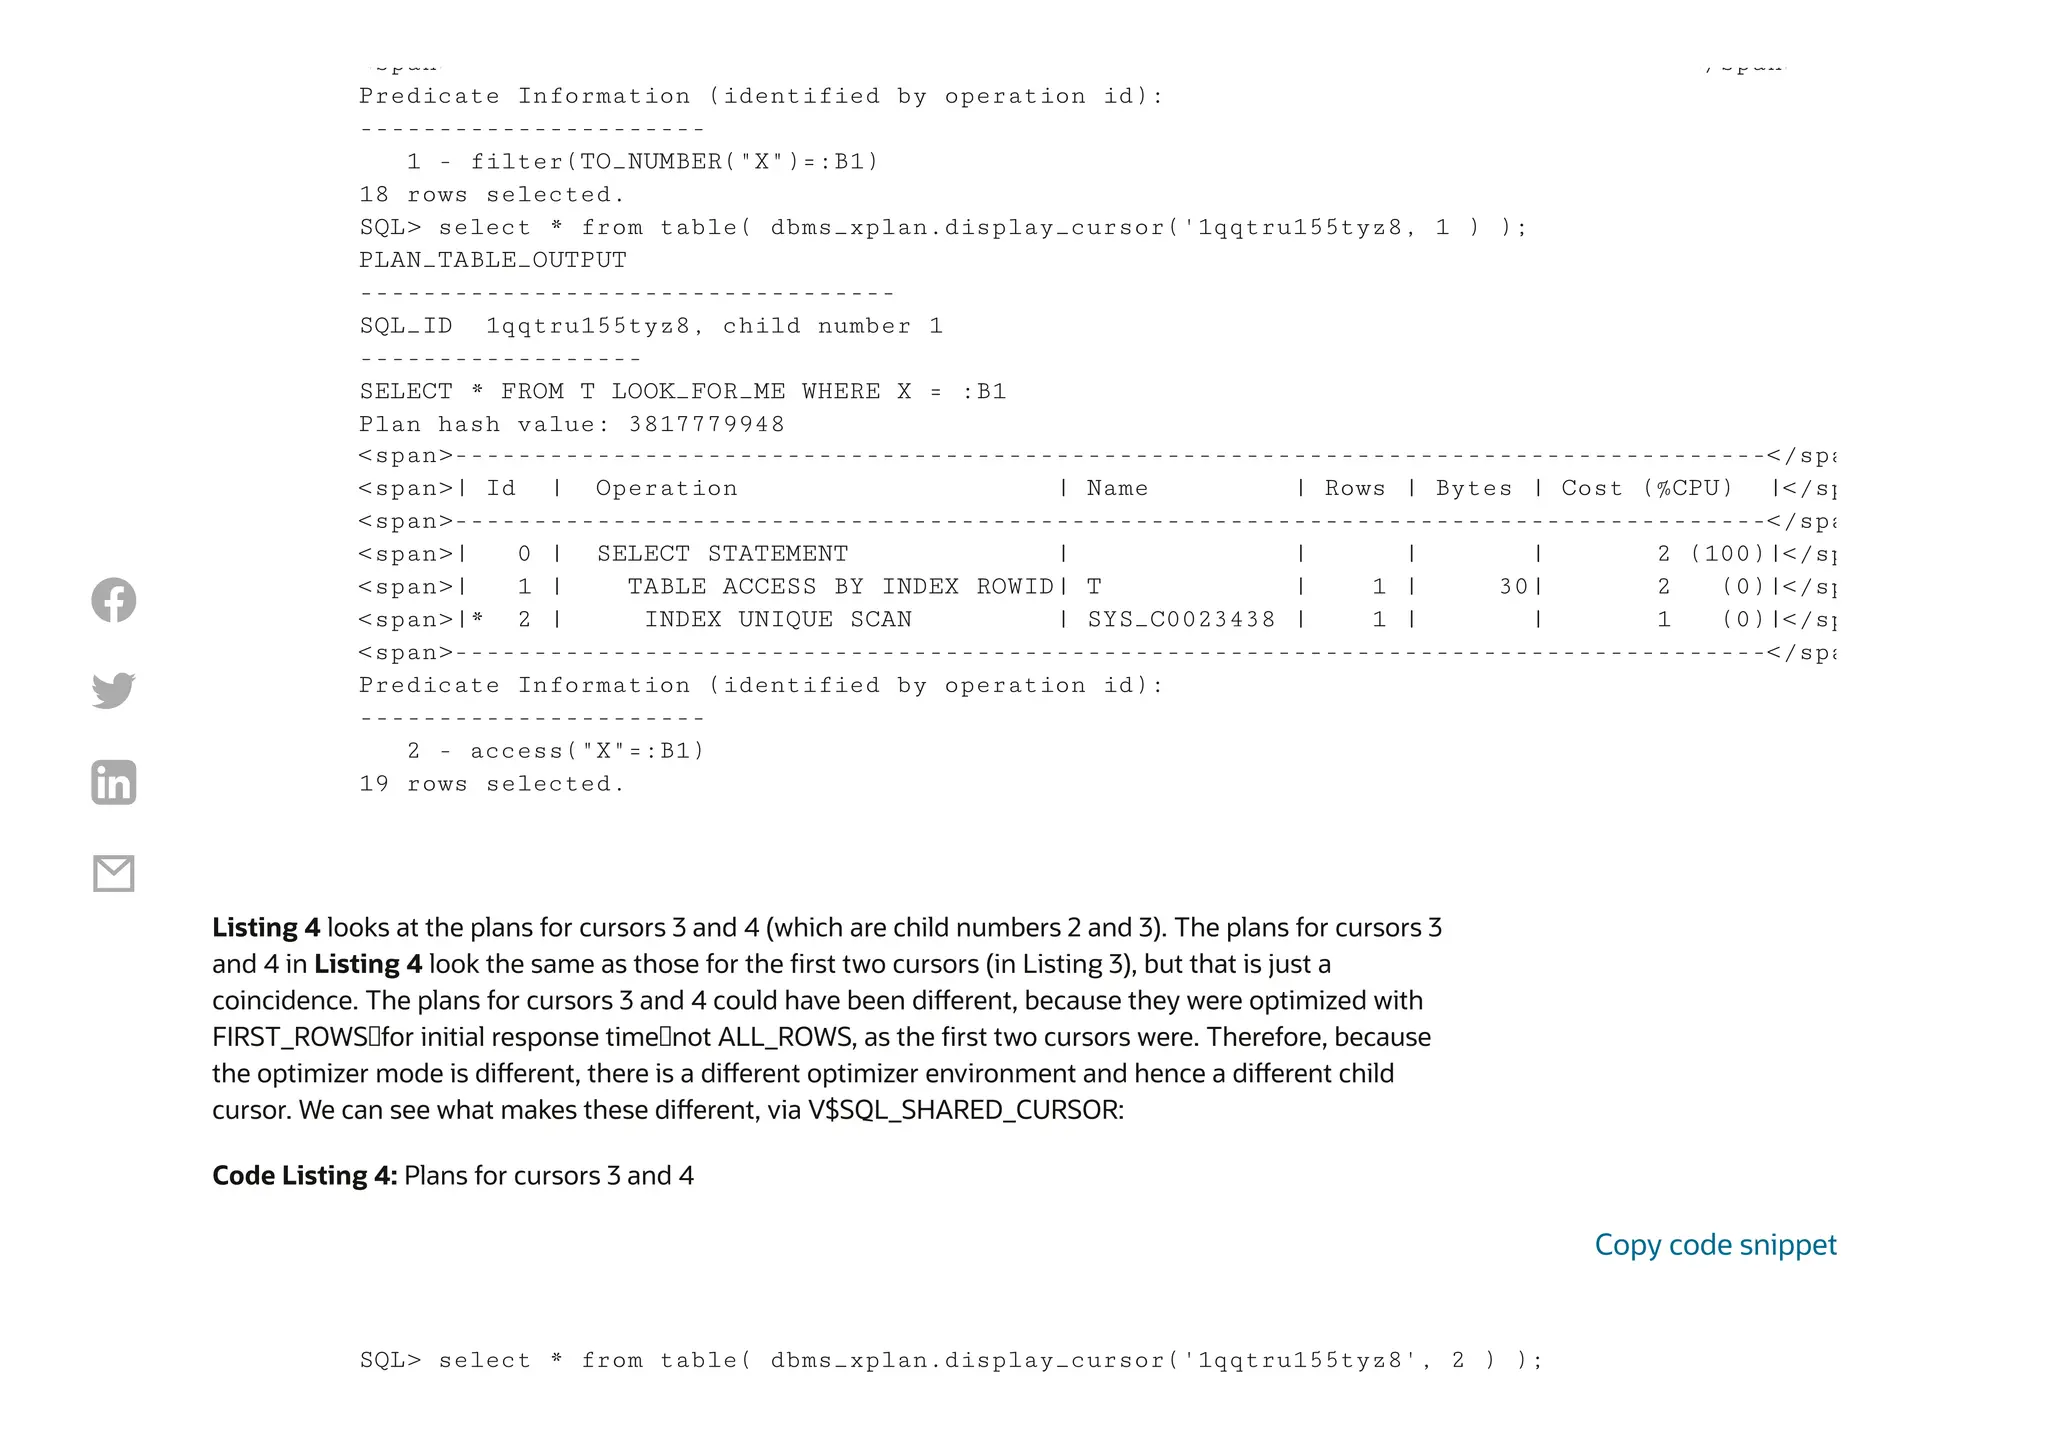
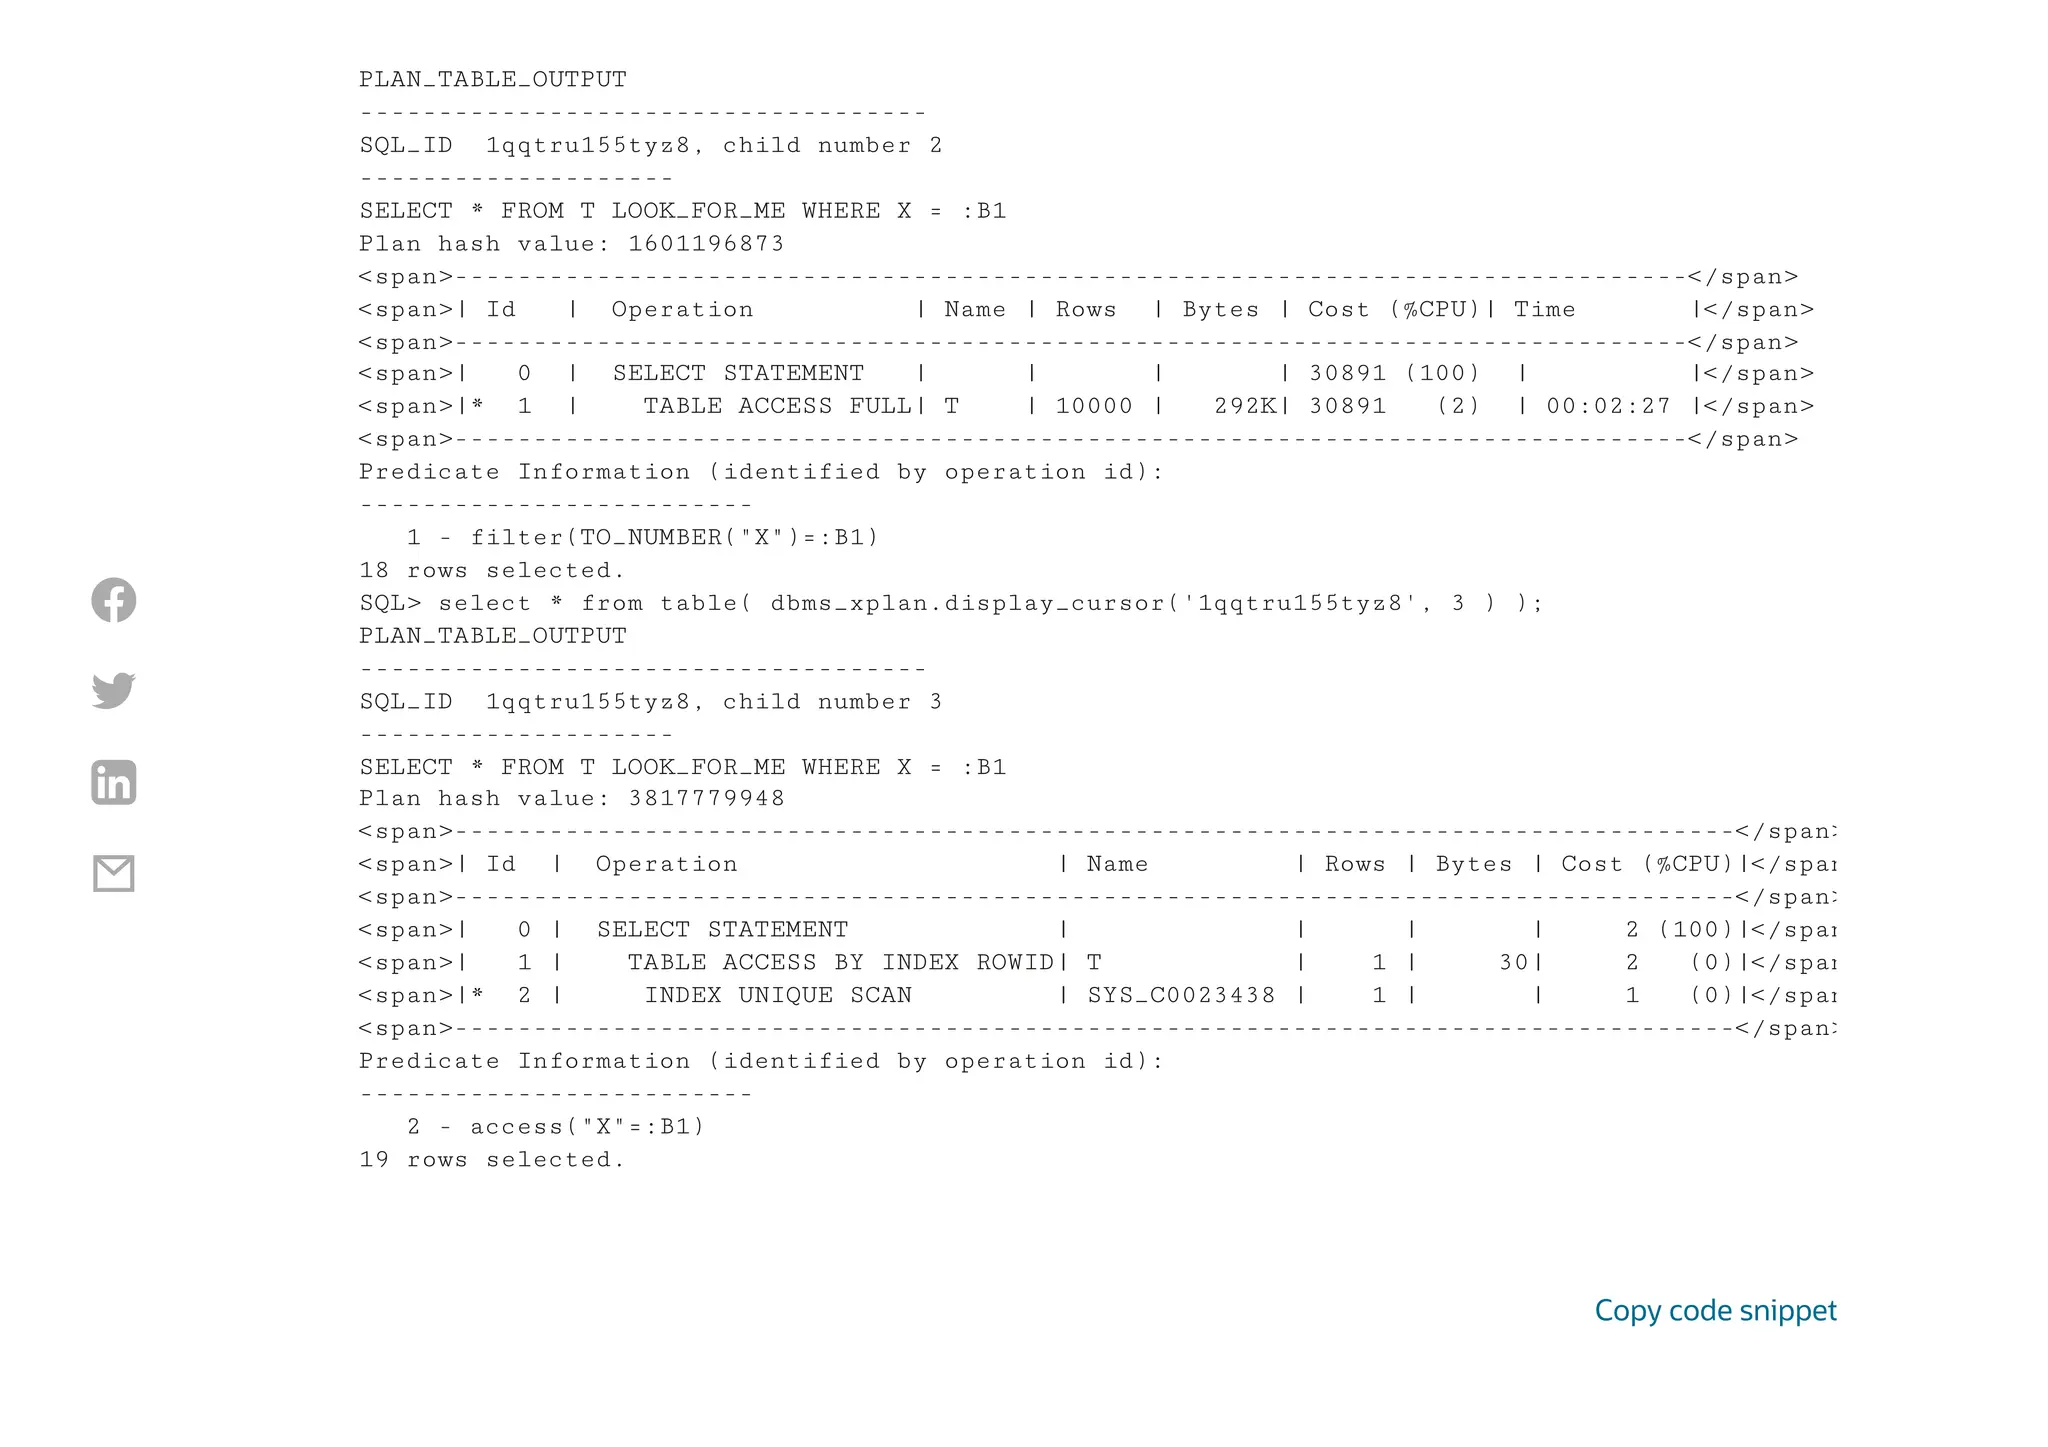
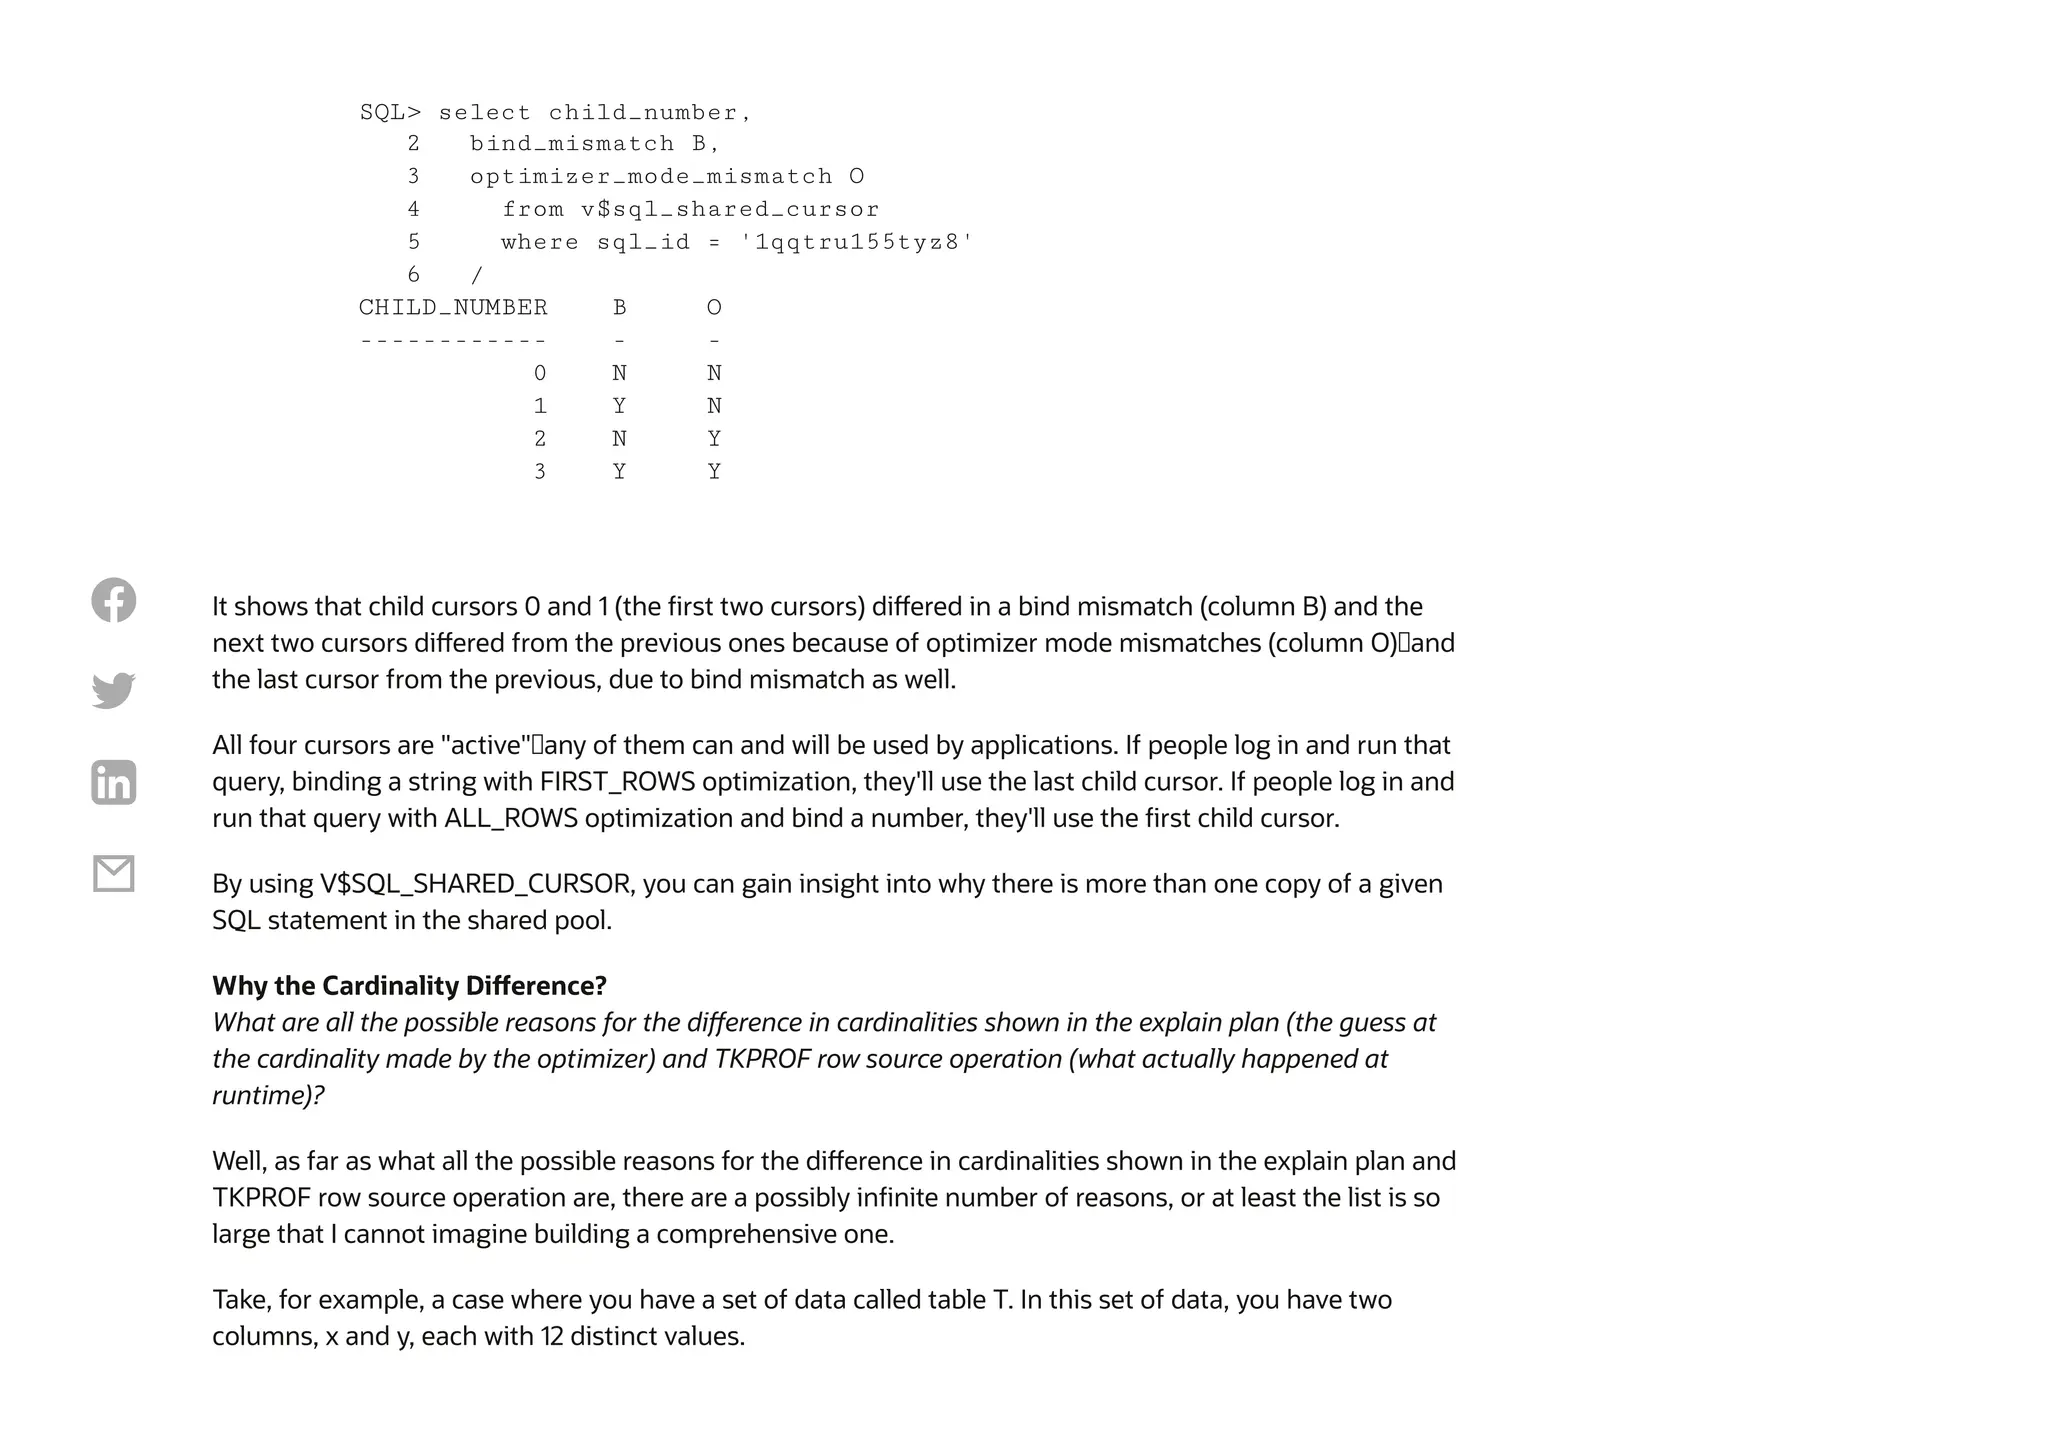
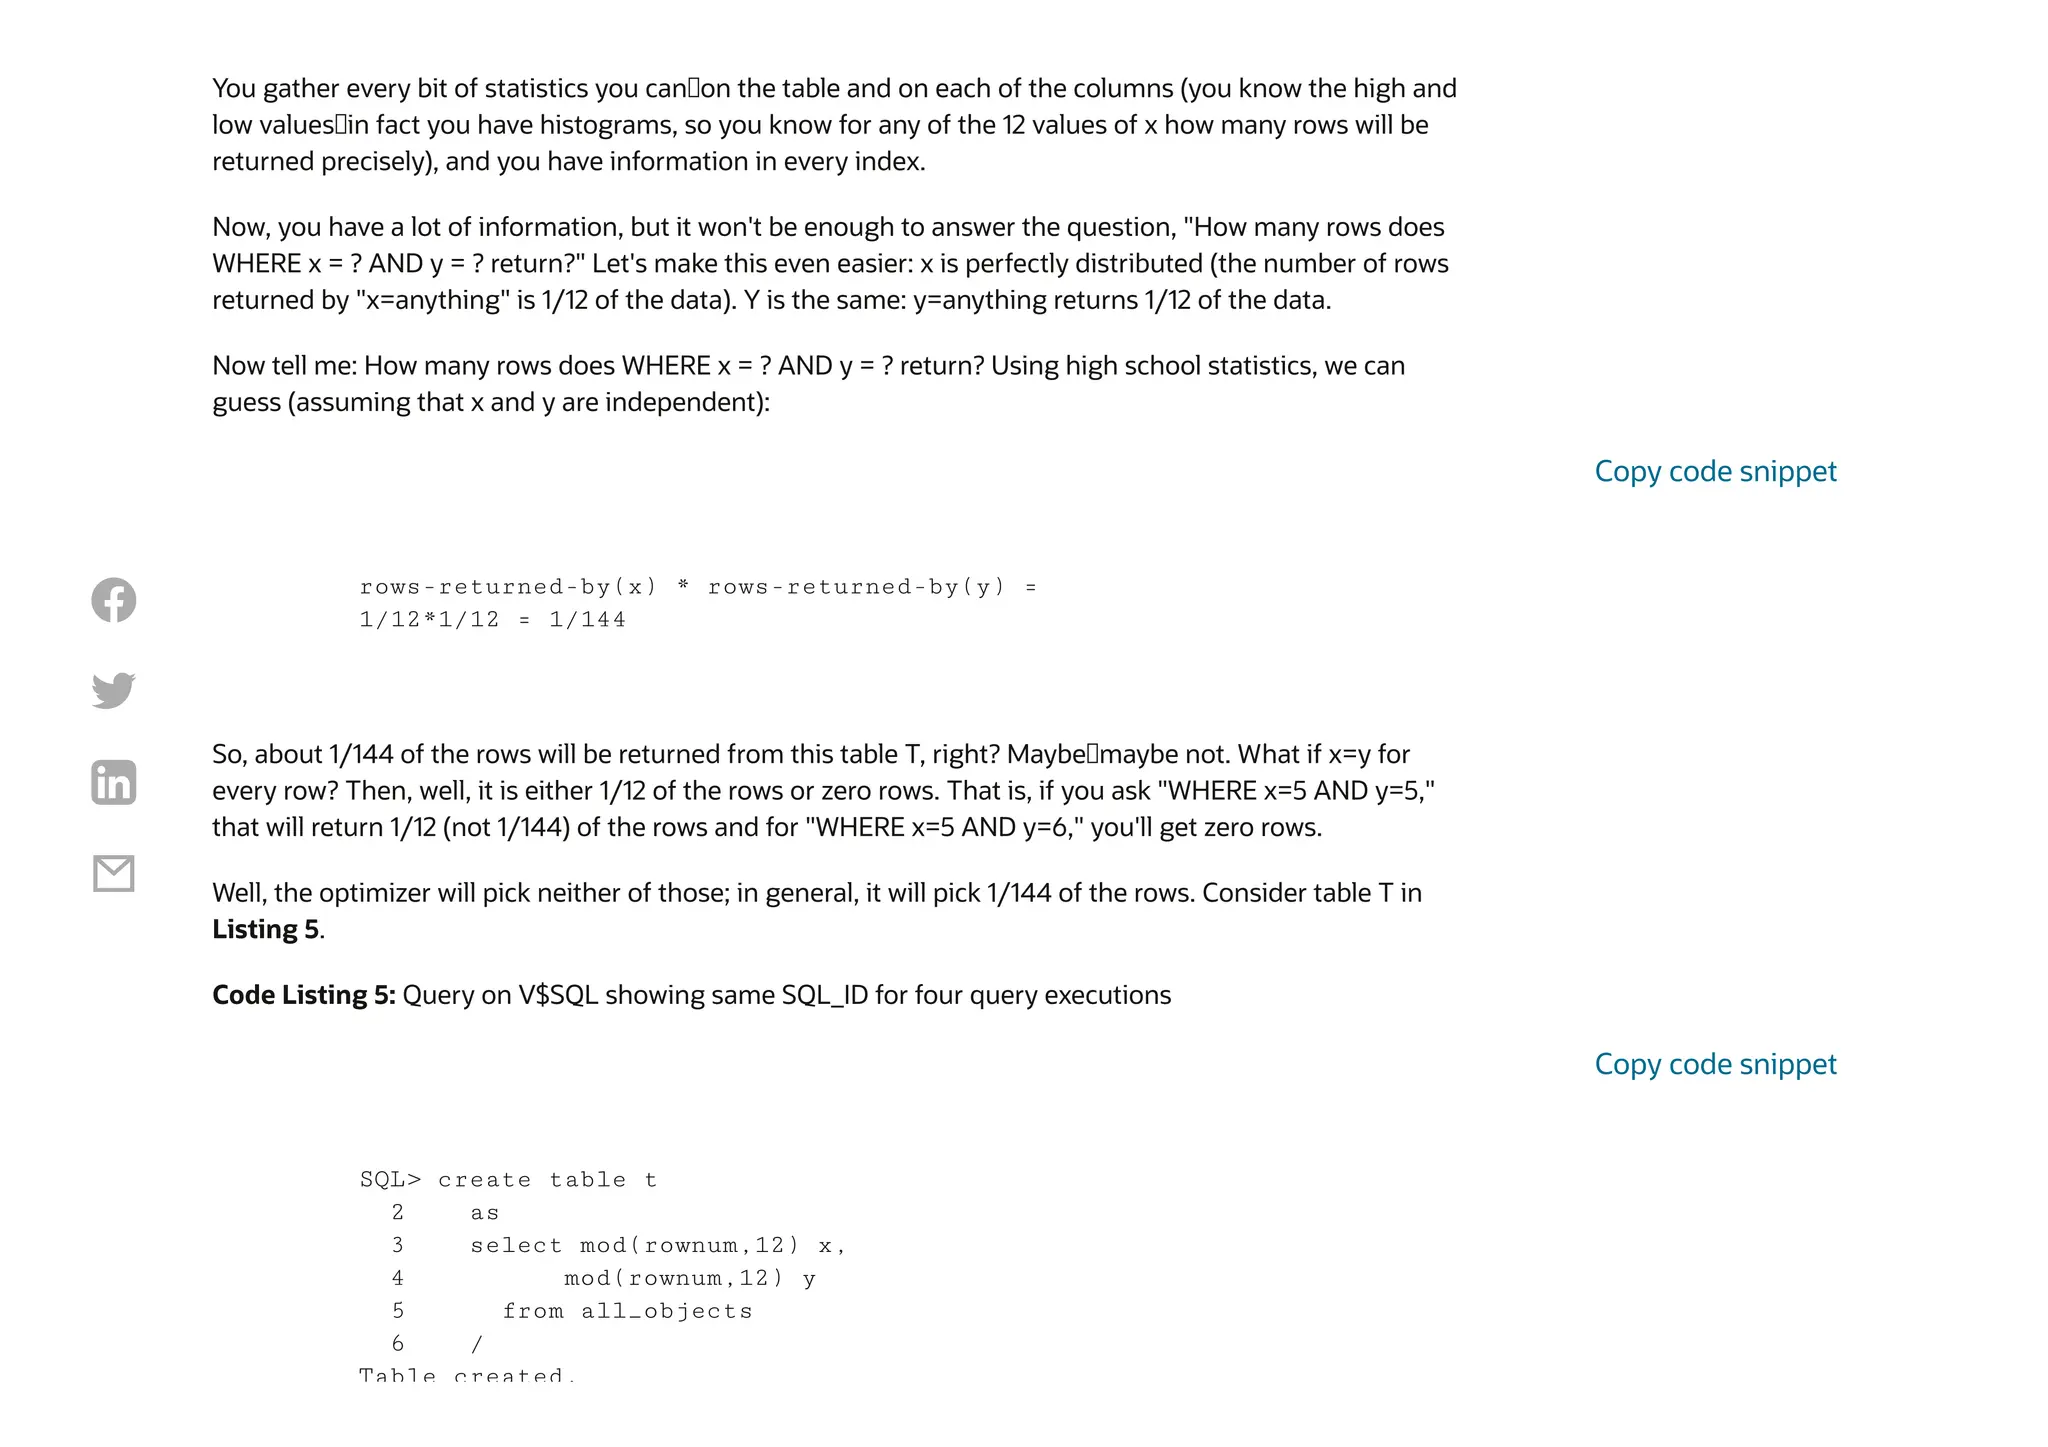
Oracle Connect
Ideas for a competitive edge
Follow: 




Oracle Connect




Database Developer, Database, SQL and PL SQL, DBA
On Seeing Double in V$SQL
May 1, 2008 | 11 minute read
Tom Kyte
Our technologist looks at SQL repetition in V$SQL and differences
in cardinality.
By Tom Kyte
May/June 2008
I often find more than one row in V$SQL for a given SQL statement. I am wondering why that is, which one
of those rows represents the "active" SQL statement, and which one users executing that SQL statement in
the database will use. Can you explain?
There are many reasons why more than one copy of a SQL statement can be present in V$SQL. For
example, let's say two users each have a table T, so tables USERA.T and USERB.T are present in the
database. USERA logs in and queries SELECT * FROM T. Likewise, USERB logs in and issues SELECT *
FROM T. Even though these two SQL statements appear to be the same, they are obviously very
different—accessing different objects with entirely different query plans. Therefore, we need two different
entries for them in V$SQL.
In general, there are many reasons you'll see more than one cursor in V$SQL for a given SQL statement.
The following discussion explores another pair of reasons and shows how we can figure out why there is
more than one copy of the SQL in V$SQL. We'll see that in the end, the cursor version used depends on the
environment of the user running the SQL statement. Let's start by setting up an example table to query:
SQL> create table t
Copy code snippet




So we have a table, and the optimizer is told that there are 1,000,000 rows in it. Now we'll ensure that the
shared pool has no cached copies of SQL against this table (this is for demonstration purposes—do not do
this on a production system!):
So, we have table T—a very simple table—and now we'll construct a very simple PL/SQL block that will
execute the same query text four times, as shown in Listing 1.
Code Listing 1: PL/SQL block executing query text four times
2 ( x varchar2(30) primary key,
3 y int );
Table created.
SQL> begin
2 dbms_stats.set_table_stats
3 ( user, 'T',
4 numrows => 1000000,
5 numblks=>100000 );
6 end;
7 /
PL/SQL procedure successfully completed.
SQL> alter system flush
2 shared_pool;
System altered.
SQL> select sql_id, sql_text
2 from v$sql
3 where upper(sql_text)
4 like
5 'SELECT % T LOOK_FOR_ME %B1_';
no rows selected
Copy code snippet
Copy code snippet




After executing that block, we'll look at V$SQL and find that there are four entries—one each for the
identical SQL statements we executed in Listing 1. We know they are identical because we can see that they
all have exactly the same SQL_ID, as shown in Listing 2.
Code Listing 2: Query on V$SQL showing same SQL_ID for four query executions
SQL> declare
2 l_x_number number;
3 l_x_string varchar2(30);
4 begin
5 execute immediate 'alter session set optimizer_mode=all_rows';<span>6 for x
8 execute immediate 'alter session set optimizer_mode=first_rows';<span>9 for
11 end;
12 /
PL/SQL procedure successfully completed.
Copy code snippet
SQL> select sql_id, sql_text
2 from v$sql
3 where upper(sql_text)
4 like
5 'SELECT % T LOOK_FOR_ME %B1_';
SQL_ID SQL_TEXT
------------- ----------------------------------------
1qqtru155tyz8 SELECT * FROM T LOOK_FOR_ME WHERE X = :B1
4 rows selected.
Copy code snippet




Those four copies may appear identical, but they are different. Because of the way I wrote my code, the
cursors were parsed in entirely different environments:
The differences between cursor pair 1 and 2 and cursor pair 3 and 4 are in the optimizer settings. Pair 1 and
2 was optimized for ALL_ROWS (total throughput), and pair 3 and 4 was optimized for FIRST_ROWS (initial
response time). Additionally, within each pair, we bind either a VARCHAR2 or a NUMBER type, and
depending on which datatype we use, we get a different query plan.
Listing 3 shows the plans for cursors 1 and 2. Those two plans (child number 0 and child number 1 here,
because Oracle Database numbers from 0) are very different—all because of the binds. When you compare
a string with a number, an implicit to_number() is placed on the string, as shown in Listing 3. We have not
indexed to_number(x), so we do a full-table scan for the first cursor, and for the second cursor, bound to a
VARCHAR2, we use the index.
Code Listing 3: Plans for cursors 1 and 2
Cursor 1 used ALL_ROWS and bound a NUMBER datatype.
Cursor 2 used ALL_ROWS and bound a VARCHAR2 datatype.
Cursor 3 used FIRST_ROWS with a NUMBER datatype.
Cursor 4 used FIRST_ROWS with a VARCHAR2 datatype.
<span>SQL> select * from table( dbms_xplan.display_cursor('1qqtru155tyz8', 0 ) );</span>
PLAN_TABLE_OUTPUT
-------------------------
SQL_ID 1qqtru155tyz8, child number 0
-----------------
SELECT * FROM T LOOK_FOR_ME WHERE X = :B1
Plan hash value: 1601196873
<span>------------------------------------------------------------------------------</span>
<span>| Id | Operation | Name | Rows | Bytes | Cost (%CPU) | Time |</span>
<span>------------------------------------------------------------------------------</span>
<span>| 0 | SELECT STATEMENT | | | | | 30891 (100)|</span>
<span>|* 1 | TABLE ACCESS FULL| T | 10000 | 292K| 30891 (2)| 00:02:27 |</span>
<span>------------------------------------------------------------------------------</span>
Copy code snippet




Listing 4 looks at the plans for cursors 3 and 4 (which are child numbers 2 and 3). The plans for cursors 3
and 4 in Listing 4 look the same as those for the first two cursors (in Listing 3), but that is just a
coincidence. The plans for cursors 3 and 4 could have been different, because they were optimized with
FIRST_ROWS—for initial response time—not ALL_ROWS, as the first two cursors were. Therefore, because
the optimizer mode is different, there is a different optimizer environment and hence a different child
cursor. We can see what makes these different, via V$SQL_SHARED_CURSOR:
Code Listing 4: Plans for cursors 3 and 4
<span> </span>
Predicate Information (identified by operation id):
----------------------
1 - filter(TO_NUMBER("X")=:B1)
18 rows selected.
SQL> select * from table( dbms_xplan.display_cursor('1qqtru155tyz8, 1 ) );
PLAN_TABLE_OUTPUT
----------------------------------
SQL_ID 1qqtru155tyz8, child number 1
------------------
SELECT * FROM T LOOK_FOR_ME WHERE X = :B1
Plan hash value: 3817779948
<span>-----------------------------------------------------------------------------------</spa
<span>| Id | Operation | Name | Rows | Bytes | Cost (%CPU) |</sp
<span>-----------------------------------------------------------------------------------</spa
<span>| 0 | SELECT STATEMENT | | | | 2 (100)|</sp
<span>| 1 | TABLE ACCESS BY INDEX ROWID| T | 1 | 30| 2 (0)|</sp
<span>|* 2 | INDEX UNIQUE SCAN | SYS_C0023438 | 1 | | 1 (0)|</sp
<span>-----------------------------------------------------------------------------------</spa
Predicate Information (identified by operation id):
----------------------
2 - access("X"=:B1)
19 rows selected.
SQL> select * from table( dbms_xplan.display_cursor('1qqtru155tyz8', 2 ) );
Copy code snippet




PLAN_TABLE_OUTPUT
------------------------------------
SQL_ID 1qqtru155tyz8, child number 2
--------------------
SELECT * FROM T LOOK_FOR_ME WHERE X = :B1
Plan hash value: 1601196873
<span>------------------------------------------------------------------------------</span>
<span>| Id | Operation | Name | Rows | Bytes | Cost (%CPU)| Time |</span>
<span>------------------------------------------------------------------------------</span>
<span>| 0 | SELECT STATEMENT | | | | 30891 (100) | |</span>
<span>|* 1 | TABLE ACCESS FULL| T | 10000 | 292K| 30891 (2) | 00:02:27 |</span>
<span>------------------------------------------------------------------------------</span>
Predicate Information (identified by operation id):
-------------------------
1 - filter(TO_NUMBER("X")=:B1)
18 rows selected.
SQL> select * from table( dbms_xplan.display_cursor('1qqtru155tyz8', 3 ) );
PLAN_TABLE_OUTPUT
------------------------------------
SQL_ID 1qqtru155tyz8, child number 3
--------------------
SELECT * FROM T LOOK_FOR_ME WHERE X = :B1
Plan hash value: 3817779948
<span>---------------------------------------------------------------------------------</span>
<span>| Id | Operation | Name | Rows | Bytes | Cost (%CPU)|</span
<span>---------------------------------------------------------------------------------</span>
<span>| 0 | SELECT STATEMENT | | | | 2 (100)|</span
<span>| 1 | TABLE ACCESS BY INDEX ROWID| T | 1 | 30| 2 (0)|</span
<span>|* 2 | INDEX UNIQUE SCAN | SYS_C0023438 | 1 | | 1 (0)|</span
<span>---------------------------------------------------------------------------------</span>
Predicate Information (identified by operation id):
-------------------------
2 - access("X"=:B1)
19 rows selected.
Copy code snippet




It shows that child cursors 0 and 1 (the first two cursors) differed in a bind mismatch (column B) and the
next two cursors differed from the previous ones because of optimizer mode mismatches (column O)—and
the last cursor from the previous, due to bind mismatch as well.
All four cursors are "active"—any of them can and will be used by applications. If people log in and run that
query, binding a string with FIRST_ROWS optimization, they'll use the last child cursor. If people log in and
run that query with ALL_ROWS optimization and bind a number, they'll use the first child cursor.
By using V$SQL_SHARED_CURSOR, you can gain insight into why there is more than one copy of a given
SQL statement in the shared pool.
Why the Cardinality Difference?
What are all the possible reasons for the difference in cardinalities shown in the explain plan (the guess at
the cardinality made by the optimizer) and TKPROF row source operation (what actually happened at
runtime)?
Well, as far as what all the possible reasons for the difference in cardinalities shown in the explain plan and
TKPROF row source operation are, there are a possibly infinite number of reasons, or at least the list is so
large that I cannot imagine building a comprehensive one.
Take, for example, a case where you have a set of data called table T. In this set of data, you have two
columns, x and y, each with 12 distinct values.
SQL> select child_number,
2 bind_mismatch B,
3 optimizer_mode_mismatch O
4 from v$sql_shared_cursor
5 where sql_id = '1qqtru155tyz8'
6 /
CHILD_NUMBER B O
------------ - -
0 N N
1 Y N
2 N Y
3 Y Y




You gather every bit of statistics you can—on the table and on each of the columns (you know the high and
low values—in fact you have histograms, so you know for any of the 12 values of x how many rows will be
returned precisely), and you have information in every index.
Now, you have a lot of information, but it won't be enough to answer the question, "How many rows does
WHERE x = ? AND y = ? return?" Let's make this even easier: x is perfectly distributed (the number of rows
returned by "x=anything" is 1/12 of the data). Y is the same: y=anything returns 1/12 of the data.
Now tell me: How many rows does WHERE x = ? AND y = ? return? Using high school statistics, we can
guess (assuming that x and y are independent):
So, about 1/144 of the rows will be returned from this table T, right? Maybe—maybe not. What if x=y for
every row? Then, well, it is either 1/12 of the rows or zero rows. That is, if you ask "WHERE x=5 AND y=5,"
that will return 1/12 (not 1/144) of the rows and for "WHERE x=5 AND y=6," you'll get zero rows.
Well, the optimizer will pick neither of those; in general, it will pick 1/144 of the rows. Consider table T in
Listing 5.
Code Listing 5: Query on V$SQL showing same SQL_ID for four query executions
rows-returned-by(x) * rows-returned-by(y) =
1/12*1/12 = 1/144
Copy code snippet
SQL> create table t
2 as
3 select mod(rownum,12) x,
4 mod(rownum,12) y
5 from all_objects
6 /
Table created.
Copy code snippet




So we have table T, it has 49,850 rows, and we can see that 1/12 of that is about 4,154 rows and 1/144 of that
is about 346 rows. We've gathered very precise statistics on the table. If we now ask the optimizer to tell us
how many rows it thinks "WHERE x=5," "WHERE y=6," and "WHERE x=5 AND y=6" will return, we'll discover
the results in Listing 6.
Code Listing 6: Plan for table with precise statistics
Table created.
SQL> begin
2 dbms_stats.gather_table_stats
3 ( user, 'T',
4 method_opt => 'for all ' ||
5 'columns size 254' );
6 end;
7 /
PL/SQL procedure successfully completed.
SQL> select count(*), count(*)/12, count(*)/144 from t;
COUNT(*) COUNT(*)/12 COUNT(*)/144
-------- ----------- ------------
49850 4154.16667 346.180556
SQL> set autotrace traceonly explain
SQL> select * from t where x = 5;
-------------------------------------------------------------------------
| Id | Operation | Name | Rows | Bytes | Cost (%CPU)| Time |
-------------------------------------------------------------------------
| 0| SELECT STATEMENT | | 4079| 20395 | 30 (10) | 00:00:01|
|* 1 | TABLE ACCESS FULL| T | 4079| 20395 | 30 (10) | 00:00:01|
-------------------------------------------------------------------------
SQL> select * from t where y = 6;
-------------------------------------------------------------------------
| Id | Operation | Name | Rows | Bytes | Cost (%CPU)| Time |
-------------------------------------------------------------------------
| 0 | SELECT STATEMENT | | 4305| 21525 | 31 (13) | 00:00:01|
|* 1 | TABLE ACCESS FULL| T | 4305| 21525 | 31 (13) | 00:00:01|
Copy code snippet




The optimizer guessed 1/12, 1/12, and 1/144 of the data, and for the first two, it was dead on (due to the way
we constructed our test case), but for the last one, we know it was way off, because there are zero records
"WHERE x=5 AND y=6" (because x=y for every row!).
In this specific case, a possible solution for correcting the optimizer's guess is to use dynamic sampling, as
shown in Listing 7 (and demonstrated in more detail at asktom.oracle.com).
See how the guess of 1 row is much closer to reality than the prior guess of 357 rows? The optimizer works
with imperfect information at times, and it makes the best guess. When we see a large disparity in the
computed cardinality, we can usually see why in that case and then find a remedy, be it by using dynamic
sampling as demonstrated or by using a virtual column and gathering statistics on it (an Oracle Database
11g Release 1 new feature— demonstrated in the March/April 2008 Ask Tom column).
Some DDL Just Got Easier, and Some Just Got Added
Have you ever encountered something like this?
| | CC SS U | | 305| 5 5 | 3 ( 3) | 00:00:0 |
-------------------------------------------------------------------------
SQL> select * from t where x = 5 and y = 6;
---------------------------------------------------------------------------
| Id | Operation | Name | Rows | Bytes | Cost (%CPU)| Time |
---------------------------------------------------------------------------
| 0 | SELECT STATEMENT | | 357| 1785 | 31 (13) | 00:00:01|
|* 1 | TABLE ACCESS FULL| T | 357| 1785 | 31 (13) | 00:00:01|
---------------------------------------------------------------------------
SQL> alter table emp add resume blob;
alter table emp add resume blob
*
ERROR at line 1:
ORA-00054: resource busy and acquire
with NOWAIT specified
Copy code snippet




In a busy system, you may find certain data definition language (DDL) operations virtually impossible to
execute, because they do not wait for existing transactions to finish. You might execute this ALTER TABLE
statement thousands of times over the course of many hours, never getting it to "go." Now you have the
ability to ask Oracle Database 11g to put your statement in a queue—to wait for the chance to lock the table,
do the DDL, and give up the lock. For example, if you issue
in Oracle Database 11g, your DDL statements will wait six seconds before giving up and returning with a
slightly modified Oracle Database 11g error message:
So now a DBA can specify the amount of time to wait for existing transactions to complete before having
the statement fail.
In addition, some new DDL statements have been introduced in Oracle Database 11g. One I've been waiting
for is the ability to put a table in READ ONLY mode—preventing data manipulation language (DML) and DDL
modifications. The following puts a table in READ ONLY mode and then attempts to run a new DDL
statement:
SQL> alter session
set ddl_lock_timeout = 6;
Session altered.
Copy code snippet
<span>ORA-00054: resource busy and acquire with NOWAIT specified or timeout expired</span>
Copy code snippet
Copy code snippet




Next Steps
ASK Tom
Tom Kyte answers your most difficult technology questions. Highlights from that forum appear in this
column.
asktom.oracle.com
READ more Tom
Expert Oracle Database Architecture: 9i and 10g Programming Techniques and Solutions
DOWNLOAD Oracle Database 11g
Photography by Ricardo Gomez, Unsplash
Tom Kyte
In his 22 years at Oracle, Tom Kyte started the Ask Tom question and answer site and was the site's sole
proprietor for almost 15 years. In his spare time, he also wrote Expert Oracle Database Architecture (Apress,
2005, 2010, 2014) and Effective Oracle by Design (Oracle Press, 2003), among other books. (The Ask Tom
site continues today as Ask TOM: Ask The Oracle Masters.)
Show more
SQL> alter table emp read only;
Table altered.
SQL> alter table emp add resume blob;
alter table emp add resume blob
*
ERROR at line 1:
ORA-12081: update operation not
allowed on table "OPS$ORACLE"."EMP"




© 2024 Oracle Privacy / Do Not Sell My Info Cookie-Einstellungen Ad Choices Careers
 Previous Post
Making Database Connections
Sue Harper | 9 min read Jonathan Gennick | 10 min read
Next Post

Managing History
About
Careers
Developers
Investors
Partners
Startups
Resources for
Analyst Reports
Best CRM
Cloud Economics
Corporate Responsibility
Diversity and Inclusion
Security Practices
Why Oracle
What is Customer
Service?
What is ERP?
What is Marketing
Automation?
What is Procurement?
What is Talent
Management?
What is VM?
Learn
Try Oracle Cloud Free
Tier
Oracle Sustainability
Oracle COVID-19
Response
Oracle and SailGP
Oracle and Premier
League
Oracle and Red Bull
Racing Honda
What's New
US Sales 1.800.633.0738
How can we help?
Subscribe to Oracle Content
Try Oracle Cloud Free Tier
Events
News
Contact Us





On Seeing Double in V$SQL_Thomas_Kytepdf

  • 1.
    Oracle Connect Ideas fora competitive edge Follow:      Oracle Connect
  • 2.
  • 3.
    Database Developer, Database,SQL and PL SQL, DBA On Seeing Double in V$SQL May 1, 2008 | 11 minute read Tom Kyte Our technologist looks at SQL repetition in V$SQL and differences in cardinality. By Tom Kyte May/June 2008 I often find more than one row in V$SQL for a given SQL statement. I am wondering why that is, which one of those rows represents the "active" SQL statement, and which one users executing that SQL statement in the database will use. Can you explain? There are many reasons why more than one copy of a SQL statement can be present in V$SQL. For example, let's say two users each have a table T, so tables USERA.T and USERB.T are present in the database. USERA logs in and queries SELECT * FROM T. Likewise, USERB logs in and issues SELECT * FROM T. Even though these two SQL statements appear to be the same, they are obviously very different—accessing different objects with entirely different query plans. Therefore, we need two different entries for them in V$SQL. In general, there are many reasons you'll see more than one cursor in V$SQL for a given SQL statement. The following discussion explores another pair of reasons and shows how we can figure out why there is more than one copy of the SQL in V$SQL. We'll see that in the end, the cursor version used depends on the environment of the user running the SQL statement. Let's start by setting up an example table to query: SQL> create table t Copy code snippet    
  • 4.
    So we havea table, and the optimizer is told that there are 1,000,000 rows in it. Now we'll ensure that the shared pool has no cached copies of SQL against this table (this is for demonstration purposes—do not do this on a production system!): So, we have table T—a very simple table—and now we'll construct a very simple PL/SQL block that will execute the same query text four times, as shown in Listing 1. Code Listing 1: PL/SQL block executing query text four times 2 ( x varchar2(30) primary key, 3 y int ); Table created. SQL> begin 2 dbms_stats.set_table_stats 3 ( user, 'T', 4 numrows => 1000000, 5 numblks=>100000 ); 6 end; 7 / PL/SQL procedure successfully completed. SQL> alter system flush 2 shared_pool; System altered. SQL> select sql_id, sql_text 2 from v$sql 3 where upper(sql_text) 4 like 5 'SELECT % T LOOK_FOR_ME %B1_'; no rows selected Copy code snippet Copy code snippet    
  • 5.
    After executing thatblock, we'll look at V$SQL and find that there are four entries—one each for the identical SQL statements we executed in Listing 1. We know they are identical because we can see that they all have exactly the same SQL_ID, as shown in Listing 2. Code Listing 2: Query on V$SQL showing same SQL_ID for four query executions SQL> declare 2 l_x_number number; 3 l_x_string varchar2(30); 4 begin 5 execute immediate 'alter session set optimizer_mode=all_rows';<span>6 for x 8 execute immediate 'alter session set optimizer_mode=first_rows';<span>9 for 11 end; 12 / PL/SQL procedure successfully completed. Copy code snippet SQL> select sql_id, sql_text 2 from v$sql 3 where upper(sql_text) 4 like 5 'SELECT % T LOOK_FOR_ME %B1_'; SQL_ID SQL_TEXT ------------- ---------------------------------------- 1qqtru155tyz8 SELECT * FROM T LOOK_FOR_ME WHERE X = :B1 1qqtru155tyz8 SELECT * FROM T LOOK_FOR_ME WHERE X = :B1 1qqtru155tyz8 SELECT * FROM T LOOK_FOR_ME WHERE X = :B1 1qqtru155tyz8 SELECT * FROM T LOOK_FOR_ME WHERE X = :B1 4 rows selected. Copy code snippet    
  • 6.
    Those four copiesmay appear identical, but they are different. Because of the way I wrote my code, the cursors were parsed in entirely different environments: The differences between cursor pair 1 and 2 and cursor pair 3 and 4 are in the optimizer settings. Pair 1 and 2 was optimized for ALL_ROWS (total throughput), and pair 3 and 4 was optimized for FIRST_ROWS (initial response time). Additionally, within each pair, we bind either a VARCHAR2 or a NUMBER type, and depending on which datatype we use, we get a different query plan. Listing 3 shows the plans for cursors 1 and 2. Those two plans (child number 0 and child number 1 here, because Oracle Database numbers from 0) are very different—all because of the binds. When you compare a string with a number, an implicit to_number() is placed on the string, as shown in Listing 3. We have not indexed to_number(x), so we do a full-table scan for the first cursor, and for the second cursor, bound to a VARCHAR2, we use the index. Code Listing 3: Plans for cursors 1 and 2 Cursor 1 used ALL_ROWS and bound a NUMBER datatype. Cursor 2 used ALL_ROWS and bound a VARCHAR2 datatype. Cursor 3 used FIRST_ROWS with a NUMBER datatype. Cursor 4 used FIRST_ROWS with a VARCHAR2 datatype. <span>SQL> select * from table( dbms_xplan.display_cursor('1qqtru155tyz8', 0 ) );</span> PLAN_TABLE_OUTPUT ------------------------- SQL_ID 1qqtru155tyz8, child number 0 ----------------- SELECT * FROM T LOOK_FOR_ME WHERE X = :B1 Plan hash value: 1601196873 <span>------------------------------------------------------------------------------</span> <span>| Id | Operation | Name | Rows | Bytes | Cost (%CPU) | Time |</span> <span>------------------------------------------------------------------------------</span> <span>| 0 | SELECT STATEMENT | | | | | 30891 (100)|</span> <span>|* 1 | TABLE ACCESS FULL| T | 10000 | 292K| 30891 (2)| 00:02:27 |</span> <span>------------------------------------------------------------------------------</span> Copy code snippet    
  • 7.
    Listing 4 looksat the plans for cursors 3 and 4 (which are child numbers 2 and 3). The plans for cursors 3 and 4 in Listing 4 look the same as those for the first two cursors (in Listing 3), but that is just a coincidence. The plans for cursors 3 and 4 could have been different, because they were optimized with FIRST_ROWS—for initial response time—not ALL_ROWS, as the first two cursors were. Therefore, because the optimizer mode is different, there is a different optimizer environment and hence a different child cursor. We can see what makes these different, via V$SQL_SHARED_CURSOR: Code Listing 4: Plans for cursors 3 and 4 <span> </span> Predicate Information (identified by operation id): ---------------------- 1 - filter(TO_NUMBER("X")=:B1) 18 rows selected. SQL> select * from table( dbms_xplan.display_cursor('1qqtru155tyz8, 1 ) ); PLAN_TABLE_OUTPUT ---------------------------------- SQL_ID 1qqtru155tyz8, child number 1 ------------------ SELECT * FROM T LOOK_FOR_ME WHERE X = :B1 Plan hash value: 3817779948 <span>-----------------------------------------------------------------------------------</spa <span>| Id | Operation | Name | Rows | Bytes | Cost (%CPU) |</sp <span>-----------------------------------------------------------------------------------</spa <span>| 0 | SELECT STATEMENT | | | | 2 (100)|</sp <span>| 1 | TABLE ACCESS BY INDEX ROWID| T | 1 | 30| 2 (0)|</sp <span>|* 2 | INDEX UNIQUE SCAN | SYS_C0023438 | 1 | | 1 (0)|</sp <span>-----------------------------------------------------------------------------------</spa Predicate Information (identified by operation id): ---------------------- 2 - access("X"=:B1) 19 rows selected. SQL> select * from table( dbms_xplan.display_cursor('1qqtru155tyz8', 2 ) ); Copy code snippet    
  • 8.
    PLAN_TABLE_OUTPUT ------------------------------------ SQL_ID 1qqtru155tyz8, childnumber 2 -------------------- SELECT * FROM T LOOK_FOR_ME WHERE X = :B1 Plan hash value: 1601196873 <span>------------------------------------------------------------------------------</span> <span>| Id | Operation | Name | Rows | Bytes | Cost (%CPU)| Time |</span> <span>------------------------------------------------------------------------------</span> <span>| 0 | SELECT STATEMENT | | | | 30891 (100) | |</span> <span>|* 1 | TABLE ACCESS FULL| T | 10000 | 292K| 30891 (2) | 00:02:27 |</span> <span>------------------------------------------------------------------------------</span> Predicate Information (identified by operation id): ------------------------- 1 - filter(TO_NUMBER("X")=:B1) 18 rows selected. SQL> select * from table( dbms_xplan.display_cursor('1qqtru155tyz8', 3 ) ); PLAN_TABLE_OUTPUT ------------------------------------ SQL_ID 1qqtru155tyz8, child number 3 -------------------- SELECT * FROM T LOOK_FOR_ME WHERE X = :B1 Plan hash value: 3817779948 <span>---------------------------------------------------------------------------------</span> <span>| Id | Operation | Name | Rows | Bytes | Cost (%CPU)|</span <span>---------------------------------------------------------------------------------</span> <span>| 0 | SELECT STATEMENT | | | | 2 (100)|</span <span>| 1 | TABLE ACCESS BY INDEX ROWID| T | 1 | 30| 2 (0)|</span <span>|* 2 | INDEX UNIQUE SCAN | SYS_C0023438 | 1 | | 1 (0)|</span <span>---------------------------------------------------------------------------------</span> Predicate Information (identified by operation id): ------------------------- 2 - access("X"=:B1) 19 rows selected. Copy code snippet    
  • 9.
    It shows thatchild cursors 0 and 1 (the first two cursors) differed in a bind mismatch (column B) and the next two cursors differed from the previous ones because of optimizer mode mismatches (column O)—and the last cursor from the previous, due to bind mismatch as well. All four cursors are "active"—any of them can and will be used by applications. If people log in and run that query, binding a string with FIRST_ROWS optimization, they'll use the last child cursor. If people log in and run that query with ALL_ROWS optimization and bind a number, they'll use the first child cursor. By using V$SQL_SHARED_CURSOR, you can gain insight into why there is more than one copy of a given SQL statement in the shared pool. Why the Cardinality Difference? What are all the possible reasons for the difference in cardinalities shown in the explain plan (the guess at the cardinality made by the optimizer) and TKPROF row source operation (what actually happened at runtime)? Well, as far as what all the possible reasons for the difference in cardinalities shown in the explain plan and TKPROF row source operation are, there are a possibly infinite number of reasons, or at least the list is so large that I cannot imagine building a comprehensive one. Take, for example, a case where you have a set of data called table T. In this set of data, you have two columns, x and y, each with 12 distinct values. SQL> select child_number, 2 bind_mismatch B, 3 optimizer_mode_mismatch O 4 from v$sql_shared_cursor 5 where sql_id = '1qqtru155tyz8' 6 / CHILD_NUMBER B O ------------ - - 0 N N 1 Y N 2 N Y 3 Y Y    
  • 10.
    You gather everybit of statistics you can—on the table and on each of the columns (you know the high and low values—in fact you have histograms, so you know for any of the 12 values of x how many rows will be returned precisely), and you have information in every index. Now, you have a lot of information, but it won't be enough to answer the question, "How many rows does WHERE x = ? AND y = ? return?" Let's make this even easier: x is perfectly distributed (the number of rows returned by "x=anything" is 1/12 of the data). Y is the same: y=anything returns 1/12 of the data. Now tell me: How many rows does WHERE x = ? AND y = ? return? Using high school statistics, we can guess (assuming that x and y are independent): So, about 1/144 of the rows will be returned from this table T, right? Maybe—maybe not. What if x=y for every row? Then, well, it is either 1/12 of the rows or zero rows. That is, if you ask "WHERE x=5 AND y=5," that will return 1/12 (not 1/144) of the rows and for "WHERE x=5 AND y=6," you'll get zero rows. Well, the optimizer will pick neither of those; in general, it will pick 1/144 of the rows. Consider table T in Listing 5. Code Listing 5: Query on V$SQL showing same SQL_ID for four query executions rows-returned-by(x) * rows-returned-by(y) = 1/12*1/12 = 1/144 Copy code snippet SQL> create table t 2 as 3 select mod(rownum,12) x, 4 mod(rownum,12) y 5 from all_objects 6 / Table created. Copy code snippet    
  • 11.
    So we havetable T, it has 49,850 rows, and we can see that 1/12 of that is about 4,154 rows and 1/144 of that is about 346 rows. We've gathered very precise statistics on the table. If we now ask the optimizer to tell us how many rows it thinks "WHERE x=5," "WHERE y=6," and "WHERE x=5 AND y=6" will return, we'll discover the results in Listing 6. Code Listing 6: Plan for table with precise statistics Table created. SQL> begin 2 dbms_stats.gather_table_stats 3 ( user, 'T', 4 method_opt => 'for all ' || 5 'columns size 254' ); 6 end; 7 / PL/SQL procedure successfully completed. SQL> select count(*), count(*)/12, count(*)/144 from t; COUNT(*) COUNT(*)/12 COUNT(*)/144 -------- ----------- ------------ 49850 4154.16667 346.180556 SQL> set autotrace traceonly explain SQL> select * from t where x = 5; ------------------------------------------------------------------------- | Id | Operation | Name | Rows | Bytes | Cost (%CPU)| Time | ------------------------------------------------------------------------- | 0| SELECT STATEMENT | | 4079| 20395 | 30 (10) | 00:00:01| |* 1 | TABLE ACCESS FULL| T | 4079| 20395 | 30 (10) | 00:00:01| ------------------------------------------------------------------------- SQL> select * from t where y = 6; ------------------------------------------------------------------------- | Id | Operation | Name | Rows | Bytes | Cost (%CPU)| Time | ------------------------------------------------------------------------- | 0 | SELECT STATEMENT | | 4305| 21525 | 31 (13) | 00:00:01| |* 1 | TABLE ACCESS FULL| T | 4305| 21525 | 31 (13) | 00:00:01| Copy code snippet    
  • 12.
    The optimizer guessed1/12, 1/12, and 1/144 of the data, and for the first two, it was dead on (due to the way we constructed our test case), but for the last one, we know it was way off, because there are zero records "WHERE x=5 AND y=6" (because x=y for every row!). In this specific case, a possible solution for correcting the optimizer's guess is to use dynamic sampling, as shown in Listing 7 (and demonstrated in more detail at asktom.oracle.com). See how the guess of 1 row is much closer to reality than the prior guess of 357 rows? The optimizer works with imperfect information at times, and it makes the best guess. When we see a large disparity in the computed cardinality, we can usually see why in that case and then find a remedy, be it by using dynamic sampling as demonstrated or by using a virtual column and gathering statistics on it (an Oracle Database 11g Release 1 new feature— demonstrated in the March/April 2008 Ask Tom column). Some DDL Just Got Easier, and Some Just Got Added Have you ever encountered something like this? | | CC SS U | | 305| 5 5 | 3 ( 3) | 00:00:0 | ------------------------------------------------------------------------- SQL> select * from t where x = 5 and y = 6; --------------------------------------------------------------------------- | Id | Operation | Name | Rows | Bytes | Cost (%CPU)| Time | --------------------------------------------------------------------------- | 0 | SELECT STATEMENT | | 357| 1785 | 31 (13) | 00:00:01| |* 1 | TABLE ACCESS FULL| T | 357| 1785 | 31 (13) | 00:00:01| --------------------------------------------------------------------------- SQL> alter table emp add resume blob; alter table emp add resume blob * ERROR at line 1: ORA-00054: resource busy and acquire with NOWAIT specified Copy code snippet    
  • 13.
    In a busysystem, you may find certain data definition language (DDL) operations virtually impossible to execute, because they do not wait for existing transactions to finish. You might execute this ALTER TABLE statement thousands of times over the course of many hours, never getting it to "go." Now you have the ability to ask Oracle Database 11g to put your statement in a queue—to wait for the chance to lock the table, do the DDL, and give up the lock. For example, if you issue in Oracle Database 11g, your DDL statements will wait six seconds before giving up and returning with a slightly modified Oracle Database 11g error message: So now a DBA can specify the amount of time to wait for existing transactions to complete before having the statement fail. In addition, some new DDL statements have been introduced in Oracle Database 11g. One I've been waiting for is the ability to put a table in READ ONLY mode—preventing data manipulation language (DML) and DDL modifications. The following puts a table in READ ONLY mode and then attempts to run a new DDL statement: SQL> alter session set ddl_lock_timeout = 6; Session altered. Copy code snippet <span>ORA-00054: resource busy and acquire with NOWAIT specified or timeout expired</span> Copy code snippet Copy code snippet    
  • 14.
    Next Steps ASK Tom TomKyte answers your most difficult technology questions. Highlights from that forum appear in this column. asktom.oracle.com READ more Tom Expert Oracle Database Architecture: 9i and 10g Programming Techniques and Solutions DOWNLOAD Oracle Database 11g Photography by Ricardo Gomez, Unsplash Tom Kyte In his 22 years at Oracle, Tom Kyte started the Ask Tom question and answer site and was the site's sole proprietor for almost 15 years. In his spare time, he also wrote Expert Oracle Database Architecture (Apress, 2005, 2010, 2014) and Effective Oracle by Design (Oracle Press, 2003), among other books. (The Ask Tom site continues today as Ask TOM: Ask The Oracle Masters.) Show more SQL> alter table emp read only; Table altered. SQL> alter table emp add resume blob; alter table emp add resume blob * ERROR at line 1: ORA-12081: update operation not allowed on table "OPS$ORACLE"."EMP"    
  • 15.
    © 2024 OraclePrivacy / Do Not Sell My Info Cookie-Einstellungen Ad Choices Careers  Previous Post Making Database Connections Sue Harper | 9 min read Jonathan Gennick | 10 min read Next Post  Managing History About Careers Developers Investors Partners Startups Resources for Analyst Reports Best CRM Cloud Economics Corporate Responsibility Diversity and Inclusion Security Practices Why Oracle What is Customer Service? What is ERP? What is Marketing Automation? What is Procurement? What is Talent Management? What is VM? Learn Try Oracle Cloud Free Tier Oracle Sustainability Oracle COVID-19 Response Oracle and SailGP Oracle and Premier League Oracle and Red Bull Racing Honda What's New US Sales 1.800.633.0738 How can we help? Subscribe to Oracle Content Try Oracle Cloud Free Tier Events News Contact Us    