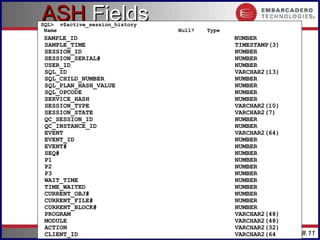
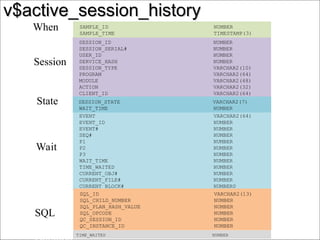
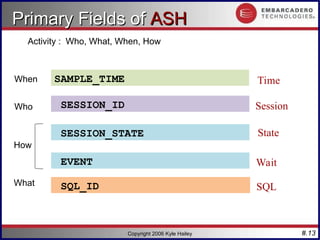
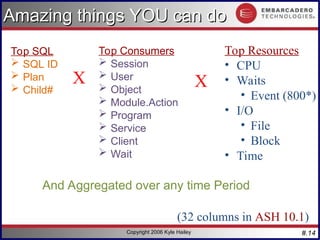
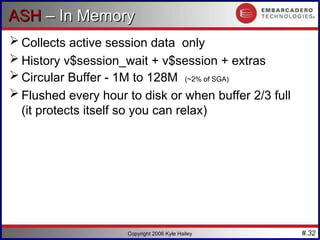
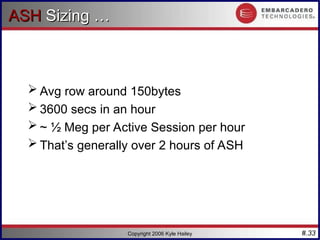
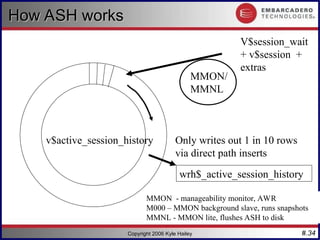
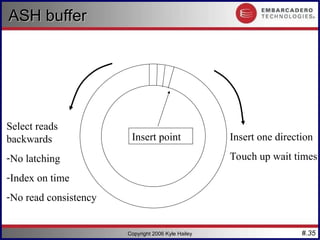
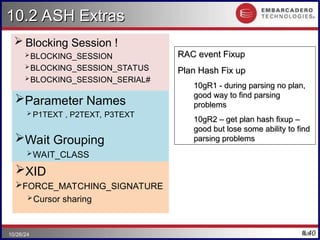
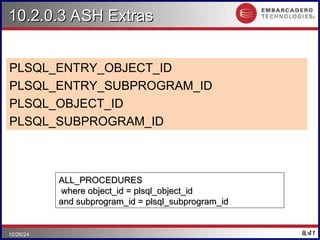
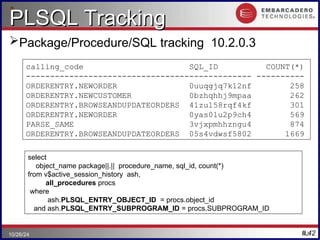
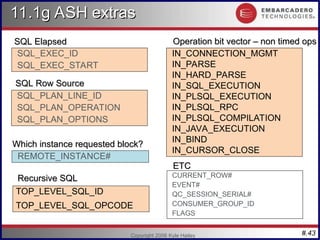
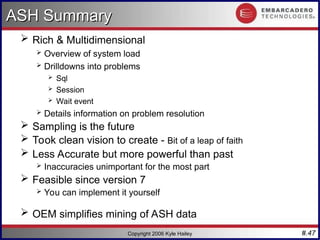
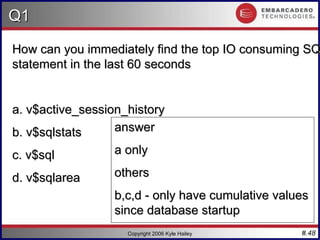
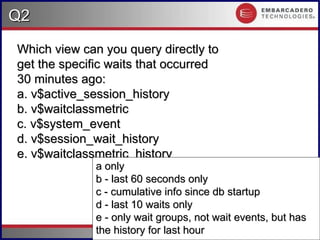
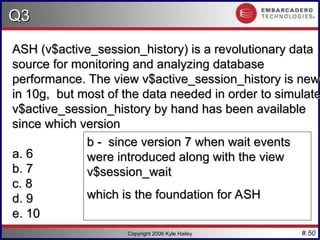
#.1
ASH
ASH –
– Active Session History
Active Session History
Feel the Power
Feel the Power
Kyle Hailey
http://perfvision.com
#.2
Copyright 2006 Kyle Hailey
Why should you care?
Because ASH can Change your life …
 10g immediately Accessible
 Geeks: Via scripts in SQL
 Managers : Graphical OEM
 Stuck on Oracle 7,8,9 ?
… my apologies because 10g rocks, but …
no worries, the data is accessible for you too via scripts
http://perfvision.com/sash.php
#.3
Copyright 2006 Kyle Hailey
Revolution and an Evolution
Oracle 6 … ie the dark ages … there was
once the Cache Buffer Hit Ratio
Oracle 7 … turned the lights on … Wait
Events … hallelujah I can see the light
Oracle 10g … ASH has landed
(like the wheels on the suitcases)
#.4
Copyright 2006 Kyle Hailey
Sampling
Sampling
New Paradigm
New Paradigm
 Clear Vision of the future
 Use new sampling technology
 Lets go of the need to know 100%
 Statistical approximation
 Cheaper
 Richer Multidimensional Data
 Identifies
 SQL
 Sessions
 Objects
 Machine
 User
#.5
Copyright 2006 Kyle Hailey
Identify Players before ASH
 Sessions v$sesstat, v$session_event
 # sessions x (# wait events + statistics)
 Example (150 x (800+200) = 150,000 )
 SQL
 v$sql
 Could be 10000s
 Takes out latches that compete with other sql executions
 Objects
 V$segstat 9i+
 Could be 1000s of objects
Expensive !
Also files v$filestat
#.6
Copyright 2006 Kyle Hailey
ASH
ASH
Intelligence for the new Millennium
 Intelligently Collects Data
 Samples once a second
 Collects active sessions only
 Collects Session/SQL/Wait
 More activity, more data collected
 Less activity, less data collected
 Those old methods collected everything
 Obfuscated the problem, too many statistics too late
 Costly
 Too Granular – once an hour ?! Give me a break
 Collects fine grain multidimensional data
#.7
Copyright 2006 Kyle Hailey
IDLE
IDLE
 Example : SQL*Net Message from Client
 10g
 9i or below – just have to keep track
 Statspack STATS$IDLE_EVENT
select name
from v$event_name
where wait_class='Idle';
58 Rows
select * from v$session where wait_class != 'Idle'
and status='ACTIVE';
#.8
Copyright 2006 Kyle Hailey
CPU
CPU
 ASH: SESSION_STATE = “ON CPU”
10g: v$session
9i: v$session_wait
w.wait_time != 0 /* on CPU */ and
s.status='ACTIVE' /* ACTIVE */
Identifying CPU via v$session_wait is a huge break through
select * from v$session where wait_time > 0
and status='ACTIVE';
#.9
Copyright 2006 Kyle Hailey
IO
IO
 ASH: SESSION_STATE=‘WAITING’ and …
 10g: WAIT_CLASS=‘User I/O’
 9i:
 Look at 10g for ideas
 db file sequential read
 db file scattered read
 db file parallel read
 direct path read
select * from v$session where wait_class = 'User I/O‘
and wait_time <= 0;
#.10
Copyright 2006 Kyle Hailey
WAITING
WAITING
 ASH: SESSION_STATE=‘WAITING’
 WAIT_CLASS
1. Administrative
2. Application
3. Cluster
4. Commit
5. Concurrency
6. Configuration
7. Network
8. Other
9. Scheduler
10. System I/O
 800+ WAIT
select * from v$session where wait_time <= 0 and
status='ACTIVE‘ and wait_class != 'Idle';
#.11
Copyright 2006 Kyle Hailey
ASH
ASH Fields
Fields
SQL> v$active_session_history
Name Null? Type
SAMPLE_ID NUMBER
SAMPLE_TIME TIMESTAMP(3)
SESSION_ID NUMBER
SESSION_SERIAL# NUMBER
USER_ID NUMBER
SQL_ID VARCHAR2(13)
SQL_CHILD_NUMBER NUMBER
SQL_PLAN_HASH_VALUE NUMBER
SQL_OPCODE NUMBER
SERVICE_HASH NUMBER
SESSION_TYPE VARCHAR2(10)
SESSION_STATE VARCHAR2(7)
QC_SESSION_ID NUMBER
QC_INSTANCE_ID NUMBER
EVENT VARCHAR2(64)
EVENT_ID NUMBER
EVENT# NUMBER
SEQ# NUMBER
P1 NUMBER
P2 NUMBER
P3 NUMBER
WAIT_TIME NUMBER
TIME_WAITED NUMBER
CURRENT_OBJ# NUMBER
CURRENT_FILE# NUMBER
CURRENT_BLOCK# NUMBER
PROGRAM VARCHAR2(48)
MODULE VARCHAR2(48)
ACTION VARCHAR2(32)
CLIENT_ID VARCHAR2(64
#.12
Copyright 2006 Kyle Hailey
v$active_session_history
SESSION_ID NUMBER
SESSION_SERIAL# NUMBER
USER_ID NUMBER
SERVICE_HASH NUMBER
SESSION_TYPE VARCHAR2(10)
PROGRAM VARCHAR2(64)
MODULE VARCHAR2(48)
ACTION VARCHAR2(32)
CLIENT_ID VARCHAR2(64)
EVENT VARCHAR2(64)
EVENT_ID NUMBER
EVENT# NUMBER
SEQ# NUMBER
P1 NUMBER
P2 NUMBER
P3 NUMBER
WAIT_TIME NUMBER
TIME_WAITED NUMBER
CURRENT_OBJ# NUMBER
CURRENT_FILE# NUMBER
CURRENT_BLOCK# NUMBER0
SQL_ID VARCHAR2(13)
SQL_CHILD_NUMBER NUMBER
SQL_PLAN_HASH_VALUE NUMBER
SQL_OPCODE NUMBER
QC_SESSION_ID NUMBER
QC_INSTANCE_ID NUMBER
SAMPLE_ID NUMBER
SAMPLE_TIME TIMESTAMP(3)
SESSION_STATE VARCHAR2(7)
WAIT_TIME NUMBER
TIME_WAITED NUMBER
When
Session
SQL
Wait
State
#.13
Copyright 2006 Kyle Hailey
Primary Fields of
Primary Fields of ASH
ASH
SESSION_ID
EVENT
SQL_ID
SAMPLE_TIME Time
Session
SQL
Wait
SESSION_STATE State
Activity : Who, What, When, How
Who
What
When
How
#.14
Copyright 2006 Kyle Hailey
Amazing things YOU can do
Top Consumers
 Session
 User
 Object
 Module.Action
 Program
 Service
 Client
 Wait
X
Top Resources
• CPU
• Waits
• Event (800*)
• I/O
• File
• Block
• Time
(32 columns in ASH 10.1)
Top SQL
 SQL ID
 Plan
 Child#
X
And Aggregated over any time Period
#.15
Multi-dimensional
Multi-dimensional
25 34 36 38 45 63 65 87
25 34 36 38 45 63 65 87
F1qcyh20550cf
F1qcyh20550cf
fj6gjgsshtxyx
fj6gjgsshtxyx
0cjsxw5ndqdbc
0cjsxw5ndqdbc
8t8as9usk11qw
8t8as9usk11qw
dr1rkrznhh95b
dr1rkrznhh95b
10dkqv3kr8xa5
10dkqv3kr8xa5
38zhkf4jdyff4
38zhkf4jdyff4
298wmz1kxjs1m
298wmz1kxjs1m
CPU
CPU
Enq: TX
–
row
lock
contention
Enq: TX
–
row
lock
contention
SQ
L*Net break/reset to
client
SQ
L*Net break/reset to
client
db
file
scattered
read
db
file
scattered
read
db
file
sequential read
db
file
sequential read
IO
IO
Application
Application
SQL
SQL
Sessions
Sessions
W
aits
W
aits
Statistics
Statistics
Service
Service
Scott
Scott System
System
User
User
Program
Program
Sys
Sys
Sqlplus
Sqlplus Toad
Toad
GL
GL OE
OE
Package
Procedure
Plan
Child #
#.16
Copyright 2006 Kyle Hailey
Groupings – Top Consumer
SESSION_ID
SESSION_SERIAL# (identify SID reuse)
SESSION_TYPE (FOREGROUND,BACKGROUND)
CURRENT_OBJ#
CURRENT_FILE#
CURRENT_BLOCK#
USER_ID (SYS, SYSTEM, SCOTT etc)
SERVICE_HASH (OE,GL,HR)
PROGRAM (SQL, JDBC, Forms etc)
MODULE.ACTION (PLSQL tagging)
CLIENT_ID (identifying users in session pool)
SQL_ID
QC_SESSION_ID (Query Coordinator)
QC_INSTANCE_ID (RAC)
EVENT + P1, P2, P3
#.17
Copyright 2006 Kyle Hailey
Select
session_id,
count(*)
from
v$active_session_history
where
session_state= ‘ON CPU‘ and
SAMPLE_TIME > sysdate – (5/(24*60))
group by
session_id
order by
count(*) desc;
Top CPU Session
Top CPU Session
Top CPU consuming Session in last 5 minutes
Who is the rogue session ?
#.18
Copyright 2006 Kyle Hailey
Results Top CPU Session
SESSION_ID COUNT(*)
---------- ----------
257 299
263 62
256 32
264 9
277 3
258 1
#.19
Copyright 2006 Kyle Hailey
CPU with Bars
CPU with Bars
SESSION_ID COUNT(*) % Bar
---------- ---------- ---------- ------------
257 299 99 |**********|
263 62 21 |** |
256 32 11 |* |
264 9 3 | |
277 3 1 | |
258 1 0 | |
280 1 0 | |
Bar shows 10% increments
#.20
Copyright 2006 Kyle Hailey
Select
session_id,
count(*)
from
v$active_session_history
where
session_state=‘WAITING’ and
SAMPLE_TIME > SYSDATE - (5/(24*60))
group by
session_id
order by
count(*) desc;
Top Waiting Session
Top Waiting Session
 Top Waiting Session in last 5 minutes
#.21
Copyright 2006 Kyle Hailey
SESSION_ID COUNT(*)
---------- ----------
272 224
254 8
249 5
276 5
277 4
270 1
Top Waiting Session Results
#.22
Copyright 2006 Kyle Hailey
Top SQL from
Top SQL from ASH
ASH
select
ash.SQL_ID ,
sum(decode(ash.session_state,'ON CPU',1,0)) "CPU",
sum(decode(ash.session_state,'WAITING',1,0)) -
sum(decode(ash.session_state,'WAITING', decode(en.wait_class, 'User I/O',1,0),0)) "WAIT" ,
sum(decode(ash.session_state,'WAITING', decode(en.wait_class, 'User I/O',1,0),0)) "IO" ,
sum(decode(ash.session_state,'ON CPU',1,1)) "TOTAL"
from v$active_session_history ash,
v$event_name en
where SQL_ID is not NULL and en.event#=ash.event#
group by sql_id
order by sum(decode(session_state,'ON CPU',1,1)) desc
#.23
Copyright 2006 Kyle Hailey
Top SQL from
Top SQL from ASH
ASH Results
Results
SQL_ID CPU WAITING IO TOTAL
------------- ---------- ---------- ---------- ----------
4c1xvq9ufwcjc 23386 0 0 23386
6wjw6rz5uvbp3 99 0 23 122
968dm8hr9qd03 97 0 22 119
938jp5gasmrah 90 0 25 115
cv8xnv81kf582 42 0 9 51
6p9bzu19v965k 21 0 0 21
5zu8pxnun66bu 15 0 0 15
db2jr13nup72v 9 0 0 9
7ks5gnj38hghv 8 0 0 8
#.24
Copyright 2006 Kyle Hailey
Top Session
Top Session
select
ash.session_id,
ash.session_serial#,
ash.user_id,
ash.program,
sum(decode(ash.session_state,'ON CPU',1,0)) "CPU",
sum(decode(ash.session_state,'WAITING',1,0)) -
sum(decode(ash.session_state,'WAITING',
decode(en.wait_class,'User I/O',1, 0 ), 0)) "WAITING" ,
sum(decode(ash.session_state,'WAITING',
decode(en.wait_class,'User I/O',1, 0 ), 0)) "IO" ,
sum(decode(session_state,'ON CPU',1,1)) "TOTAL"
from v$active_session_history ash,
v$event_name en
where en.event# = ash.event#
group by session_id,user_id,session_serial#,program
order by sum(decode(session_state,'ON CPU',1,1))
#.25
Copyright 2006 Kyle Hailey
Top Session Results
Top Session Results
SESSION_ID SERIAL# USER_ID PROGRAM CPU WAITING IO
---------- ------- ---------- ------------------------- ------- ---------- ----------
247 61970 1 sqlplus 11698 0 0
277 1 0 oracle@labsfrh903 (LGWR) 14 21 0
276 1 0 oracle@labsfrh903 (CKPT) 19 10 0
278 1 0 oracle@labsfrh903 (DBW0) 29 0 0
280 1 0 oracle@labsfrh903 (PMON) 19 0 0
254 22617 5 Executor.exe 13 0 3
255 12877 5 Executor.exe 11 0 5
257 33729 5 Executor.exe 15 0 1
255 13417 5 Executor.exe 14 0 2
#.26
Copyright 2006 Kyle Hailey
Top Session w/ Username
select
decode(nvl(to_char(s.sid),-1),-1,'DISCONNECTED','CONNECTED')
"STATUS",
topsession.session_id "SESSION_ID",
u.name "NAME",
topsession.program "PROGRAM",
max(topsession.CPU) "CPU",
max(topsession.WAITING) "WAITING",
max(topsession.IO) "IO",
max(topsession.TOTAL) "TOTAL"
from ( {previous query} ) topsession,
v$session s,
user$ u
where
u.user# =topsession.user_id and
/* outer join to v$session because the session might be disconnected */
topsession.session_id = s.sid (+) and
topsession.session_serial# = s.serial# (+)
group by topsession.session_id, topsession.session_serial#, topsession.user_id,
topsession.program, s.username,s.sid,s.paddr,u.name
order by max(topsession.TOTAL) desc
#.27
Copyright 2006 Kyle Hailey
Top Session
Top Session
Finding a Rogue User
STATUS SESSION_ID NAME PROGRAM CPU WAITING IO
--------------- ---------- ---------- ------------------------- ----- ---------- ----
CONNECTED 247 CPU_Monger ChMgr304.exe 11704 0 0
CONNECTED 277 SYS oracle@labsfrh903 (LGWR) 14 19 0
CONNECTED 278 SYS oracle@labsfrh903 (DBW0) 29 0 0
CONNECTED 276 SYS oracle@labsfrh903 (CKPT) 18 9 0
CONNECTED 280 SYS oracle@labsfrh903 (PMON) 20 0 0
DISCONNECTED 255 SYSTEM Executor.exe 11 4 5
DISCONNECTED 257 SYSTEM Executor.exe 13 0 3
DISCONNECTED 255 SYSTEM Executor.exe 14 0 2
DISCONNECTED 257 SYSTEM Executor.exe 13 0 3
#.28
Copyright 2006 Kyle Hailey
Many Ways to Attack Problems
Confusing
 How to Attack the problem?
 Top SQL?
 Top wait for that SQL?
 Top Waiting Session ?
 Top Waits for that Session
 Top Waits for Database?
 Top Session waiting for that wait
 Top SQL for that wait
Solution - Graphics
#.29
Copyright 2006 Kyle Hailey
Mining Data is Non Trivial
 Many Dimensions to consider
 Constantly Varying time frames
 Luckily 10g automates all of this functionality.
 collects all of the data
 analyses all the wait events
 reports on bottlenecks
 supplies solutions
 Graphics add tremendous ease and power
#.30
Copyright 2006 Kyle Hailey
OEM Perf Page
OEM Perf Page
#.31
Copyright 2006 Kyle Hailey
ASH Sampling Cheap
ASH Sampling Cheap
Three ways to sample – comparison of impact:
1.With PL/SQL it’s less that 1 % CPU with 10
average active sessions
2.DMA - direct memory attach to SGA Using C
code 200x Cheaper
3.ASH in 10g should be even cheaper than
DMA because it’s done in the kernel
#.32
Copyright 2006 Kyle Hailey
ASH
ASH – In Memory
– In Memory
 Collects active session data only
 History v$session_wait + v$session + extras
 Circular Buffer - 1M to 128M (~2% of SGA)
 Flushed every hour to disk or when buffer 2/3 full
(it protects itself so you can relax)
#.33
Copyright 2006 Kyle Hailey
ASH
ASH Sizing …
Sizing …
 Avg row around 150bytes
 3600 secs in an hour
 ~ ½ Meg per Active Session per hour
 That’s generally over 2 hours of ASH
#.34
Copyright 2006 Kyle Hailey
How ASH works
How ASH works
V$session_wait
+ v$session +
extras
MMON/
MMNL
v$active_session_history
wrh$_active_session_history
Only writes out 1 in 10 rows
via direct path inserts
MMON - manageability monitor, AWR
M000 – MMON background slave, runs snapshots
MMNL - MMON lite, flushes ASH to disk
#.35
Copyright 2006 Kyle Hailey
Select reads
backwards
-No latching
-Index on time
-No read consistency
Insert point
ASH buffer
ASH buffer
Insert one direction
Touch up wait times
#.36
Copyright 2006 Kyle Hailey
Family of ASH Tables
v$session
v$active_session_history
wrh$active_session_history
v$session_wait_history
DBA_HIST_ACTIVE_SESS_HISTORY
Real time
~2 hours
1 week
Last 10 waits
(before 10g v$session_wait)
#.37
Copyright 2006 Kyle Hailey
Wait Time vs Time Waited
 SESSION_STATE
 Waiting, on CPU
 Based on WAIT_TIME
 WAIT_TIME (v$session, v$session_wait, v$ash)
 0 => waiting
 >0 => CPU (value is time of last wait)
 TIME_WAITED
 Actual time waited for event
 0 until wait finishes
 Fix up values (no one else can do this)
#.38
Copyright 2006 Kyle Hailey
Oradebug
Oradebug
 Dump to trace file
SQL> oradebug dump ash 5
SQL> Alter session set events ‘immediate
tracename ashdump level 5’;
level 5 = # of minutes
loader file rdbms/demo/ashldr.ctl
SQL> oradebug dump ashdump 5
SQL> Alter session set events ‘immediate
trace name ashdump level 5’;
#.39
Copyright 2006 Kyle Hailey
INIT.ORA
INIT.ORA
statistics_level = Typical (default)
PARAMETER SESSION_VALUE INSTANCE_VAL
----------------------- ---------- ------------
_ash_sampling_interval 1000 1000
milliseconds
_ash_size 1048618 1048618
ASH buffer size
_ash_enable TRUE TRUE
Turn on/off ASH sampling, flushing and the V$ views on ASH
_ash_disk_write_enable TRUE TRUE
Flush to disk
_ash_disk_filter_ratio 10 10
write 1 in 10 points
_ash_sample_all FALSE FALSE
Sample including idle waits
#.40
10.2 ASH Extras
10.2 ASH Extras
 Blocking Session !
BLOCKING_SESSION
BLOCKING_SESSION_STATUS
BLOCKING_SESSION_SERIAL#
40
10/26/24
RAC event Fixup
RAC event Fixup
Plan Hash Fix up
Plan Hash Fix up
10gR1 - during parsing no plan,
good way to find parsing
problems
problems
10gR2 – get plan hash fixup –
good but lose some ability to find
parsing problems
parsing problems
Parameter Names
 P1TEXT , P2TEXT, P3TEXT
Wait Grouping
WAIT_CLASS
WAIT_CLASS_ID
XID
FORCE_MATCHING_SIGNATURE
Cursor sharing
#.41
10.2.0.3 ASH Extras
10.2.0.3 ASH Extras
PLSQL_ENTRY_OBJECT_ID
PLSQL_ENTRY_SUBPROGRAM_ID
PLSQL_OBJECT_ID
PLSQL_SUBPROGRAM_ID
41
10/26/24
ALL_PROCEDURES
ALL_PROCEDURES
where object_id = plsql_object_id
and subprogram_id = plsql_subprogram_id
#.42
42
10/26/24
PLSQL Tracking
PLSQL Tracking
Package/Procedure/SQL tracking 10.2.0.3
calling_code SQL_ID COUNT(*)
----------------------------------------------- ----------
ORDERENTRY.NEWORDER 0uuqgjq7k12nf 258
ORDERENTRY.NEWCUSTOMER 0bzhqhhj9mpaa 262
ORDERENTRY.BROWSEANDUPDATEORDERS 41zu158rqf4kf 301
ORDERENTRY.NEWORDER 0yas01u2p9ch4 569
PARSE_SAME 3vjxpmhhzngu4 874
ORDERENTRY.BROWSEANDUPDATEORDERS 05s4vdwsf5802 1669
select
object_name package||.|| procedure_name, sql_id, count(*)
from v$active_session_history ash,
all_procedures procs
where
ash.PLSQL_ENTRY_OBJECT_ID = procs.object_id
and ash.PLSQL_ENTRY_SUBPROGRAM_ID = procs.SUBPROGRAM_ID
#.43
Copyright 2006 Kyle Hailey
11.1g ASH extras
11.1g ASH extras
SQL Elapsed
SQL Elapsed
SQL_EXEC_ID
SQL_EXEC_START
IN_CONNECTION_MGMT
IN_PARSE
IN_HARD_PARSE
IN_SQL_EXECUTION
IN_PLSQL_EXECUTION
IN_PLSQL_RPC
IN_PLSQL_COMPILATION
IN_JAVA_EXECUTION
IN_BIND
IN_CURSOR_CLOSE
SQL_PLAN_LINE_ID
SQL_PLAN_OPERATION
SQL_PLAN_OPTIONS
CURRENT_ROW#
EVENT#
QC_SESSION_SERIAL#
CONSUMER_GROUP_ID
FLAGS
ETC
ETC
Operation bit vector – non timed ops
SQL Row Source
SQL Row Source
REMOTE_INSTANCE#
Which instance requested block?
TOP_LEVEL_SQL_ID
TOP_LEVEL_SQL_OPCODE
Recursive SQL
Recursive SQL
#.44
Copyright 2006 Kyle Hailey
11.2g ASH extras
11.2g ASH extras
Statistics
Statistics
TM_DELTA_TIME
TM_DELTA_CPU_TIME
TM_DELTA_DB_TIME
DELTA_TIME
DELTA_READ_IO_REQUESTS
DELTA_WRITE_IO_REQUESTS
DELTA_READ_IO_BYTES
DELTA_WRITE_IO_BYTES
DELTA_INTERCONNECT_IO_BYTES
PGA_ALLOCATED
TEMP_SPACE_ALLOCATE
#.45
Copyright 2006 Kyle Hailey
10.1
10.1 10.2
10.2 10.2.0.3
10.2.0.3 11.1
11.1 11.2
11.2
When
Who
SQL
Waits
Blocker
Statistics
ASH Across Versions
ASH Across Versions
ASH
instrumentation
is exploding
across the
versions
#.46
Copyright 2006 Kyle Hailey
How Many Active Sessions?
 How much data does ASH Collect ?
 1 CPU means max 1 Avg Active Session unless there
is a bottleneck
Big site examples:
 Oracle 4 way RAC internal apps
 10,000 connected, 200 active
 One Site
 3000 connected, 30 Active
 Site
 12,000 connected, 100 active
#.47
Copyright 2006 Kyle Hailey
ASH Summary
ASH Summary
 Rich & Multidimensional
 Overview of system load
 Drilldowns into problems
 Sql
 Session
 Wait event
 Details information on problem resolution
 Sampling is the future
 Took clean vision to create - Bit of a leap of faith
 Less Accurate but more powerful than past
 Inaccuracies unimportant for the most part
 Feasible since version 7
 You can implement it yourself
 OEM simplifies mining of ASH data
#.48
Q1
Q1
Copyright 2006 Kyle Hailey
How can you immediately find the top IO consuming SQ
statement in the last 60 seconds
a. v$active_session_history
b. v$sqlstats
b. v$sqlstats
c. v$sql
c. v$sql
d. v$sqlarea
d. v$sqlarea
answer
answer
a only
a only
others
others
b,c,d - only have cumulative values
since database startup
#.49
Q2
Q2
Copyright 2006 Kyle Hailey
Which view can you query directly to
get the specific waits that occurred
30 minutes ago:
30 minutes ago:
a. v$active_session_history
b. v$waitclassmetric
c. v$system_event
c. v$system_event
d. v$session_wait_history
e. v$waitclassmetric_history
a only
a only
b - last 60 seconds only
c - cumulative info since db startup
d - last 10 waits only
e - only wait groups, not wait events, but has
the history for last hour
#.50
Q3
Q3
Copyright 2006 Kyle Hailey
ASH (v$active_session_history) is a revolutionary data
source for monitoring and analyzing database
performance. The view v$active_session_history is new
in 10g, but most of the data needed in order to simulate
v$active_session_history by hand has been available
since which version
since which version
a. 6
a. 6
b. 7
b. 7
c. 8
c. 8
d. 9
d. 9
e. 10
e. 10
b - since version 7 when wait events
were introduced along with the view
v$session_wait
v$session_wait
which is the foundation for ASH

ash_feel_the_power_kyle_hailey_8951122.ppt

  • 1.
    #.1 ASH ASH – – ActiveSession History Active Session History Feel the Power Feel the Power Kyle Hailey http://perfvision.com
  • 2.
    #.2 Copyright 2006 KyleHailey Why should you care? Why should you care? Because ASH can Change your life …  10g immediately Accessible  Geeks: Via scripts in SQL  Managers : Graphical OEM  Stuck on Oracle 7,8,9 ? … my apologies because 10g rocks, but … no worries, the data is accessible for you too via scripts http://perfvision.com/sash.php
  • 3.
    #.3 Copyright 2006 KyleHailey Revolution and an Evolution Revolution and an Evolution Oracle 6 … ie the dark ages … there was once the Cache Buffer Hit Ratio Oracle 7 … turned the lights on … Wait Events … hallelujah I can see the light Oracle 10g … ASH has landed (like the wheels on the suitcases)
  • 4.
    #.4 Copyright 2006 KyleHailey Sampling Sampling New Paradigm New Paradigm  Clear Vision of the future  Use new sampling technology  Lets go of the need to know 100%  Statistical approximation  Cheaper  Richer Multidimensional Data  Identifies  SQL  Sessions  Objects  Machine  User
  • 5.
    #.5 Copyright 2006 KyleHailey Identify Players before ASH Identify Players before ASH  Sessions v$sesstat, v$session_event  # sessions x (# wait events + statistics)  Example (150 x (800+200) = 150,000 )  SQL  v$sql  Could be 10000s  Takes out latches that compete with other sql executions  Objects  V$segstat 9i+  Could be 1000s of objects Expensive ! Also files v$filestat
  • 6.
    #.6 Copyright 2006 KyleHailey ASH ASH Intelligence for the new Millennium Intelligence for the new Millennium  Intelligently Collects Data  Samples once a second  Collects active sessions only  Collects Session/SQL/Wait  More activity, more data collected  Less activity, less data collected  Those old methods collected everything  Obfuscated the problem, too many statistics too late  Costly  Too Granular – once an hour ?! Give me a break  Collects fine grain multidimensional data
  • 7.
    #.7 Copyright 2006 KyleHailey IDLE IDLE  Example : SQL*Net Message from Client  10g  9i or below – just have to keep track  Statspack STATS$IDLE_EVENT select name from v$event_name where wait_class='Idle'; 58 Rows select * from v$session where wait_class != 'Idle' and status='ACTIVE';
  • 8.
    #.8 Copyright 2006 KyleHailey CPU CPU  ASH: SESSION_STATE = “ON CPU” 10g: v$session 9i: v$session_wait w.wait_time != 0 /* on CPU */ and s.status='ACTIVE' /* ACTIVE */ Identifying CPU via v$session_wait is a huge break through Identifying CPU via v$session_wait is a huge break through select * from v$session where wait_time > 0 and status='ACTIVE';
  • 9.
    #.9 Copyright 2006 KyleHailey IO IO  ASH: SESSION_STATE=‘WAITING’ and …  10g: WAIT_CLASS=‘User I/O’  9i:  Look at 10g for ideas  db file sequential read  db file scattered read  db file parallel read  direct path read select * from v$session where wait_class = 'User I/O‘ and wait_time <= 0;
  • 10.
    #.10 Copyright 2006 KyleHailey WAITING WAITING  ASH: SESSION_STATE=‘WAITING’  WAIT_CLASS 1. Administrative 2. Application 3. Cluster 4. Commit 5. Concurrency 6. Configuration 7. Network 8. Other 9. Scheduler 10. System I/O  800+ WAIT select * from v$session where wait_time <= 0 and select * from v$session where wait_time <= 0 and status='ACTIVE‘ and wait_class != 'Idle'; status='ACTIVE‘ and wait_class != 'Idle';
  • 11.
    #.11 Copyright 2006 KyleHailey ASH ASH Fields Fields SQL> v$active_session_history Name Null? Type SAMPLE_ID NUMBER SAMPLE_TIME TIMESTAMP(3) SESSION_ID NUMBER SESSION_SERIAL# NUMBER USER_ID NUMBER SQL_ID VARCHAR2(13) SQL_CHILD_NUMBER NUMBER SQL_PLAN_HASH_VALUE NUMBER SQL_OPCODE NUMBER SERVICE_HASH NUMBER SESSION_TYPE VARCHAR2(10) SESSION_STATE VARCHAR2(7) QC_SESSION_ID NUMBER QC_INSTANCE_ID NUMBER EVENT VARCHAR2(64) EVENT_ID NUMBER EVENT# NUMBER SEQ# NUMBER P1 NUMBER P2 NUMBER P3 NUMBER WAIT_TIME NUMBER TIME_WAITED NUMBER CURRENT_OBJ# NUMBER CURRENT_FILE# NUMBER CURRENT_BLOCK# NUMBER PROGRAM VARCHAR2(48) MODULE VARCHAR2(48) ACTION VARCHAR2(32) CLIENT_ID VARCHAR2(64
  • 12.
    #.12 Copyright 2006 KyleHailey v$active_session_history v$active_session_history SESSION_ID NUMBER SESSION_SERIAL# NUMBER USER_ID NUMBER SERVICE_HASH NUMBER SESSION_TYPE VARCHAR2(10) PROGRAM VARCHAR2(64) MODULE VARCHAR2(48) ACTION VARCHAR2(32) CLIENT_ID VARCHAR2(64) EVENT VARCHAR2(64) EVENT_ID NUMBER EVENT# NUMBER SEQ# NUMBER P1 NUMBER P2 NUMBER P3 NUMBER WAIT_TIME NUMBER TIME_WAITED NUMBER CURRENT_OBJ# NUMBER CURRENT_FILE# NUMBER CURRENT_BLOCK# NUMBER0 SQL_ID VARCHAR2(13) SQL_CHILD_NUMBER NUMBER SQL_PLAN_HASH_VALUE NUMBER SQL_OPCODE NUMBER QC_SESSION_ID NUMBER QC_INSTANCE_ID NUMBER SAMPLE_ID NUMBER SAMPLE_TIME TIMESTAMP(3) SESSION_STATE VARCHAR2(7) WAIT_TIME NUMBER TIME_WAITED NUMBER When Session SQL Wait State
  • 13.
    #.13 Copyright 2006 KyleHailey Primary Fields of Primary Fields of ASH ASH SESSION_ID EVENT SQL_ID SAMPLE_TIME Time Session SQL Wait SESSION_STATE State Activity : Who, What, When, How Who What When How
  • 14.
    #.14 Copyright 2006 KyleHailey Amazing things YOU can do Amazing things YOU can do Top Consumers  Session  User  Object  Module.Action  Program  Service  Client  Wait X Top Resources • CPU • Waits • Event (800*) • I/O • File • Block • Time (32 columns in ASH 10.1) Top SQL  SQL ID  Plan  Child# X And Aggregated over any time Period
  • 15.
    #.15 Multi-dimensional Multi-dimensional 25 34 3638 45 63 65 87 25 34 36 38 45 63 65 87 F1qcyh20550cf F1qcyh20550cf fj6gjgsshtxyx fj6gjgsshtxyx 0cjsxw5ndqdbc 0cjsxw5ndqdbc 8t8as9usk11qw 8t8as9usk11qw dr1rkrznhh95b dr1rkrznhh95b 10dkqv3kr8xa5 10dkqv3kr8xa5 38zhkf4jdyff4 38zhkf4jdyff4 298wmz1kxjs1m 298wmz1kxjs1m CPU CPU Enq: TX – row lock contention Enq: TX – row lock contention SQ L*Net break/reset to client SQ L*Net break/reset to client db file scattered read db file scattered read db file sequential read db file sequential read IO IO Application Application SQL SQL Sessions Sessions W aits W aits Statistics Statistics Service Service Scott Scott System System User User Program Program Sys Sys Sqlplus Sqlplus Toad Toad GL GL OE OE Package Procedure Plan Child #
  • 16.
    #.16 Copyright 2006 KyleHailey Groupings – Top Consumer Groupings – Top Consumer SESSION_ID SESSION_SERIAL# (identify SID reuse) SESSION_TYPE (FOREGROUND,BACKGROUND) CURRENT_OBJ# CURRENT_FILE# CURRENT_BLOCK# USER_ID (SYS, SYSTEM, SCOTT etc) SERVICE_HASH (OE,GL,HR) PROGRAM (SQL, JDBC, Forms etc) MODULE.ACTION (PLSQL tagging) CLIENT_ID (identifying users in session pool) SQL_ID QC_SESSION_ID (Query Coordinator) QC_INSTANCE_ID (RAC) EVENT + P1, P2, P3
  • 17.
    #.17 Copyright 2006 KyleHailey Select session_id, count(*) from v$active_session_history where session_state= ‘ON CPU‘ and SAMPLE_TIME > sysdate – (5/(24*60)) group by session_id order by count(*) desc; Top CPU Session Top CPU Session Top CPU consuming Session in last 5 minutes Who is the rogue session ? Who is the rogue session ?
  • 18.
    #.18 Copyright 2006 KyleHailey Results Top CPU Session Results Top CPU Session SESSION_ID COUNT(*) ---------- ---------- 257 299 263 62 256 32 264 9 277 3 258 1
  • 19.
    #.19 Copyright 2006 KyleHailey CPU with Bars CPU with Bars SESSION_ID COUNT(*) % Bar ---------- ---------- ---------- ------------ 257 299 99 |**********| 263 62 21 |** | 256 32 11 |* | 264 9 3 | | 277 3 1 | | 258 1 0 | | 280 1 0 | | Bar shows 10% increments Bar shows 10% increments
  • 20.
    #.20 Copyright 2006 KyleHailey Select session_id, count(*) from v$active_session_history where session_state=‘WAITING’ and SAMPLE_TIME > SYSDATE - (5/(24*60)) group by session_id order by count(*) desc; Top Waiting Session Top Waiting Session  Top Waiting Session in last 5 minutes
  • 21.
    #.21 Copyright 2006 KyleHailey SESSION_ID COUNT(*) ---------- ---------- 272 224 254 8 249 5 276 5 277 4 270 1 Top Waiting Session Results Top Waiting Session Results
  • 22.
    #.22 Copyright 2006 KyleHailey Top SQL from Top SQL from ASH ASH select ash.SQL_ID , sum(decode(ash.session_state,'ON CPU',1,0)) "CPU", sum(decode(ash.session_state,'WAITING',1,0)) - sum(decode(ash.session_state,'WAITING', decode(en.wait_class, 'User I/O',1,0),0)) "WAIT" , sum(decode(ash.session_state,'WAITING', decode(en.wait_class, 'User I/O',1,0),0)) "IO" , sum(decode(ash.session_state,'ON CPU',1,1)) "TOTAL" from v$active_session_history ash, v$event_name en where SQL_ID is not NULL and en.event#=ash.event# group by sql_id order by sum(decode(session_state,'ON CPU',1,1)) desc select ash.SQL_ID , sum(decode(ash.session_state,'ON CPU',1,0)) "CPU", sum(decode(ash.session_state,'WAITING',1,0)) - sum(decode(ash.session_state,'WAITING', decode(en.wait_class, 'User I/O',1,0),0)) "WAIT" , sum(decode(ash.session_state,'WAITING', decode(en.wait_class, 'User I/O',1,0),0)) "IO" , sum(decode(ash.session_state,'ON CPU',1,1)) "TOTAL" from v$active_session_history ash, v$event_name en where SQL_ID is not NULL and en.event#=ash.event# group by sql_id order by sum(decode(session_state,'ON CPU',1,1)) desc
  • 23.
    #.23 Copyright 2006 KyleHailey Top SQL from Top SQL from ASH ASH Results Results SQL_ID CPU WAITING IO TOTAL ------------- ---------- ---------- ---------- ---------- 4c1xvq9ufwcjc 23386 0 0 23386 6wjw6rz5uvbp3 99 0 23 122 968dm8hr9qd03 97 0 22 119 938jp5gasmrah 90 0 25 115 cv8xnv81kf582 42 0 9 51 6p9bzu19v965k 21 0 0 21 5zu8pxnun66bu 15 0 0 15 db2jr13nup72v 9 0 0 9 7ks5gnj38hghv 8 0 0 8
  • 24.
    #.24 Copyright 2006 KyleHailey Top Session Top Session select ash.session_id, ash.session_serial#, ash.user_id, ash.program, sum(decode(ash.session_state,'ON CPU',1,0)) "CPU", sum(decode(ash.session_state,'WAITING',1,0)) - sum(decode(ash.session_state,'WAITING', decode(en.wait_class,'User I/O',1, 0 ), 0)) "WAITING" , sum(decode(ash.session_state,'WAITING', decode(en.wait_class,'User I/O',1, 0 ), 0)) "IO" , sum(decode(session_state,'ON CPU',1,1)) "TOTAL" from v$active_session_history ash, v$event_name en where en.event# = ash.event# group by session_id,user_id,session_serial#,program order by sum(decode(session_state,'ON CPU',1,1)) select ash.session_id, ash.session_serial#, ash.user_id, ash.program, sum(decode(ash.session_state,'ON CPU',1,0)) "CPU", sum(decode(ash.session_state,'WAITING',1,0)) - sum(decode(ash.session_state,'WAITING', decode(en.wait_class,'User I/O',1, 0 ), 0)) "WAITING" , sum(decode(ash.session_state,'WAITING', decode(en.wait_class,'User I/O',1, 0 ), 0)) "IO" , sum(decode(session_state,'ON CPU',1,1)) "TOTAL" from v$active_session_history ash, v$event_name en where en.event# = ash.event# group by session_id,user_id,session_serial#,program order by sum(decode(session_state,'ON CPU',1,1))
  • 25.
    #.25 Copyright 2006 KyleHailey Top Session Results Top Session Results SESSION_ID SERIAL# USER_ID PROGRAM CPU WAITING IO ---------- ------- ---------- ------------------------- ------- ---------- ---------- 247 61970 1 sqlplus 11698 0 0 277 1 0 oracle@labsfrh903 (LGWR) 14 21 0 276 1 0 oracle@labsfrh903 (CKPT) 19 10 0 278 1 0 oracle@labsfrh903 (DBW0) 29 0 0 280 1 0 oracle@labsfrh903 (PMON) 19 0 0 254 22617 5 Executor.exe 13 0 3 255 12877 5 Executor.exe 11 0 5 257 33729 5 Executor.exe 15 0 1 255 13417 5 Executor.exe 14 0 2
  • 26.
    #.26 Copyright 2006 KyleHailey Top Session w/ Username Top Session w/ Username select decode(nvl(to_char(s.sid),-1),-1,'DISCONNECTED','CONNECTED') "STATUS", topsession.session_id "SESSION_ID", u.name "NAME", topsession.program "PROGRAM", max(topsession.CPU) "CPU", max(topsession.WAITING) "WAITING", max(topsession.IO) "IO", max(topsession.TOTAL) "TOTAL" from ( {previous query} ) topsession, v$session s, user$ u where u.user# =topsession.user_id and /* outer join to v$session because the session might be disconnected */ topsession.session_id = s.sid (+) and topsession.session_serial# = s.serial# (+) group by topsession.session_id, topsession.session_serial#, topsession.user_id, topsession.program, s.username,s.sid,s.paddr,u.name order by max(topsession.TOTAL) desc
  • 27.
    #.27 Copyright 2006 KyleHailey Top Session Top Session Finding a Rogue User Finding a Rogue User STATUS SESSION_ID NAME PROGRAM CPU WAITING IO --------------- ---------- ---------- ------------------------- ----- ---------- ---- CONNECTED 247 CPU_Monger ChMgr304.exe 11704 0 0 CONNECTED 277 SYS oracle@labsfrh903 (LGWR) 14 19 0 CONNECTED 278 SYS oracle@labsfrh903 (DBW0) 29 0 0 CONNECTED 276 SYS oracle@labsfrh903 (CKPT) 18 9 0 CONNECTED 280 SYS oracle@labsfrh903 (PMON) 20 0 0 DISCONNECTED 255 SYSTEM Executor.exe 11 4 5 DISCONNECTED 257 SYSTEM Executor.exe 13 0 3 DISCONNECTED 255 SYSTEM Executor.exe 14 0 2 DISCONNECTED 257 SYSTEM Executor.exe 13 0 3
  • 28.
    #.28 Copyright 2006 KyleHailey Many Ways to Attack Problems Many Ways to Attack Problems Confusing  How to Attack the problem?  Top SQL?  Top wait for that SQL?  Top Waiting Session ?  Top Waits for that Session  Top Waits for Database?  Top Session waiting for that wait  Top SQL for that wait Solution - Graphics
  • 29.
    #.29 Copyright 2006 KyleHailey Mining Data is Non Trivial Mining Data is Non Trivial  Many Dimensions to consider  Constantly Varying time frames  Luckily 10g automates all of this functionality.  collects all of the data  analyses all the wait events  reports on bottlenecks  supplies solutions  Graphics add tremendous ease and power
  • 30.
    #.30 Copyright 2006 KyleHailey OEM Perf Page OEM Perf Page
  • 31.
    #.31 Copyright 2006 KyleHailey ASH Sampling Cheap ASH Sampling Cheap Three ways to sample – comparison of impact: 1.With PL/SQL it’s less that 1 % CPU with 10 average active sessions 2.DMA - direct memory attach to SGA Using C code 200x Cheaper 3.ASH in 10g should be even cheaper than DMA because it’s done in the kernel
  • 32.
    #.32 Copyright 2006 KyleHailey ASH ASH – In Memory – In Memory  Collects active session data only  History v$session_wait + v$session + extras  Circular Buffer - 1M to 128M (~2% of SGA)  Flushed every hour to disk or when buffer 2/3 full (it protects itself so you can relax)
  • 33.
    #.33 Copyright 2006 KyleHailey ASH ASH Sizing … Sizing …  Avg row around 150bytes  3600 secs in an hour  ~ ½ Meg per Active Session per hour  That’s generally over 2 hours of ASH
  • 34.
    #.34 Copyright 2006 KyleHailey How ASH works How ASH works V$session_wait + v$session + extras MMON/ MMNL v$active_session_history wrh$_active_session_history Only writes out 1 in 10 rows via direct path inserts MMON - manageability monitor, AWR M000 – MMON background slave, runs snapshots MMNL - MMON lite, flushes ASH to disk
  • 35.
    #.35 Copyright 2006 KyleHailey Select reads backwards -No latching -Index on time -No read consistency Insert point ASH buffer ASH buffer Insert one direction Touch up wait times
  • 36.
    #.36 Copyright 2006 KyleHailey Family of ASH Tables Family of ASH Tables v$session v$active_session_history wrh$active_session_history v$session_wait_history DBA_HIST_ACTIVE_SESS_HISTORY Real time ~2 hours 1 week Last 10 waits (before 10g v$session_wait)
  • 37.
    #.37 Copyright 2006 KyleHailey Wait Time vs Time Waited Wait Time vs Time Waited  SESSION_STATE  Waiting, on CPU  Based on WAIT_TIME  WAIT_TIME (v$session, v$session_wait, v$ash)  0 => waiting  >0 => CPU (value is time of last wait)  TIME_WAITED  Actual time waited for event  0 until wait finishes  Fix up values (no one else can do this)
  • 38.
    #.38 Copyright 2006 KyleHailey Oradebug Oradebug  Dump to trace file SQL> oradebug dump ash 5 SQL> Alter session set events ‘immediate tracename ashdump level 5’; level 5 = # of minutes loader file rdbms/demo/ashldr.ctl SQL> oradebug dump ashdump 5 SQL> Alter session set events ‘immediate trace name ashdump level 5’;
  • 39.
    #.39 Copyright 2006 KyleHailey INIT.ORA INIT.ORA statistics_level = Typical (default) PARAMETER SESSION_VALUE INSTANCE_VAL ----------------------- ---------- ------------ _ash_sampling_interval 1000 1000 milliseconds _ash_size 1048618 1048618 ASH buffer size _ash_enable TRUE TRUE Turn on/off ASH sampling, flushing and the V$ views on ASH _ash_disk_write_enable TRUE TRUE Flush to disk _ash_disk_filter_ratio 10 10 write 1 in 10 points _ash_sample_all FALSE FALSE Sample including idle waits
  • 40.
    #.40 10.2 ASH Extras 10.2ASH Extras  Blocking Session ! BLOCKING_SESSION BLOCKING_SESSION_STATUS BLOCKING_SESSION_SERIAL# 40 10/26/24 RAC event Fixup RAC event Fixup Plan Hash Fix up Plan Hash Fix up 10gR1 - during parsing no plan, 10gR1 - during parsing no plan, good way to find parsing good way to find parsing problems problems 10gR2 – get plan hash fixup – 10gR2 – get plan hash fixup – good but lose some ability to find good but lose some ability to find parsing problems parsing problems Parameter Names  P1TEXT , P2TEXT, P3TEXT Wait Grouping WAIT_CLASS WAIT_CLASS_ID XID FORCE_MATCHING_SIGNATURE Cursor sharing
  • 41.
    #.41 10.2.0.3 ASH Extras 10.2.0.3ASH Extras PLSQL_ENTRY_OBJECT_ID PLSQL_ENTRY_SUBPROGRAM_ID PLSQL_OBJECT_ID PLSQL_SUBPROGRAM_ID 41 10/26/24 ALL_PROCEDURES ALL_PROCEDURES where object_id = plsql_object_id where object_id = plsql_object_id and subprogram_id = plsql_subprogram_id and subprogram_id = plsql_subprogram_id
  • 42.
    #.42 42 10/26/24 PLSQL Tracking PLSQL Tracking Package/Procedure/SQLtracking 10.2.0.3 calling_code SQL_ID COUNT(*) ----------------------------------------------- ---------- ORDERENTRY.NEWORDER 0uuqgjq7k12nf 258 ORDERENTRY.NEWCUSTOMER 0bzhqhhj9mpaa 262 ORDERENTRY.BROWSEANDUPDATEORDERS 41zu158rqf4kf 301 ORDERENTRY.NEWORDER 0yas01u2p9ch4 569 PARSE_SAME 3vjxpmhhzngu4 874 ORDERENTRY.BROWSEANDUPDATEORDERS 05s4vdwsf5802 1669 select object_name package||.|| procedure_name, sql_id, count(*) from v$active_session_history ash, all_procedures procs where ash.PLSQL_ENTRY_OBJECT_ID = procs.object_id and ash.PLSQL_ENTRY_SUBPROGRAM_ID = procs.SUBPROGRAM_ID
  • 43.
    #.43 Copyright 2006 KyleHailey 11.1g ASH extras 11.1g ASH extras SQL Elapsed SQL Elapsed SQL_EXEC_ID SQL_EXEC_START IN_CONNECTION_MGMT IN_PARSE IN_HARD_PARSE IN_SQL_EXECUTION IN_PLSQL_EXECUTION IN_PLSQL_RPC IN_PLSQL_COMPILATION IN_JAVA_EXECUTION IN_BIND IN_CURSOR_CLOSE SQL_PLAN_LINE_ID SQL_PLAN_OPERATION SQL_PLAN_OPTIONS CURRENT_ROW# EVENT# QC_SESSION_SERIAL# CONSUMER_GROUP_ID FLAGS ETC ETC Operation bit vector – non timed ops Operation bit vector – non timed ops SQL Row Source SQL Row Source REMOTE_INSTANCE# Which instance requested block? Which instance requested block? TOP_LEVEL_SQL_ID TOP_LEVEL_SQL_OPCODE Recursive SQL Recursive SQL
  • 44.
    #.44 Copyright 2006 KyleHailey 11.2g ASH extras 11.2g ASH extras Statistics Statistics TM_DELTA_TIME TM_DELTA_CPU_TIME TM_DELTA_DB_TIME DELTA_TIME DELTA_READ_IO_REQUESTS DELTA_WRITE_IO_REQUESTS DELTA_READ_IO_BYTES DELTA_WRITE_IO_BYTES DELTA_INTERCONNECT_IO_BYTES PGA_ALLOCATED TEMP_SPACE_ALLOCATE
  • 45.
    #.45 Copyright 2006 KyleHailey 10.1 10.1 10.2 10.2 10.2.0.3 10.2.0.3 11.1 11.1 11.2 11.2 When Who SQL Waits Blocker Statistics ASH Across Versions ASH Across Versions ASH instrumentation is exploding across the versions
  • 46.
    #.46 Copyright 2006 KyleHailey How Many Active Sessions? How Many Active Sessions?  How much data does ASH Collect ?  1 CPU means max 1 Avg Active Session unless there is a bottleneck Big site examples:  Oracle 4 way RAC internal apps  10,000 connected, 200 active  One Site  3000 connected, 30 Active  Site  12,000 connected, 100 active
  • 47.
    #.47 Copyright 2006 KyleHailey ASH Summary ASH Summary  Rich & Multidimensional  Overview of system load  Drilldowns into problems  Sql  Session  Wait event  Details information on problem resolution  Sampling is the future  Took clean vision to create - Bit of a leap of faith  Less Accurate but more powerful than past  Inaccuracies unimportant for the most part  Feasible since version 7  You can implement it yourself  OEM simplifies mining of ASH data
  • 48.
    #.48 Q1 Q1 Copyright 2006 KyleHailey How can you immediately find the top IO consuming SQ How can you immediately find the top IO consuming SQ statement in the last 60 seconds statement in the last 60 seconds a. v$active_session_history a. v$active_session_history b. v$sqlstats b. v$sqlstats c. v$sql c. v$sql d. v$sqlarea d. v$sqlarea answer answer a only a only others others b,c,d - only have cumulative values b,c,d - only have cumulative values since database startup since database startup
  • 49.
    #.49 Q2 Q2 Copyright 2006 KyleHailey Which view can you query directly to Which view can you query directly to get the specific waits that occurred get the specific waits that occurred 30 minutes ago: 30 minutes ago: a. v$active_session_history a. v$active_session_history b. v$waitclassmetric b. v$waitclassmetric c. v$system_event c. v$system_event d. v$session_wait_history d. v$session_wait_history e. v$waitclassmetric_history e. v$waitclassmetric_history a only a only b - last 60 seconds only b - last 60 seconds only c - cumulative info since db startup c - cumulative info since db startup d - last 10 waits only d - last 10 waits only e - only wait groups, not wait events, but has e - only wait groups, not wait events, but has the history for last hour the history for last hour
  • 50.
    #.50 Q3 Q3 Copyright 2006 KyleHailey ASH (v$active_session_history) is a revolutionary data ASH (v$active_session_history) is a revolutionary data source for monitoring and analyzing database source for monitoring and analyzing database performance. The view v$active_session_history is new performance. The view v$active_session_history is new in 10g, but most of the data needed in order to simulate in 10g, but most of the data needed in order to simulate v$active_session_history by hand has been available v$active_session_history by hand has been available since which version since which version a. 6 a. 6 b. 7 b. 7 c. 8 c. 8 d. 9 d. 9 e. 10 e. 10 b - since version 7 when wait events b - since version 7 when wait events were introduced along with the view were introduced along with the view v$session_wait v$session_wait which is the foundation for ASH which is the foundation for ASH

Editor's Notes

  • #4 Sampling is a leap in performance tuning technology. It took a clear vision of the future and a bit of a leap of faith to let go of the compulsive need to have exact measurements and instead embrace sampling a technology that statistically approximates the same value with little loss of accuracy but at the same time brings a much great wealth of information necessary for analyzing the performance of a database.
  • #7 pmon timer rdbms ipc message wait for unread message on broadcast channel wait for unread message on multiple broadcast channels ges remote message ges reconfiguration to start gcs remote message PX Deq: Par Recov Reply PX Deq: Par Recov Execute PX Deq: Par Recov Change Vector wait for activate message wakeup event for builder wakeup event for preparer wakeup event for reader wait for transaction parallel recovery coordinator waits for cleanup of slaves smon timer PX Deq: Txn Recovery Start PX Deq: Txn Recovery Reply statement suspended, wait error to be cleared PX Deq: Index Merge Reply PX Deq: Index Merge Execute PX Deq: Index Merge Close PX Deq: kdcph_mai PX Deq: kdcphc_ack virtual circuit status dispatcher timer jobq slave wait pipe get PX Deque wait PX Idle Wait PX Deq: Join ACK PX Deq Credit: need buffer PX Deq: Msg Fragment PX Deq: Parse Reply PX Deq: Execute Reply PX Deq: Execution Msg PX Deq: Table Q Normal PX Deq: Table Q Sample single-task message SQL*Net message from client SQL*Net message from dblink PL/SQL lock timer queue messages wakeup time manager AQ Proxy Cleanup Wait Queue Monitor Wait Queue Monitor Slave Wait Queue Monitor Shutdown Wait Queue Monitor IPC wait STREAMS apply coord waiting for slave message STREAMS fetch slave waiting for txns STREAMS apply slave idle wait STREAMS capture process filter callback wait for ruleset waiting for subscribers to catch up waiting for low memory condition to be resolved HS message to agent JS external job
  • #12 WAIT_TIME is time of last wait, > 0 , means on CPU TIME_WAITED is the actual wait time
  • #18  Select session_id, session_serial# , count(*) , round((count(*)*100)/(5*60),0) "%", lpad('*',round((count(*)*10)/(5*60),0),'*') "Bar" from v$active_session_history where session_state= 'ON CPU' and SAMPLE_TIME > sysdate - (5/(24*60)) group by session_id, session_serial# order by count(*) desc /
  • #19 Graphics – humans can process 400,000 times as much data graphically as textually Think of a map of the US and all the counties with birth rates colored from low to high. It’s a massive about of information textually but it can all be seen on one page of a map Select session_id, session_serial# , count(*) , round((count(*)*100)/(5*60),0) "%", lpad('*',round((count(*)*10)/(5*60),0),'*') "Bar" from v$active_session_history where session_state= 'ON CPU' and SAMPLE_TIME > sysdate - (5/(24*60)) group by session_id, session_serial# order by count(*) desc /
  • #32 Size of Ash --- Algorithm used to estimate ASH buffers size memory_quota = max(2% of sga_target, 5% of shared_pool_size); /* sga_target = 0 when AUTO SGA is OFF */ cpu_quota    = 2MB * (# of CPUs); ash_size     = min( cpu_quota, memory_quota ); ash_size     = max( 1MB, ash_size); /* atleast 1MB */ ash_size     = min( 128MB, ash_size); /* atmost 128MB */ ---
  • #39 ASH _ash_enable = false; [ A dynamic parameter will turn off ASH sampling, flushing and the V$ views on ASH ] ADDM _addm_auto_enable = false; [ A dynamic parameter to turn off automatic ADDM runs after every AWR snapshot ] AWR "_swrf_mmon_flush" = FALSE ; AWR metrics "_swrf_mmon_metrics" = FALSE ; METRICS DB Feature Usage "_swrf_mmon_dbfus" = FALSE ; DB Feature Usage "_swrf_on_disk_enabled" = FALSE ; disable all (on disk, including manual) AWR operations:
  • #42 set linesize 120 col entry_package for a25 col entry_procedure for a25 col cur_package for a25 col cur_procedure for a25 col calling_code for a70 select procs1.object_name || decode(procs1.procedure_name,'','','.')|| procs1.procedure_name ||' '|| decode(procs2.object_name,procs1.object_name,'',procs2.object_name) || decode(procs2.procedure_name,procs1.procedure_name,'', decode(procs2.procedure_name,'','',null,'','.')||procs2.procedure_name) "calling_code", sql_id, count(*) from v$active_session_history ash, all_procedures procs1, all_procedures procs2 where ash.PLSQL_ENTRY_OBJECT_ID = procs1.object_id (+) and ash.PLSQL_ENTRY_SUBPROGRAM_ID = procs1.SUBPROGRAM_ID (+) and ash.PLSQL_OBJECT_ID = procs2.object_id (+) and ash.PLSQL_SUBPROGRAM_ID = procs2.SUBPROGRAM_ID (+) and ash.sample_time > sysdate - &minutes/(60*24) group by procs1.object_name, procs1.procedure_name, procs2.object_name, procs2.procedure_name,sql_id order by count(*) /
  • #49  answer a only others b - last 60 seconds only c - cumulative info since db startup d - last 10 waits only e - only wait groups, not wait events, but has the history for last hour 8 ==================================================================== Chapt 1 ASH ASH (v$active_session_history) is a revolutionary data source for monitoring and analyzing database performance. The view v$active_session_history is new in 10g, but most of the data needed in order to simulate v$active_session_history by hand has been available since which version a. 6 b. 7 c. 8 d. 9 e. 10 answer b - since version 7 when wait events were introduced along with the view v$session_wait which is the foundation for ASH 4 ==================================================================== Chapt 1 ASH How can immediate find the top IO consuming SQL statement in the last 60 seconds a. v$active_session_history b. v$sqlstats c. v$sql d. v$sqlarea answer a only others b,c,d - only have cumulative values since database startup
  • #50 answer 4 ==================================================================== Chapt 1 ASH How can immediate find the top IO consuming SQL statement in the last 60 seconds a. v$active_session_history b. v$sqlstats c. v$sql d. v$sqlarea answer a only others b,c,d - only have cumulative values since database startup