
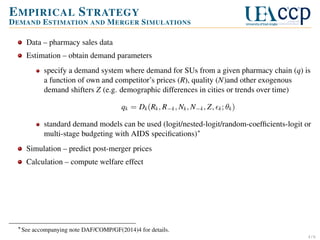
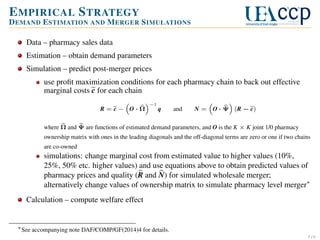
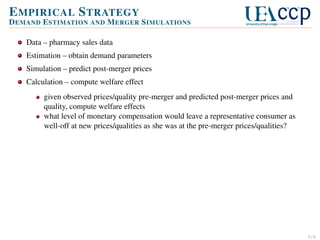
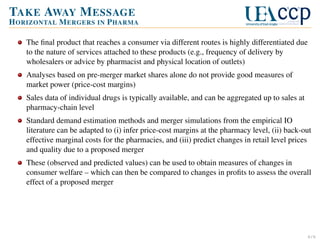
Download as PDF, PPTX

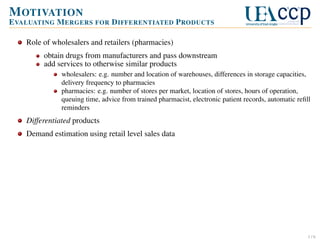
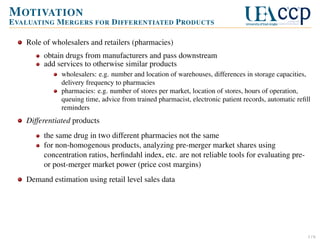
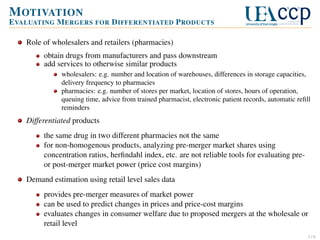
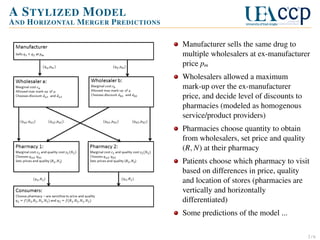
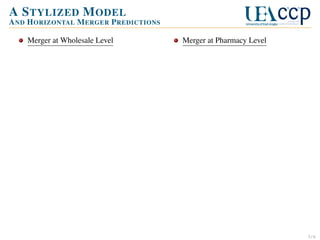
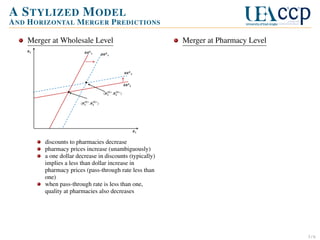
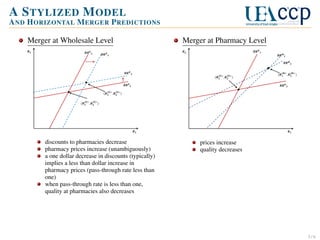
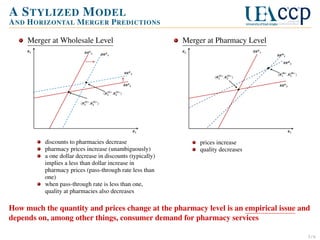

The document evaluates wholesale and retail mergers in the pharmaceutical sector, emphasizing the differentiated nature of products provided by pharmacies and wholesalers. It discusses the limitations of traditional market share analyses for assessing market power and introduces a stylized model to predict the impact of mergers on pricing and quality at pharmacies. The findings underscore the importance of demand estimation and simulation in understanding consumer welfare effects associated with proposed mergers.


![A review of marketing [www.writekraft.com]](https://cdn.slidesharecdn.com/ss_thumbnails/areviewofmarketing-180706103125-thumbnail.jpg?width=640&height=640&fit=bounds)

![A review of marketing [www.writekraft.com]](https://cdn.slidesharecdn.com/ss_thumbnails/areviewofmarketing-180612105244-thumbnail.jpg?width=640&height=640&fit=bounds)


