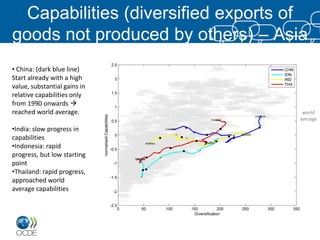
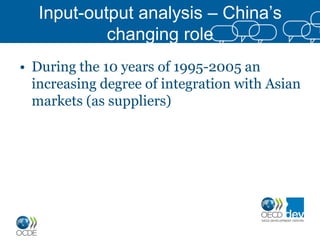
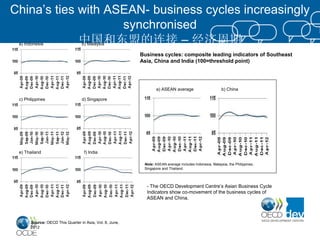
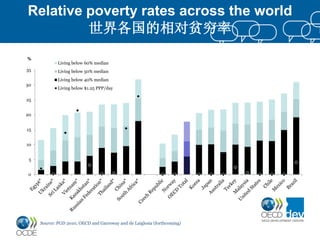
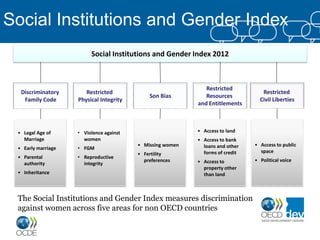
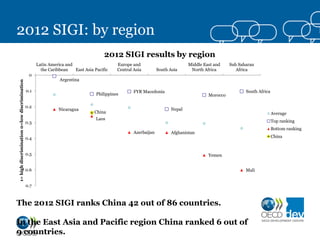
OECD Development Centre
         Recent Research
     经合组织发展中心的最近研究成果
Development Research Centre of the State Council
Beijing, June 26, 2013


  Mario Pezzini
  Director, OECD Development Centre
Recent research work at OECD Development
Centre 经合组织发展中心的最近学术研究成果
 Related to the 4 flagship publications of the Development Centre
Shifting wealth 全球财富转移

 The organising theme of a major flagship –
 The Perspectives on Global Development
 主要出版物之一“全球发展展望”的中心题目
 •.2011, 2012 now: 3rd edition
 •. Main message of PGD 2013: overcoming the middle income trap
 will imply the need for active innovation policy.
 •跨越中等收入陷阱的重点是采取刺激创新的一系列的政策
SW = China+

   The world’s economic centre of gravity,                    Mass, growth, duration => SW
             1980, 2008, 2050
         The world’s economic centre of gravity,              •   In 1980, the global economy‟s centre
1980–2007 (black) and extrapolated, at three-year intervals       of gravity was mid-Atlantic
                                                              •   In 2050: between India and China
                                                              •   Economic centre of gravity will shift
                                                                  from its 1980 location 9,300 km, East


                                                              •   China + India = 40% of global
                                                                  labour force
                                                              •   China has superior double-digit
                                                                  growth since > 30 years
                                                              •    „BRICs, Eagles, GGGs‟

 Source: D. Quah, Global Economic Policy, Vo.2.1., Jan 2011
SW = China+

                           China                                                                 India
                       % of world GDP                                                         % of world GDP

14%                                                                    14%

12%                                                                    12%

10%                                                                    10%

8%                                                                     8%

6%                                                                     6%

4%                                                                     4%

2%                                                                     2%

0%                                                                     0%
      1980   1985      1990       1995       2000        2005   2010         1980   1985      1990       1995       2000        2005   2010
               Market Exchange Rate      PPP Exchange Rate                            Market Exchange Rate      PPP Exchange Rate
China has successfully diversified its economy and
is moving ahead in the value chain

OECD DEV used the product space method to
compare “connectivity” (proximity of export
profile to high value-added products) and
“capabilities” (diversified exports not produced
by others)
采用产品空间方法测算世界各国的”连通性” 与“技能”
Connectivity (proximity of export profile to high value
  products) – Asia 连通性(更多产品趋于更高的附加值)

 •Larger countries, even
 THA, go further in
 connectivity.
 •CHN, IND are outliers, the
 highest levels of
 connectivity
 •KOR early gains in
 connectivity are stopped
 relatively early in the
 process. TWN less so.
 •Overall, this group has
 reached the area of
 diminishing returns.
Capabilities (diversified exports of
goods not produced by others) – Asia
• China: (dark blue line)
Start already with a high
value, substantial gains in
relative capabilities only
from 1990 onwards 
reached world average.               world
                                    average
•India: slow progress in
capabilities
•Indonesia: rapid
progress, but low starting
point
•Thailand: rapid progress,
approached world
average capabilities
Capabilities – Asia


• Structural transformation
occurs concomitantly with
increases in capabilities.                 world
                                          average
• Again, note the high
starting point of Korea and
Singapore and the
substantial above average
capability measure in 2008.
Capabilities – Latin America
• In general below-
average
performance in
Latin America.
• The exception                                 world
being Mexico (high                             average

starting value) and
slow increase
across time) and
the strongly
diversifying Brazil
(gradual increase in
capability ranking
over time).
Capabilities – Central America

• Substantially below
average performance
has improved in
recent years.                                  world
                                              average


•The case of CRI:
despite a high
degree of export
orientation,
capabilities are not
particularly high
Input-output analysis – China’s
            changing role
• During the 10 years of 1995-2005 an
  increasing degree of integration with Asian
  markets (as suppliers)
The rise of China in global supply chains as a dominant supplier
               中国作为全球供应链的关键供给方
                         投入产出表分析
 亚洲各国中间商品和服务的主要目的地 Major trade partners for Asia’s intermediate exports in goods and services


      -If a country’s intermediate exports (in both goods and services) to a
      particular partner country exceed a given threshold percentage of that   Source:        OECD      Input-Output
      country’s total intermediate exports (15% or 20% in our exercise), we    Database, March 2010; IDE-JETRO
                                                                               Asian     International  Input-Output
                                                                               Database 2006; OECD Bilateral Trade
      consider such a trade node as a dominant link.                           Database, March 2010; OECD Trade
                                                                               in Services, January 2010.
China’s ties with ASEAN- business cycles increasingly
                    synchronised
 a) Indonesia中国和东盟的连接 – 经济周期      b) Malaysia

                                                          Business cycles: composite leading indicators of Southeast
                                                          Asia, China and India (100=threshold point)


                                                                  a) ASEAN average                       b) China

 c) Philippines                   d) Singapore


 e) Thailand                        f) India

                                                           Note: ASEAN average includes Indonesia, Malaysia, the Philippines,
                                                           Singapore and Thailand.


                                                            - The OECD Development Centre’s Asian Business Cycle
                                                            Indicators show co-movement of the business cycles of
                                                            ASEAN and China.


       Source: OECD This Quarter in Asia, Vol. 8, June,
       2012
Impact of global uncertainty on China based on historical
             decomposition of the output gap
            中国潜在和实际产出量的差的分解
              Historical decomposition of output gap in Asia in 2009-11 (%)
                                             b) China
           a) Indonesia
                                                                              -The impact of global
                                                                              uncertainty (represented
                                                                              as a demand shock) has
                                                                              been limited in China.
                                                                              - The result suggests
                                                                              that in China there is
                                                                              room       to     improve
                                                                              potential     output    by
                                                                              enhancing productivity
                                                                              through        appropriate
                                             d)
           c) Philippines
                                             India                            structural policies, as, in
                                                                              2011, technology shocks
                                                                              had a negative impact
                                                                              on output gap.
                                                                              - Furthermore, the effect
                                                                              of    monetary      policy
                                                                              shocks        prove that
                                                                              monetary policies have
                                                                              been     relatively   well
                                                                              managed so far.
Source: OECD Development Centre, MPF-SAEO
2011/12.
Relative poverty in
developing countries发展中国家的相对贫穷率

• Calculate relative poverty lines for emerging
  economies (set at 40, 50 and 60% of median
  income or consumption)
   • How? Based on parametric estimations of
     Lorenz curves for country/year observations
     罗伦斯曲线
   • Why? Because relative poverty lines are closer
     to national lines, yet correspond to the same
     concept  improvement vis-à-vis dollar-a-day
     for international comparisons
Relative poverty rates across the world
         世界各国的相对贫穷率
%
             Living below 60% median
35           Living below 50% median
             Living below 40% median
30
             Living below $1.25 PPP/day

25


20


15


10


 5


0


     Source: PGD 2010, OECD and Garroway and de Laiglesia (forthcoming)
Relative poverty flat or increasing
despite large falls in absolute poverty
                          Brazil                                                        China

      $1.25/day          Relative poverty (50% of the median)
                                                                            $1.25/day             50% of the median

30%                                                              90%
                                                                 80%
25%                                                              70%
20%                                                              60%
                                                                 50%
15%
                                                                 40%
10%                                                              30%
                                                                 20%
5%
                                                                 10%
0%                                                               0%
  1975   1980     1985   1990     1995    2000    2005    2010     1975   1980   1985   1990   1995   2000    2005    2010
Social Institutions and Gender Index
                         Social Institutions and Gender Index 2012


                                                              Restricted
  Discriminatory       Restricted                                                 Restricted
                                             Son Bias         Resources
   Family Code      Physical Integrity                                           Civil Liberties
                                                           and Entitlements


 • Legal Age of     • Violence against                     • Access to land
   Marriage           women                                • Access to bank
                                         • Missing women     loans and other   • Access to public
 • Early marriage   • FGM
                                                             forms of credit     space
                                         • Fertility
 • Parental         • Reproductive
                                           preferences     • Access to         • Political voice
   authority          integrity
                                                             property other
 • Inheritance                                               than land


 The Social Institutions and Gender Index measures discrimination
 against women across five areas for non OECD countries
2012 SIGI: by region
                                                                                     2012 SIGI results by region
                                                    Latin America and                      Europe and                          Middle East and    Sub Saharan
                                                      the Caribbean   East Asia Pacific    Central Asia         South Asia      North Africa         Africa
                                               0
                                                               Argentina
1= high discrimination 0=low discrimination


                                              0.1                                                  FYR Macedonia                                         South Africa
                                                                                 Philippines                                            Morocco

                                              0.2
                                                              Nicaragua                                                Nepal
                                                                                China                                                                                   Average
                                                                                 Laos
                                              0.3                                                                                                                       Top ranking
                                                                                                                                                                        Bottom ranking
                                                                                                   Azerbaijan          Afghanistan
                                              0.4                                                                                                                       China


                                              0.5                                                                                       Yemen


                                              0.6                                                                                                        Mali


                                              0.7


The 2012 SIGI ranks China 42 out of 86 countries.

In the East Asia and Pacific region China ranked 6 out of
9 countries.
Gender inequality in China

• China shows the strongest performance in
  Restricted Physical Integrity sub-index
  (ranked 5 out of 99)
  – Strong legal framework to combat violence against women and good access
    to contraception for women.
  – Only 2% of women have an unmet need for family planning.

• China shows the weakest performance in
  the Son Bias (ranked 88 out of 95).
  – Strong social norms of son preference exacerbated by one-child policy.
  – Severe imbalance in sex-ratios - census data show that more than 40
    million Chinese women were „missing‟ in 2000.
  – Data on the share of the last child who are male indicate strong fertility
    preference for boys.
Possible collaboration with DRC

• In the context of the Perspectives on
  Global Development on issues related to
  competitiveness
   –Competitiveness of services industries
   –Definition of urban areas following
    the OECD methodology and use for
    regional competitiveness analyses
谢谢大家!
Thank you!

OECD Development Centre recent research

  • 1.
    OECD Development Centre Recent Research 经合组织发展中心的最近研究成果 Development Research Centre of the State Council Beijing, June 26, 2013 Mario Pezzini Director, OECD Development Centre
  • 2.
    Recent research workat OECD Development Centre 经合组织发展中心的最近学术研究成果 Related to the 4 flagship publications of the Development Centre
  • 3.
    Shifting wealth 全球财富转移 The organising theme of a major flagship – The Perspectives on Global Development 主要出版物之一“全球发展展望”的中心题目 •.2011, 2012 now: 3rd edition •. Main message of PGD 2013: overcoming the middle income trap will imply the need for active innovation policy. •跨越中等收入陷阱的重点是采取刺激创新的一系列的政策
  • 4.
    SW = China+ The world’s economic centre of gravity, Mass, growth, duration => SW 1980, 2008, 2050 The world’s economic centre of gravity, • In 1980, the global economy‟s centre 1980–2007 (black) and extrapolated, at three-year intervals of gravity was mid-Atlantic • In 2050: between India and China • Economic centre of gravity will shift from its 1980 location 9,300 km, East • China + India = 40% of global labour force • China has superior double-digit growth since > 30 years • „BRICs, Eagles, GGGs‟ Source: D. Quah, Global Economic Policy, Vo.2.1., Jan 2011
  • 5.
    SW = China+ China India % of world GDP % of world GDP 14% 14% 12% 12% 10% 10% 8% 8% 6% 6% 4% 4% 2% 2% 0% 0% 1980 1985 1990 1995 2000 2005 2010 1980 1985 1990 1995 2000 2005 2010 Market Exchange Rate PPP Exchange Rate Market Exchange Rate PPP Exchange Rate
  • 6.
    China has successfullydiversified its economy and is moving ahead in the value chain OECD DEV used the product space method to compare “connectivity” (proximity of export profile to high value-added products) and “capabilities” (diversified exports not produced by others) 采用产品空间方法测算世界各国的”连通性” 与“技能”
  • 7.
    Connectivity (proximity ofexport profile to high value products) – Asia 连通性(更多产品趋于更高的附加值) •Larger countries, even THA, go further in connectivity. •CHN, IND are outliers, the highest levels of connectivity •KOR early gains in connectivity are stopped relatively early in the process. TWN less so. •Overall, this group has reached the area of diminishing returns.
  • 8.
    Capabilities (diversified exportsof goods not produced by others) – Asia • China: (dark blue line) Start already with a high value, substantial gains in relative capabilities only from 1990 onwards  reached world average. world average •India: slow progress in capabilities •Indonesia: rapid progress, but low starting point •Thailand: rapid progress, approached world average capabilities
  • 9.
    Capabilities – Asia •Structural transformation occurs concomitantly with increases in capabilities. world average • Again, note the high starting point of Korea and Singapore and the substantial above average capability measure in 2008.
  • 10.
    Capabilities – LatinAmerica • In general below- average performance in Latin America. • The exception world being Mexico (high average starting value) and slow increase across time) and the strongly diversifying Brazil (gradual increase in capability ranking over time).
  • 11.
    Capabilities – CentralAmerica • Substantially below average performance has improved in recent years. world average •The case of CRI: despite a high degree of export orientation, capabilities are not particularly high
  • 12.
    Input-output analysis –China’s changing role • During the 10 years of 1995-2005 an increasing degree of integration with Asian markets (as suppliers)
  • 13.
    The rise ofChina in global supply chains as a dominant supplier 中国作为全球供应链的关键供给方 投入产出表分析 亚洲各国中间商品和服务的主要目的地 Major trade partners for Asia’s intermediate exports in goods and services -If a country’s intermediate exports (in both goods and services) to a particular partner country exceed a given threshold percentage of that Source: OECD Input-Output country’s total intermediate exports (15% or 20% in our exercise), we Database, March 2010; IDE-JETRO Asian International Input-Output Database 2006; OECD Bilateral Trade consider such a trade node as a dominant link. Database, March 2010; OECD Trade in Services, January 2010.
  • 14.
    China’s ties withASEAN- business cycles increasingly synchronised a) Indonesia中国和东盟的连接 – 经济周期 b) Malaysia Business cycles: composite leading indicators of Southeast Asia, China and India (100=threshold point) a) ASEAN average b) China c) Philippines d) Singapore e) Thailand f) India Note: ASEAN average includes Indonesia, Malaysia, the Philippines, Singapore and Thailand. - The OECD Development Centre’s Asian Business Cycle Indicators show co-movement of the business cycles of ASEAN and China. Source: OECD This Quarter in Asia, Vol. 8, June, 2012
  • 15.
    Impact of globaluncertainty on China based on historical decomposition of the output gap 中国潜在和实际产出量的差的分解 Historical decomposition of output gap in Asia in 2009-11 (%) b) China a) Indonesia -The impact of global uncertainty (represented as a demand shock) has been limited in China. - The result suggests that in China there is room to improve potential output by enhancing productivity through appropriate d) c) Philippines India structural policies, as, in 2011, technology shocks had a negative impact on output gap. - Furthermore, the effect of monetary policy shocks prove that monetary policies have been relatively well managed so far. Source: OECD Development Centre, MPF-SAEO 2011/12.
  • 16.
    Relative poverty in developingcountries发展中国家的相对贫穷率 • Calculate relative poverty lines for emerging economies (set at 40, 50 and 60% of median income or consumption) • How? Based on parametric estimations of Lorenz curves for country/year observations 罗伦斯曲线 • Why? Because relative poverty lines are closer to national lines, yet correspond to the same concept  improvement vis-à-vis dollar-a-day for international comparisons
  • 17.
    Relative poverty ratesacross the world 世界各国的相对贫穷率 % Living below 60% median 35 Living below 50% median Living below 40% median 30 Living below $1.25 PPP/day 25 20 15 10 5 0 Source: PGD 2010, OECD and Garroway and de Laiglesia (forthcoming)
  • 18.
    Relative poverty flator increasing despite large falls in absolute poverty Brazil China $1.25/day Relative poverty (50% of the median) $1.25/day 50% of the median 30% 90% 80% 25% 70% 20% 60% 50% 15% 40% 10% 30% 20% 5% 10% 0% 0% 1975 1980 1985 1990 1995 2000 2005 2010 1975 1980 1985 1990 1995 2000 2005 2010
  • 19.
    Social Institutions andGender Index Social Institutions and Gender Index 2012 Restricted Discriminatory Restricted Restricted Son Bias Resources Family Code Physical Integrity Civil Liberties and Entitlements • Legal Age of • Violence against • Access to land Marriage women • Access to bank • Missing women loans and other • Access to public • Early marriage • FGM forms of credit space • Fertility • Parental • Reproductive preferences • Access to • Political voice authority integrity property other • Inheritance than land The Social Institutions and Gender Index measures discrimination against women across five areas for non OECD countries
  • 20.
    2012 SIGI: byregion 2012 SIGI results by region Latin America and Europe and Middle East and Sub Saharan the Caribbean East Asia Pacific Central Asia South Asia North Africa Africa 0 Argentina 1= high discrimination 0=low discrimination 0.1 FYR Macedonia South Africa Philippines Morocco 0.2 Nicaragua Nepal China Average Laos 0.3 Top ranking Bottom ranking Azerbaijan Afghanistan 0.4 China 0.5 Yemen 0.6 Mali 0.7 The 2012 SIGI ranks China 42 out of 86 countries. In the East Asia and Pacific region China ranked 6 out of 9 countries.
  • 21.
    Gender inequality inChina • China shows the strongest performance in Restricted Physical Integrity sub-index (ranked 5 out of 99) – Strong legal framework to combat violence against women and good access to contraception for women. – Only 2% of women have an unmet need for family planning. • China shows the weakest performance in the Son Bias (ranked 88 out of 95). – Strong social norms of son preference exacerbated by one-child policy. – Severe imbalance in sex-ratios - census data show that more than 40 million Chinese women were „missing‟ in 2000. – Data on the share of the last child who are male indicate strong fertility preference for boys.
  • 22.
    Possible collaboration withDRC • In the context of the Perspectives on Global Development on issues related to competitiveness –Competitiveness of services industries –Definition of urban areas following the OECD methodology and use for regional competitiveness analyses
  • 23.