Occupational segregation
•Download as PPTX, PDF•
1 like•798 views

Data on trends in occupational segregation by gender from Skills and Employment Survey series

Recommended
More Related Content
What's hot
What's hot (20)
Similar to Occupational segregation
Similar to Occupational segregation (12)
More from Mark Beatson
More from Mark Beatson (20)
Recently uploaded
Recently uploaded (20)
Occupational segregation
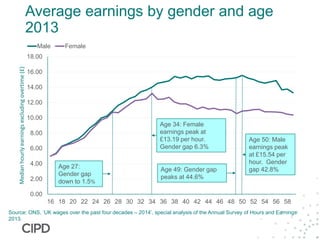
- 1. Average earnings by gender and age 2013 0.00 2.00 4.00 6.00 8.00 10.00 12.00 14.00 16.00 18.00 16 18 20 22 24 26 28 30 32 34 36 38 40 42 44 46 48 50 52 54 56 58 Medianhourlyearningsexcludingovertime(£) Male Female Source: ONS, ‘UK wages over the past four decades – 2014’, special analysis of the Annual Survey of Hours and Earnings 2013. Age 27: Gender gap down to 1.5% Age 34: Female earnings peak at £13.19 per hour. Gender gap 6.3% Age 49: Gender gap peaks at 44.6% Age 50: Male earnings peak at £15.54 per hour. Gender gap 42.8%
- 2. Gender segregation 1986-2012 46% 32% 36% 26% 23% 39% 37% 33% 33% 33% 5% 7% 7% 8% 9% 15% 25% 25% 33% 37% 26% 31% 28% 34% 39% 1% 5% 6% 7% 7% 46% 44% 39% 41% 37% 22% 17% 23% 15% 14% 1986 1997 2001 2006 2012 1986 1997 2001 2006 2012 Almost exclusively men Mainly men Equal mix Mainly women Almost exclusively women Base: all employees. Source: Skills and Employment Surveys. Men Women
- 3. Gender segregation by managerial responsibility 2012 21% 25% 33% 33% 11% 6% 37% 35% 36% 41% 9% 7% 40% 36% 12% 16% Managers/supervisors Non-managerial employees Managers/supervisors Non-managerial employees Almost exclusively men Mainly men Equal mix Mainly women Almost exclusively women Base: all employees. Source: Skills and Employment Surveys. Men Women