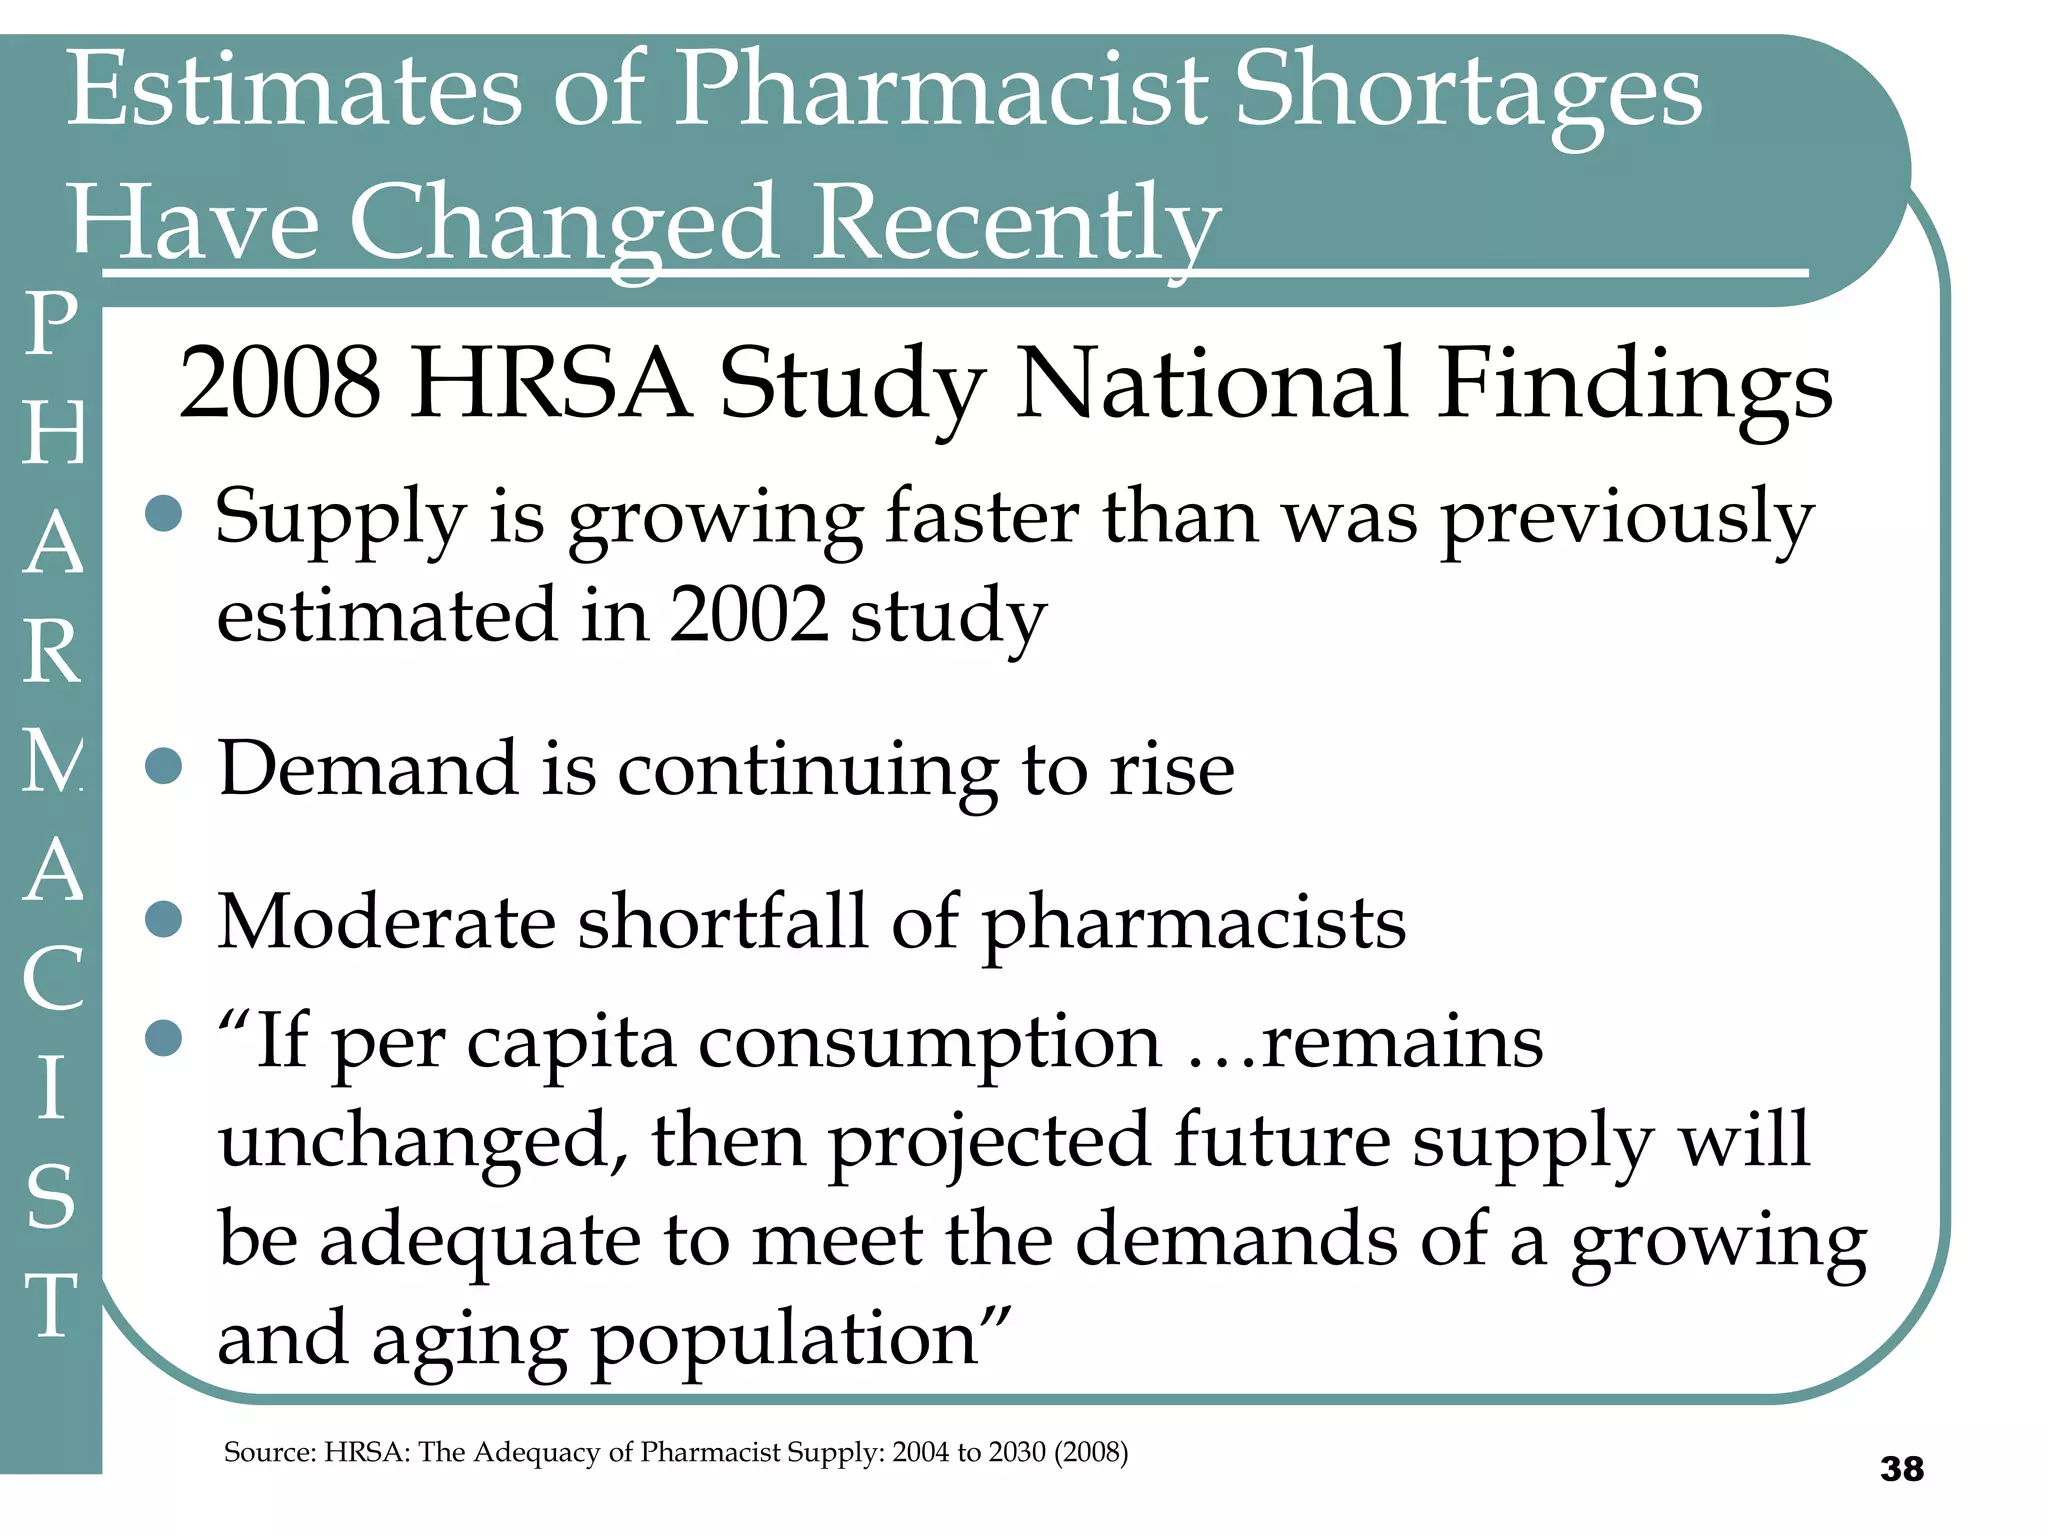
![2,425 Students Were Enrolled in Virginia Medical Schools in 2008 Sources: JCHC email correspondence with each institution and SCHEV. Va. Medical School Takes Shape, Smith and Hardy, Richmond Times Dispatch, January 3, 2007 & WSLS video report, McNew, May 22, 2008 http://www.wsls.com/sls/news/local/article/roanoke_medical_school_has_a_name/11444/ PHYSICIAN 678 191 192 160 135 557 50% 643 2,425 Total (2008) 40 (Expected) 200 (Expected) Virginia Tech Carilion School of Medicine (Roanoke) [Opens August 2010] 139 30% 191 680 Edward Via Virginia College of Osteopathic Medicine -VCOM (Blacksburg) 181 58% 192 741 Virginia Commonwealth University School of Medicine (Richmond) 130 54% 145 559 University of Virginia School of Medicine (Charlottesville) 107 64% 115 445 Eastern Virginia Medical School (Norfolk) Total Enrollment (2008) 2008 Graduates % in-state 2008 entering class 2008 entering class-size 2012 entering class-size (Estimated )](https://image.slidesharecdn.com/nutter-100324081954-phpapp02/75/Nutter-23-2048.jpg)
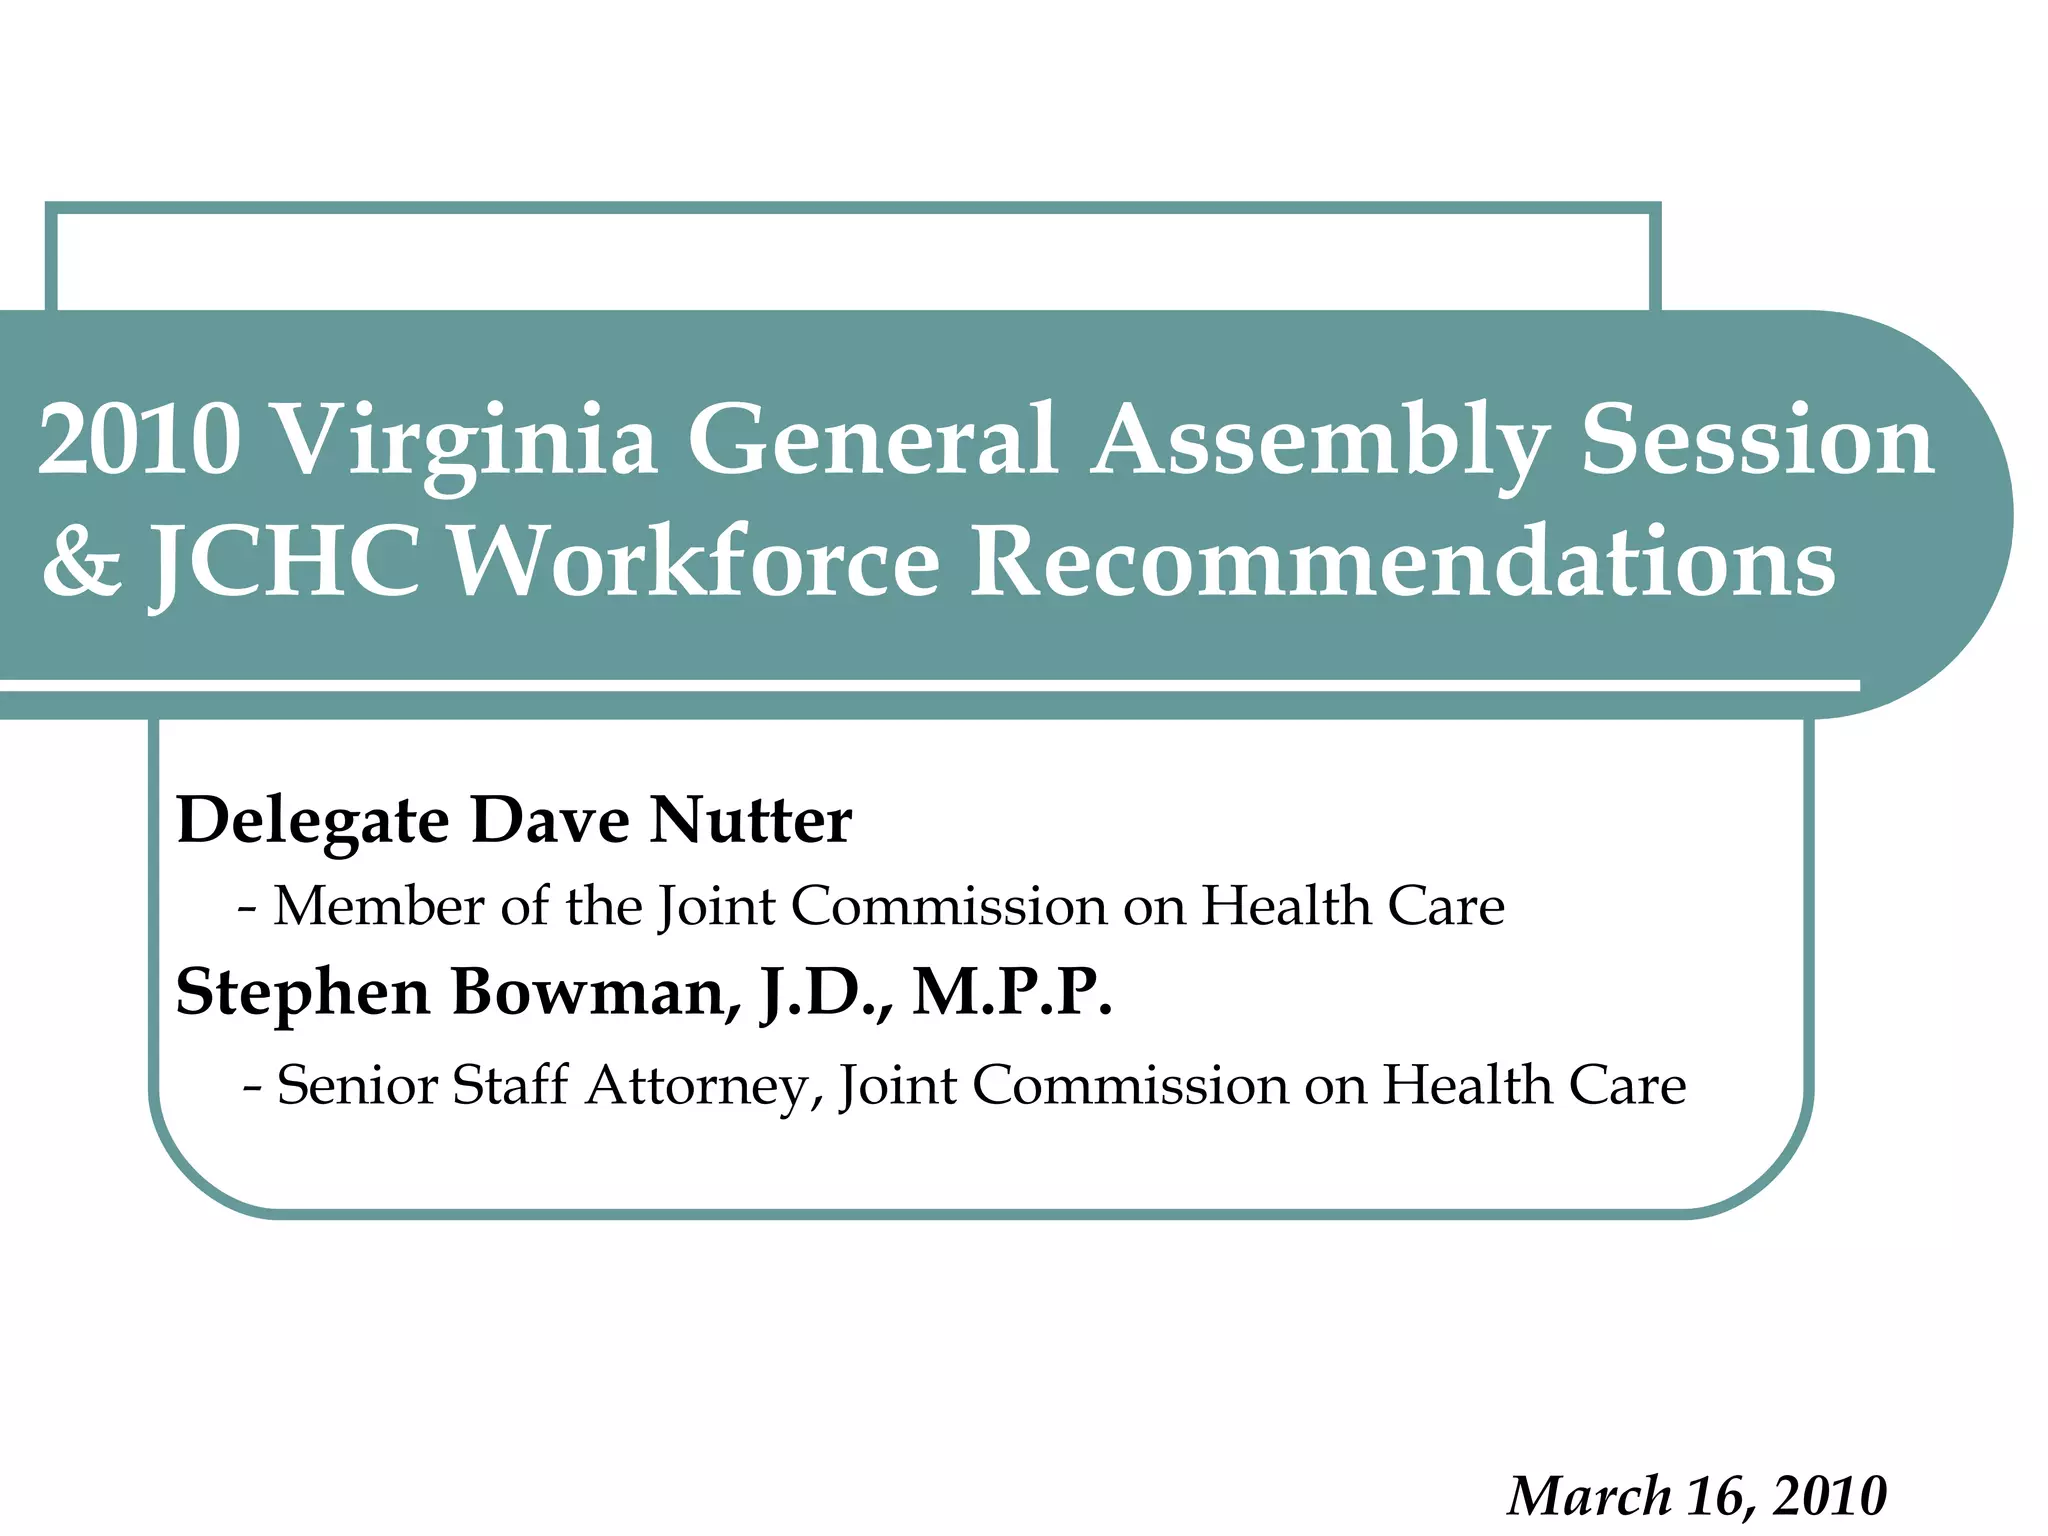
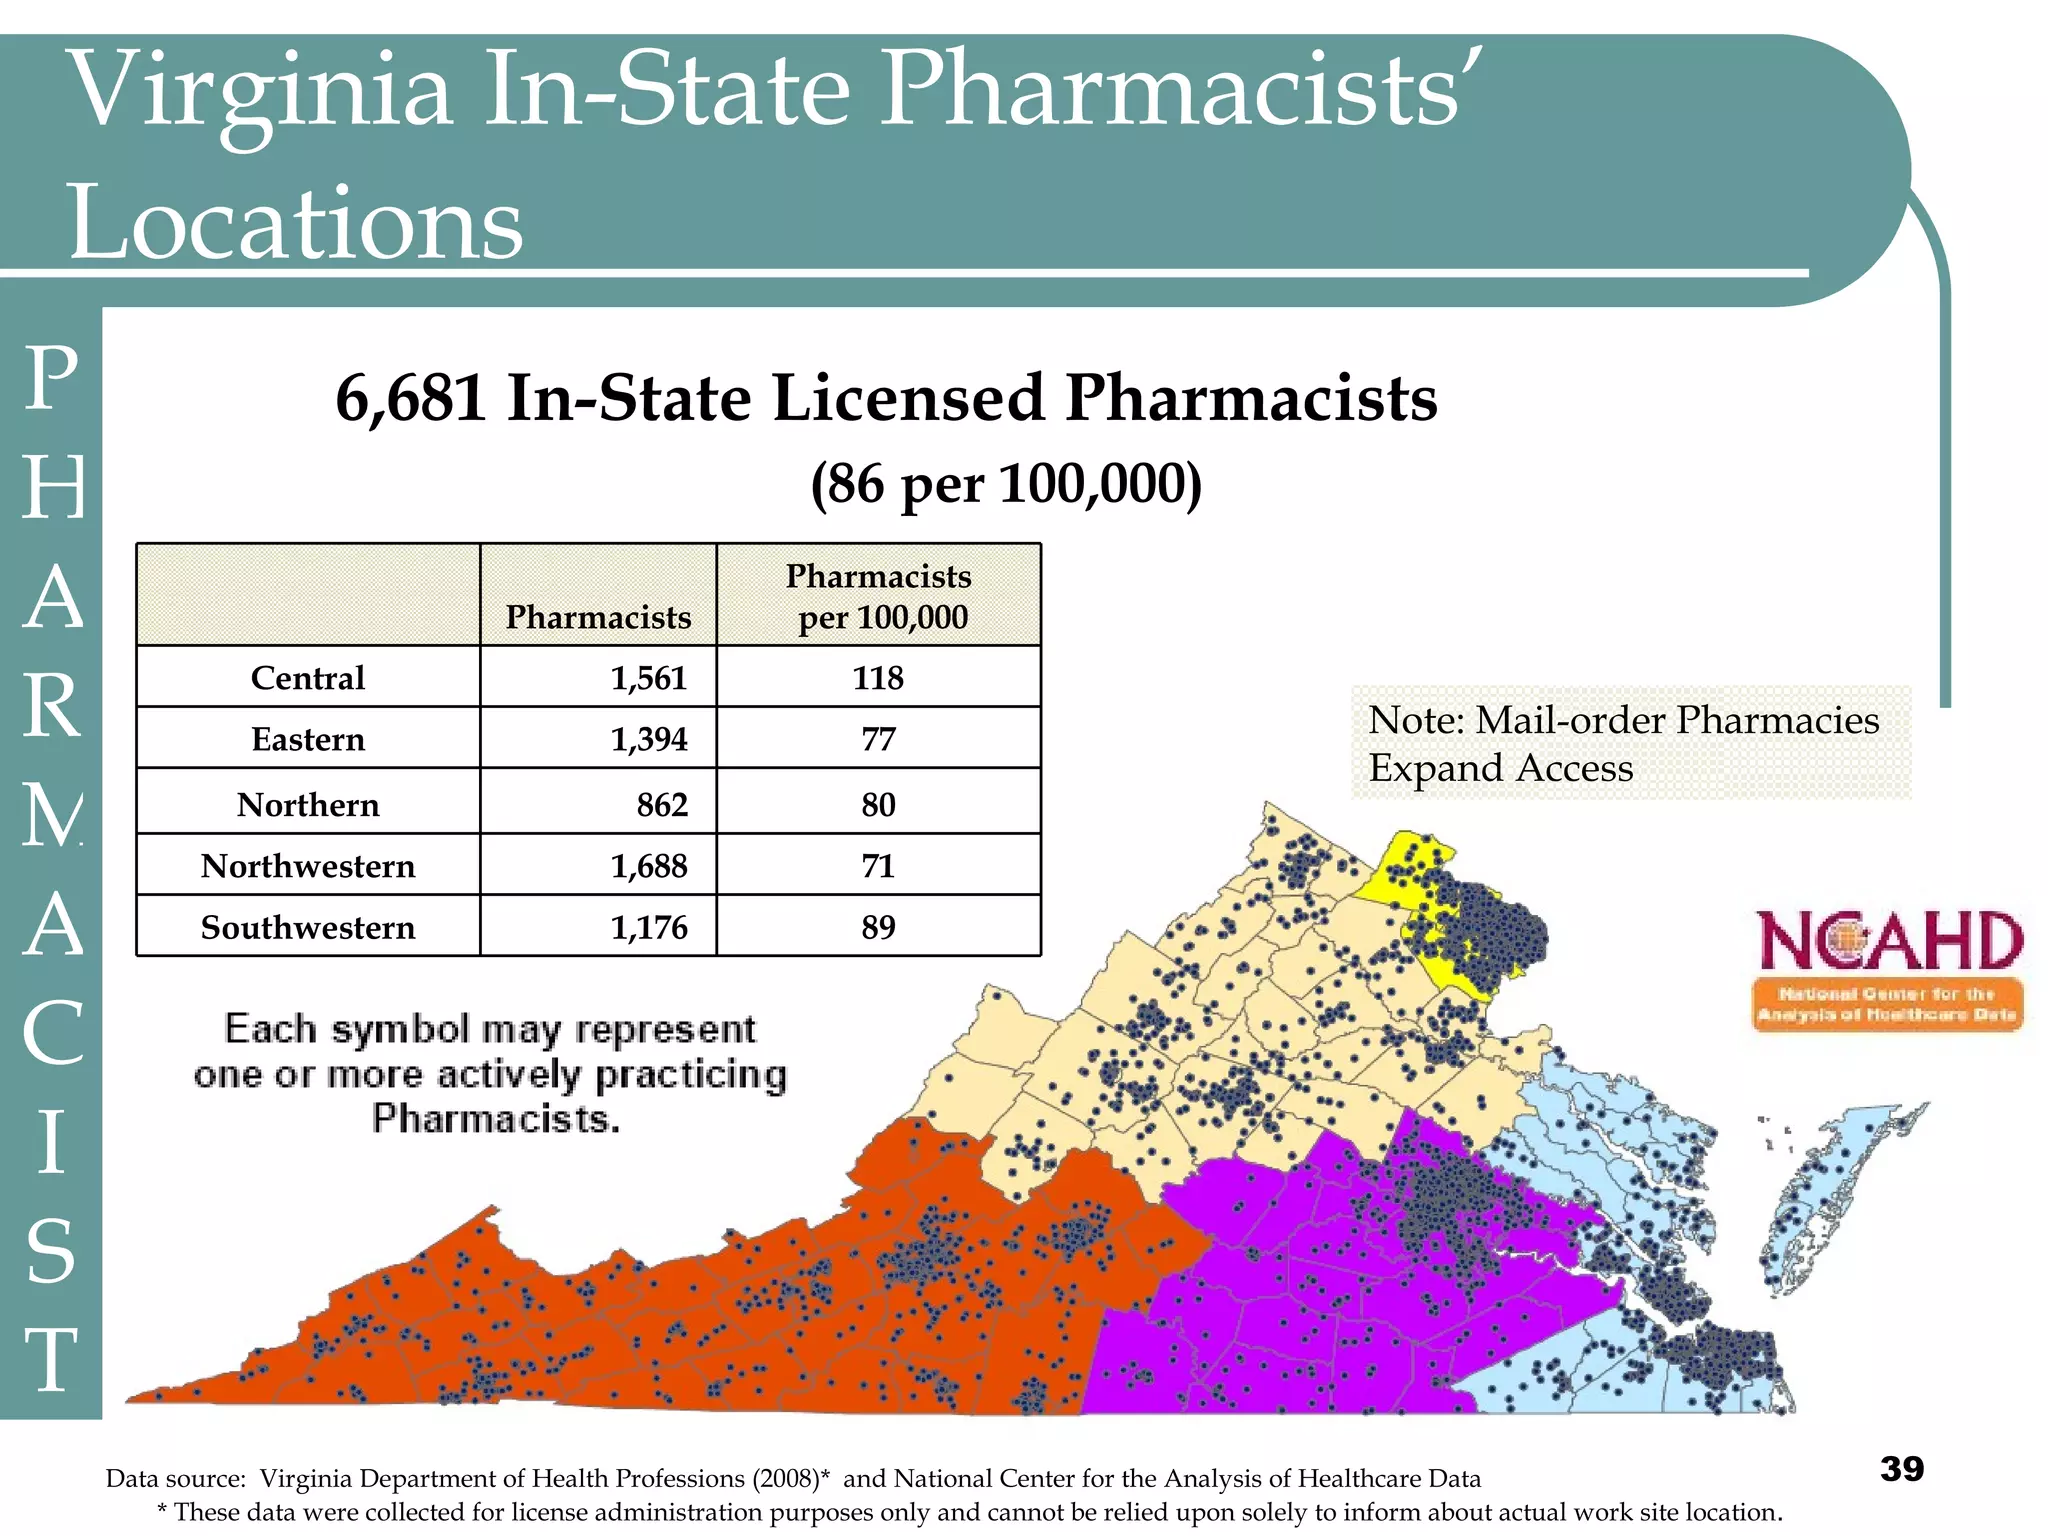
![$50.6 Million General Funds Were Spent Toward Medical School Education in 2007-08 Tuition in-state (2008-2009 ) 2007-08 General funds/per student* 2007-08 General funds* (in millions ) Tuition out-of-state (2008-2009 ) 2007-08 Non-General funds* (in millions ) * Totals do not include Family Practice Program (residencies) and Area Health Center funding Sources: JCHC email correspondence with each institution and SCHEV. Va. Medical School Takes Shape, Smith and Hardy, Richmond Times Dispatch, January 3, 2007 & WSLS video report, McNew, May 22, 2008 http://www.wsls.com/sls/news/local/article/roanoke_medical_school_has_a_name/11444/ PHYSICIAN $ 52.8 $ 0 $ 20.8 $ 31.8 $ 0 $ 50.6 $ 39,740 (average) $ 28,794 (average) Total (2008) Virginia Tech Carilion School of Medicine (Roanoke) [Opens August 2010] $ 0 $ 0 $ 32,900 $ 32,900 Edward Via Virginia College of Osteopathic Medicine -VCOM (Blacksburg) $ 22,833 $ 16.9 $ 38,892 $ 25,390 Virginia Commonwealth University School of Medicine (Richmond) $ 29,733 $ 16.6 $ 42,650 $ 32,650 University of Virginia School of Medicine (Charlottesville) $ 33,786 $ 15.1 $ 44,328 $ 23,980 Eastern Virginia Medical School (Norfolk)](https://image.slidesharecdn.com/nutter-100324081954-phpapp02/75/Nutter-24-2048.jpg)
![Contact Information The full presentation given to JCHC September 1, 2009 that includes additional data and analyses can be found at the JCHC website http://jchc.state.va.us/ Stephen Bowman E-mail: [email_address] Phone: 804-786-5445 Mail: Joint Commission on Health Care P.O. Box 1322 Richmond, Virginia 23218](https://image.slidesharecdn.com/nutter-100324081954-phpapp02/75/Nutter-49-2048.jpg)

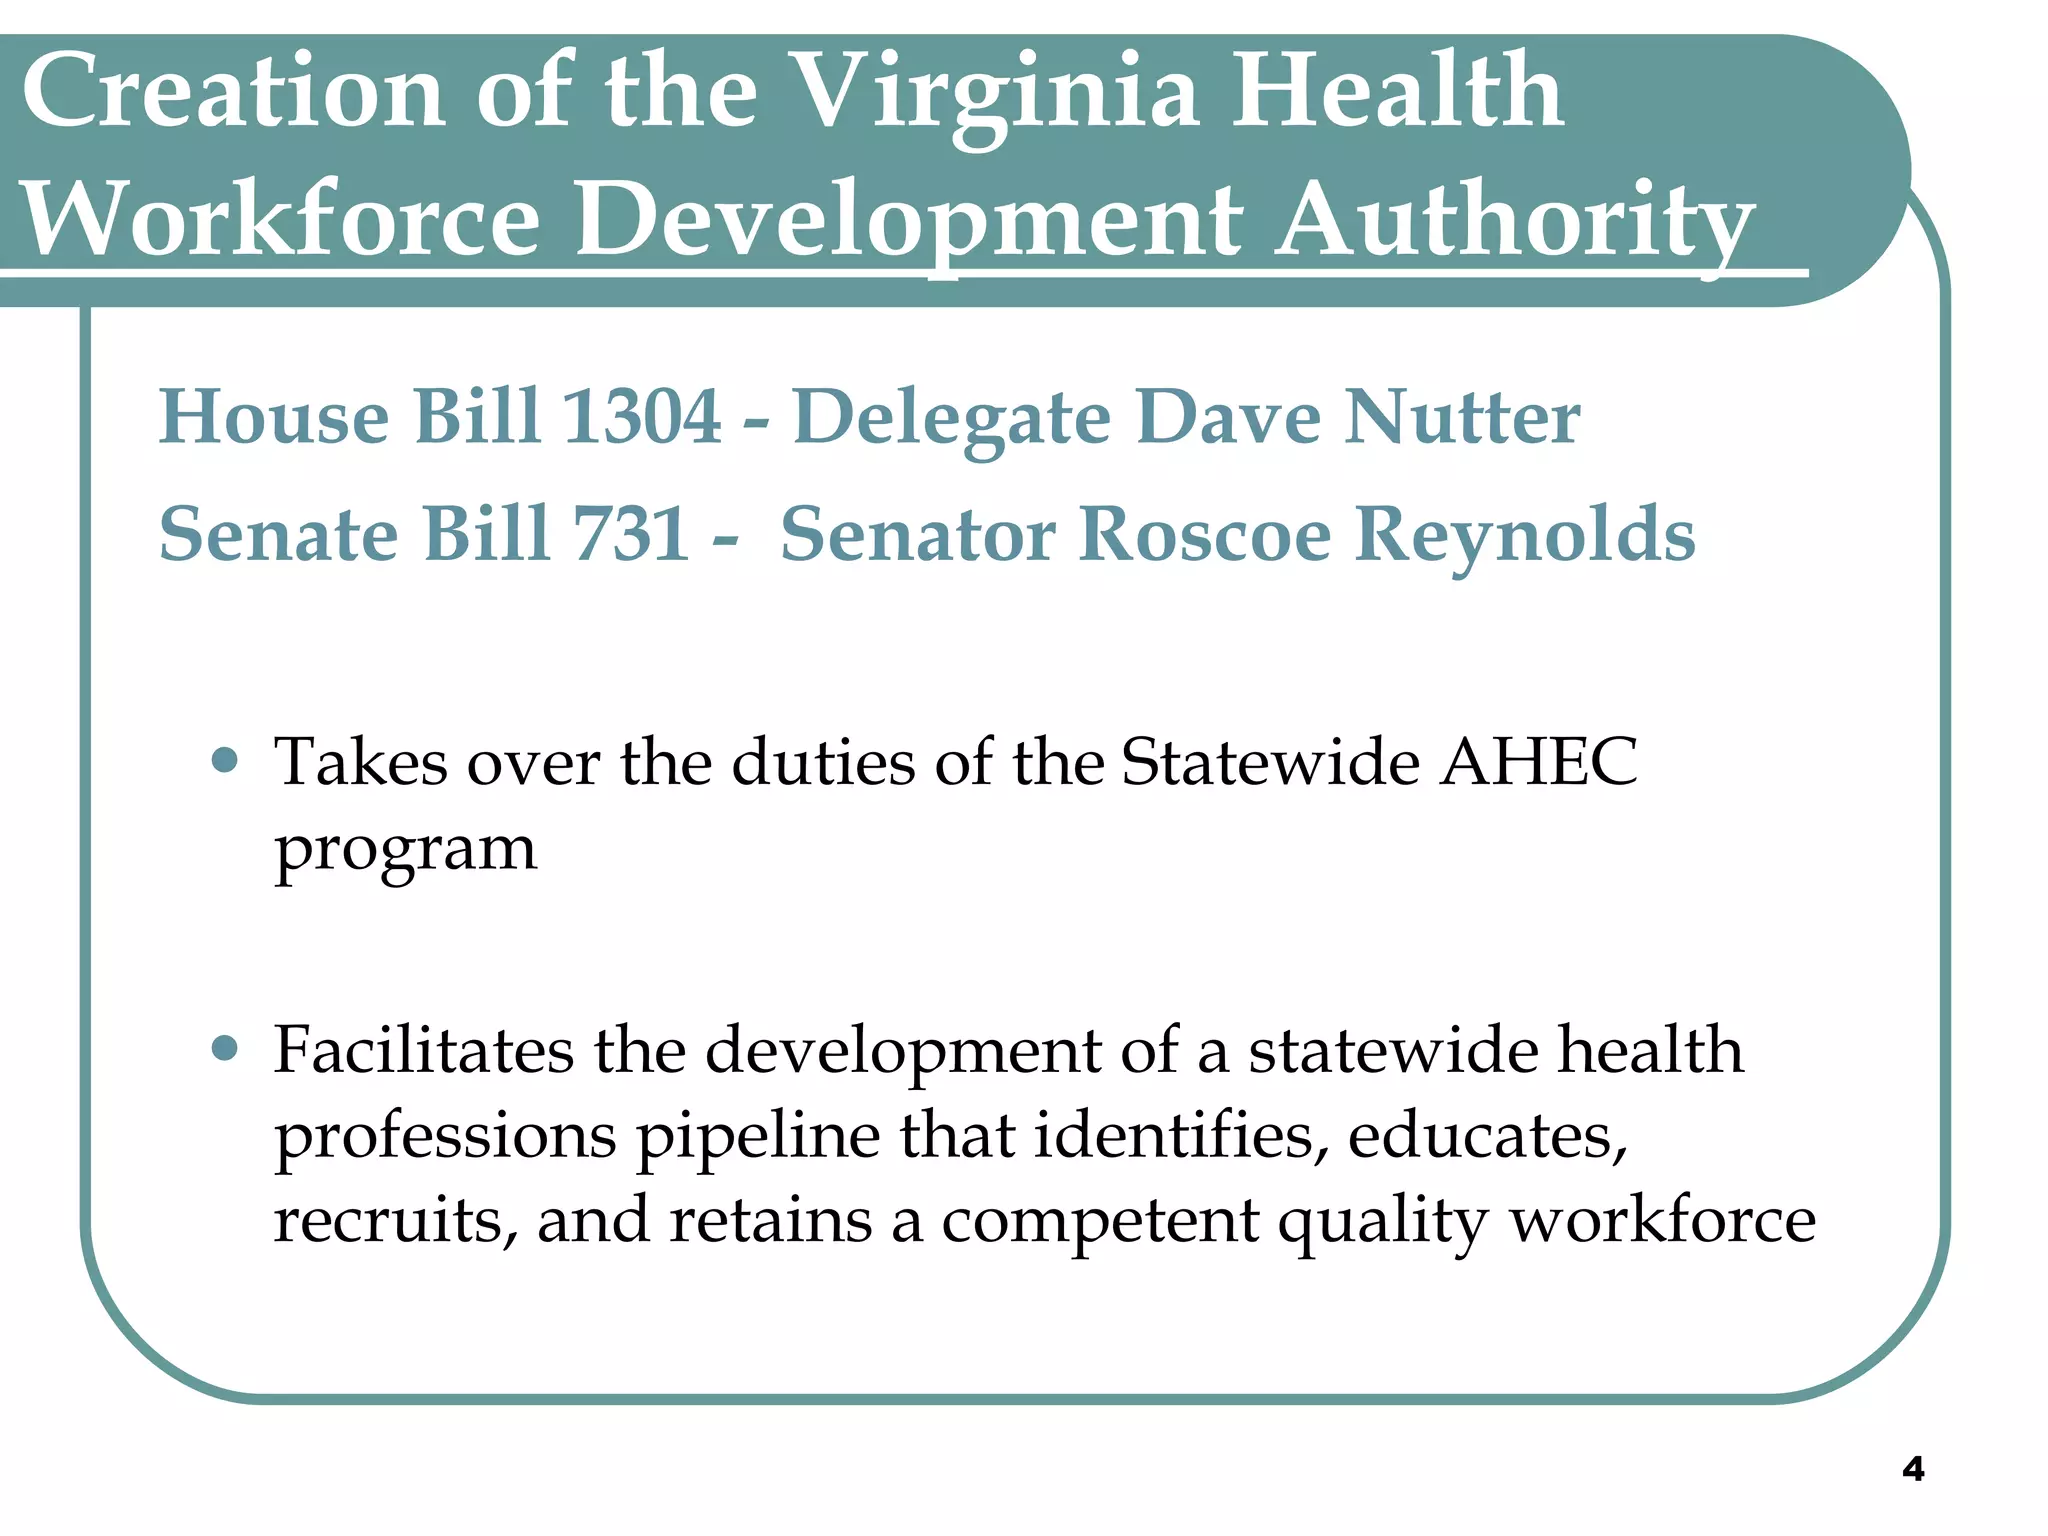
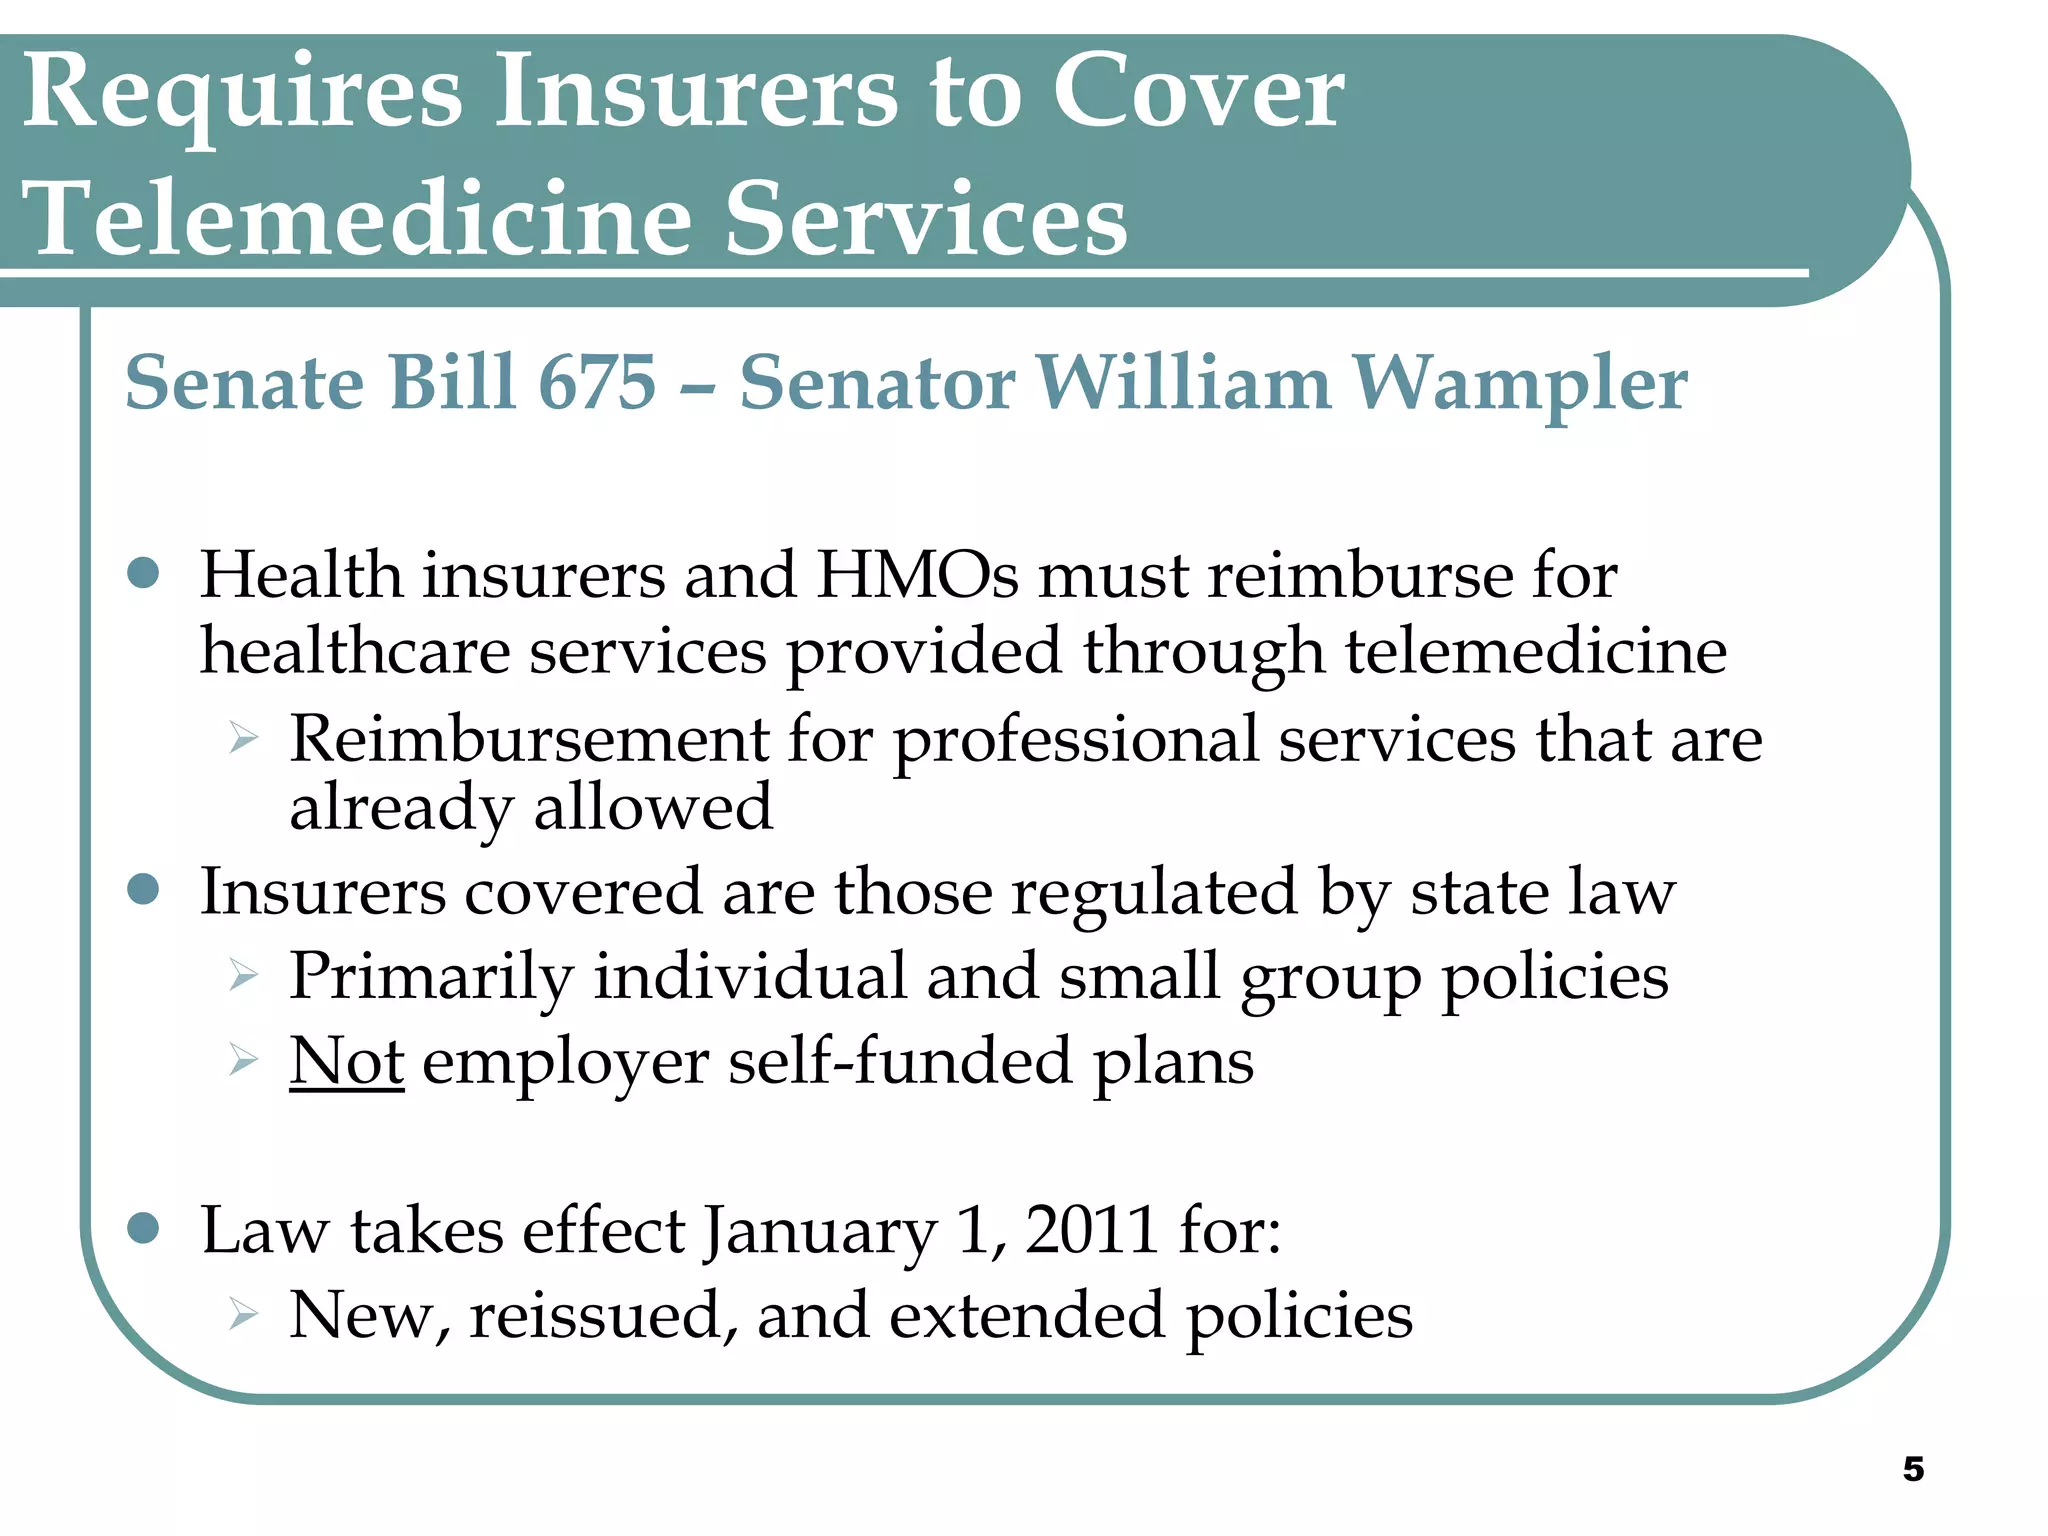
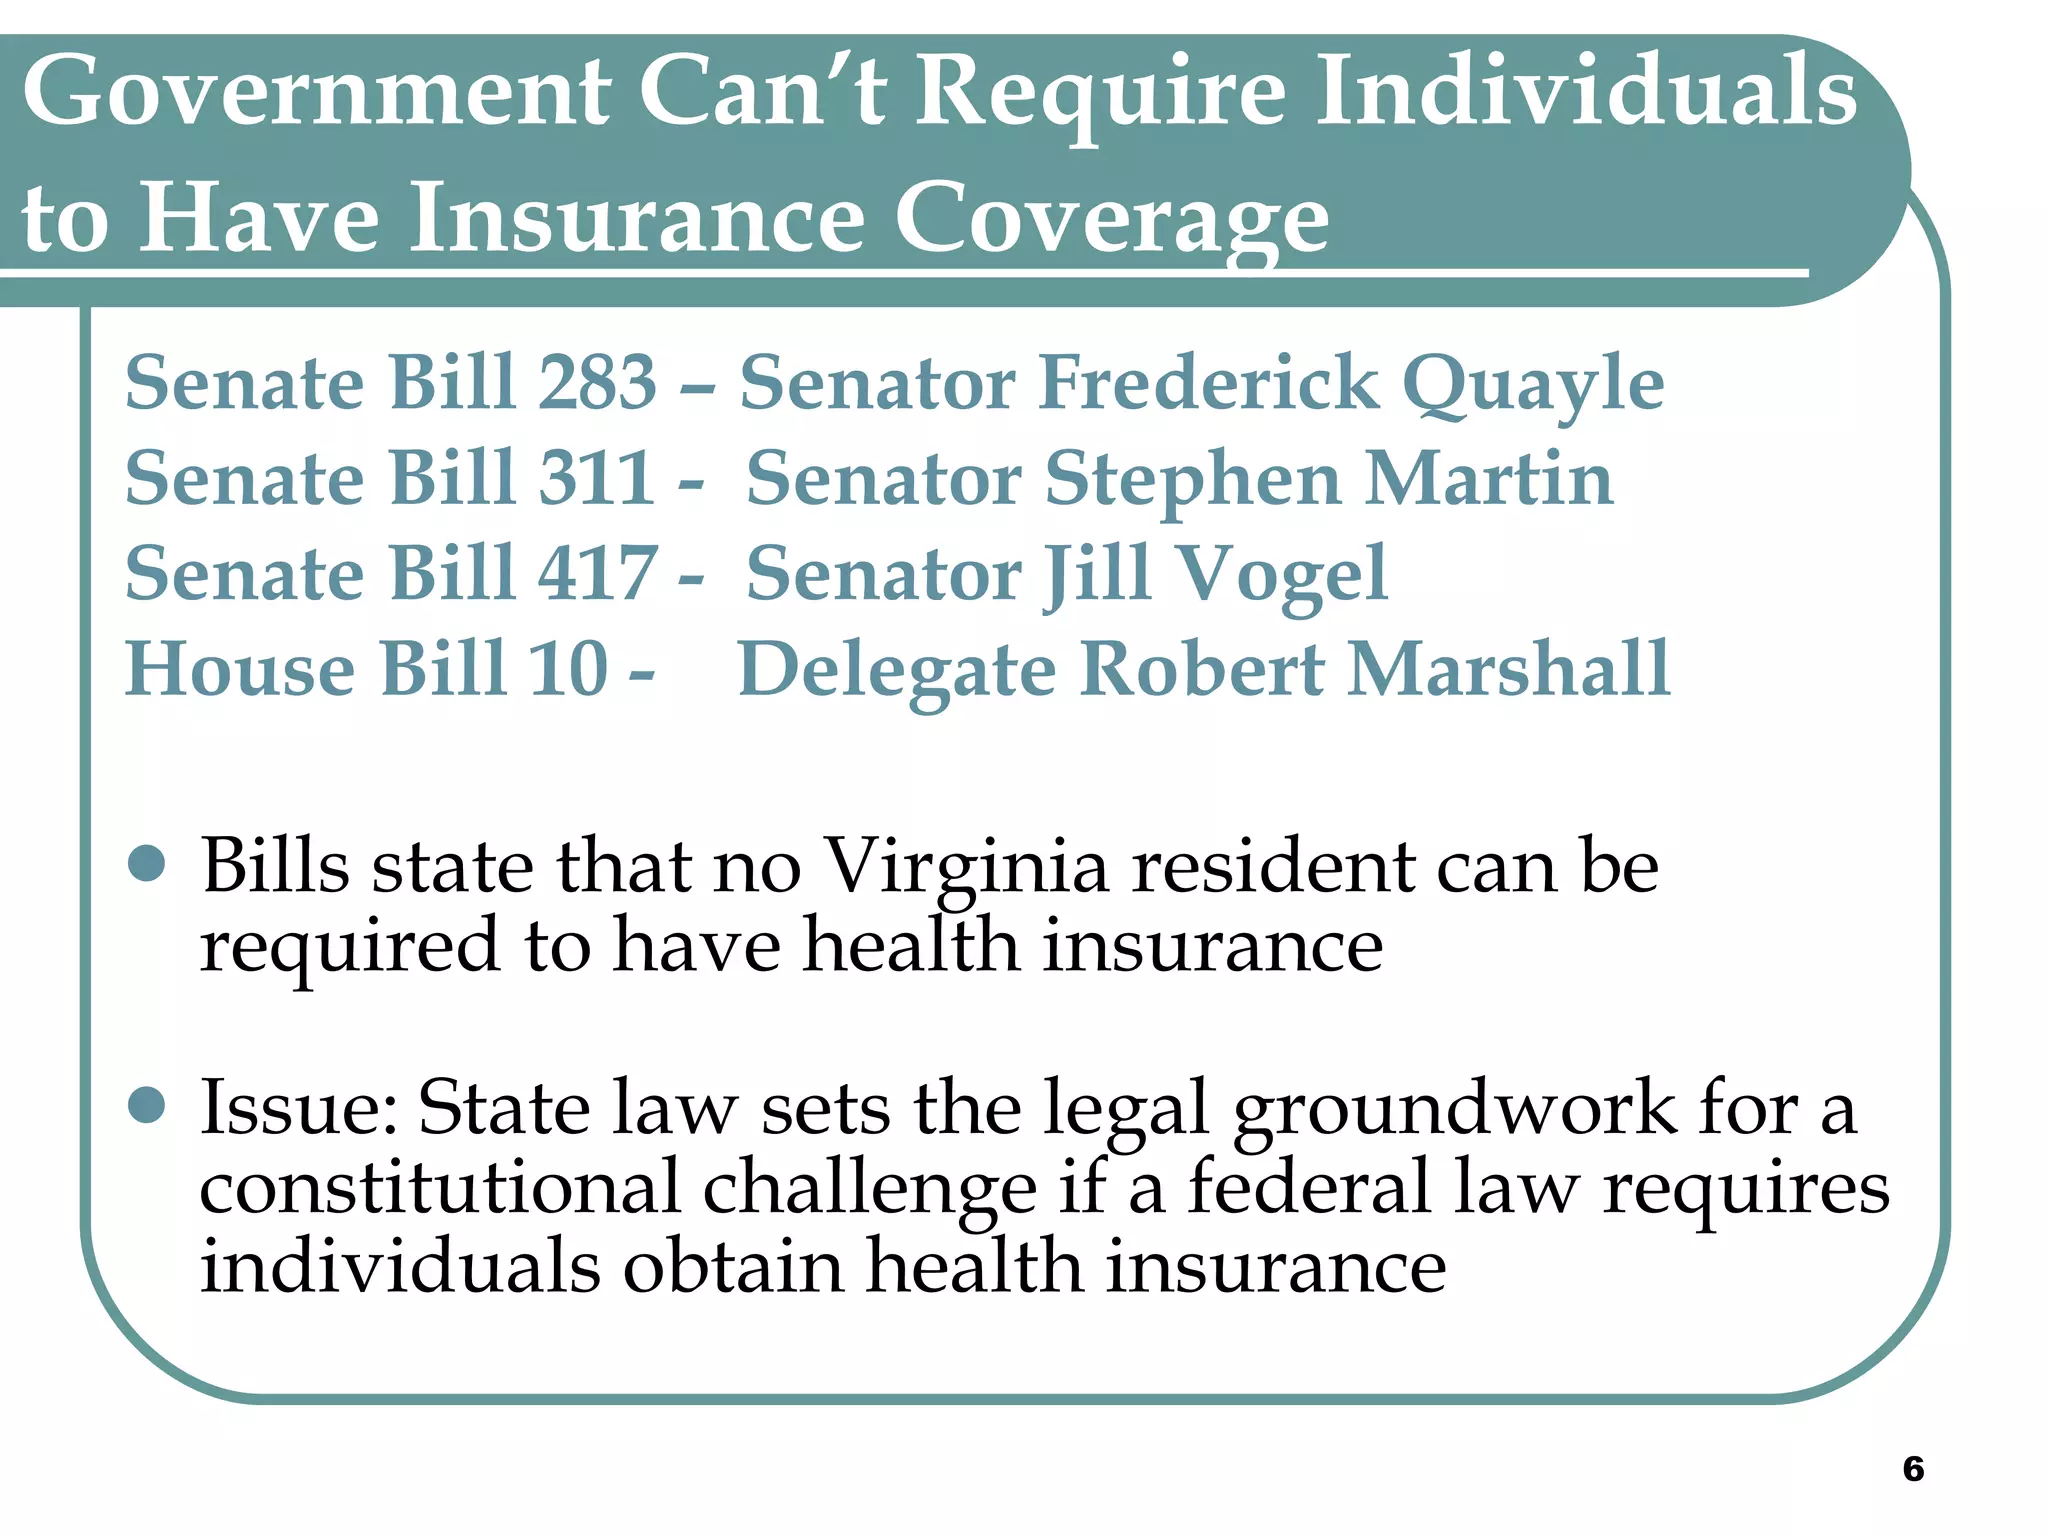
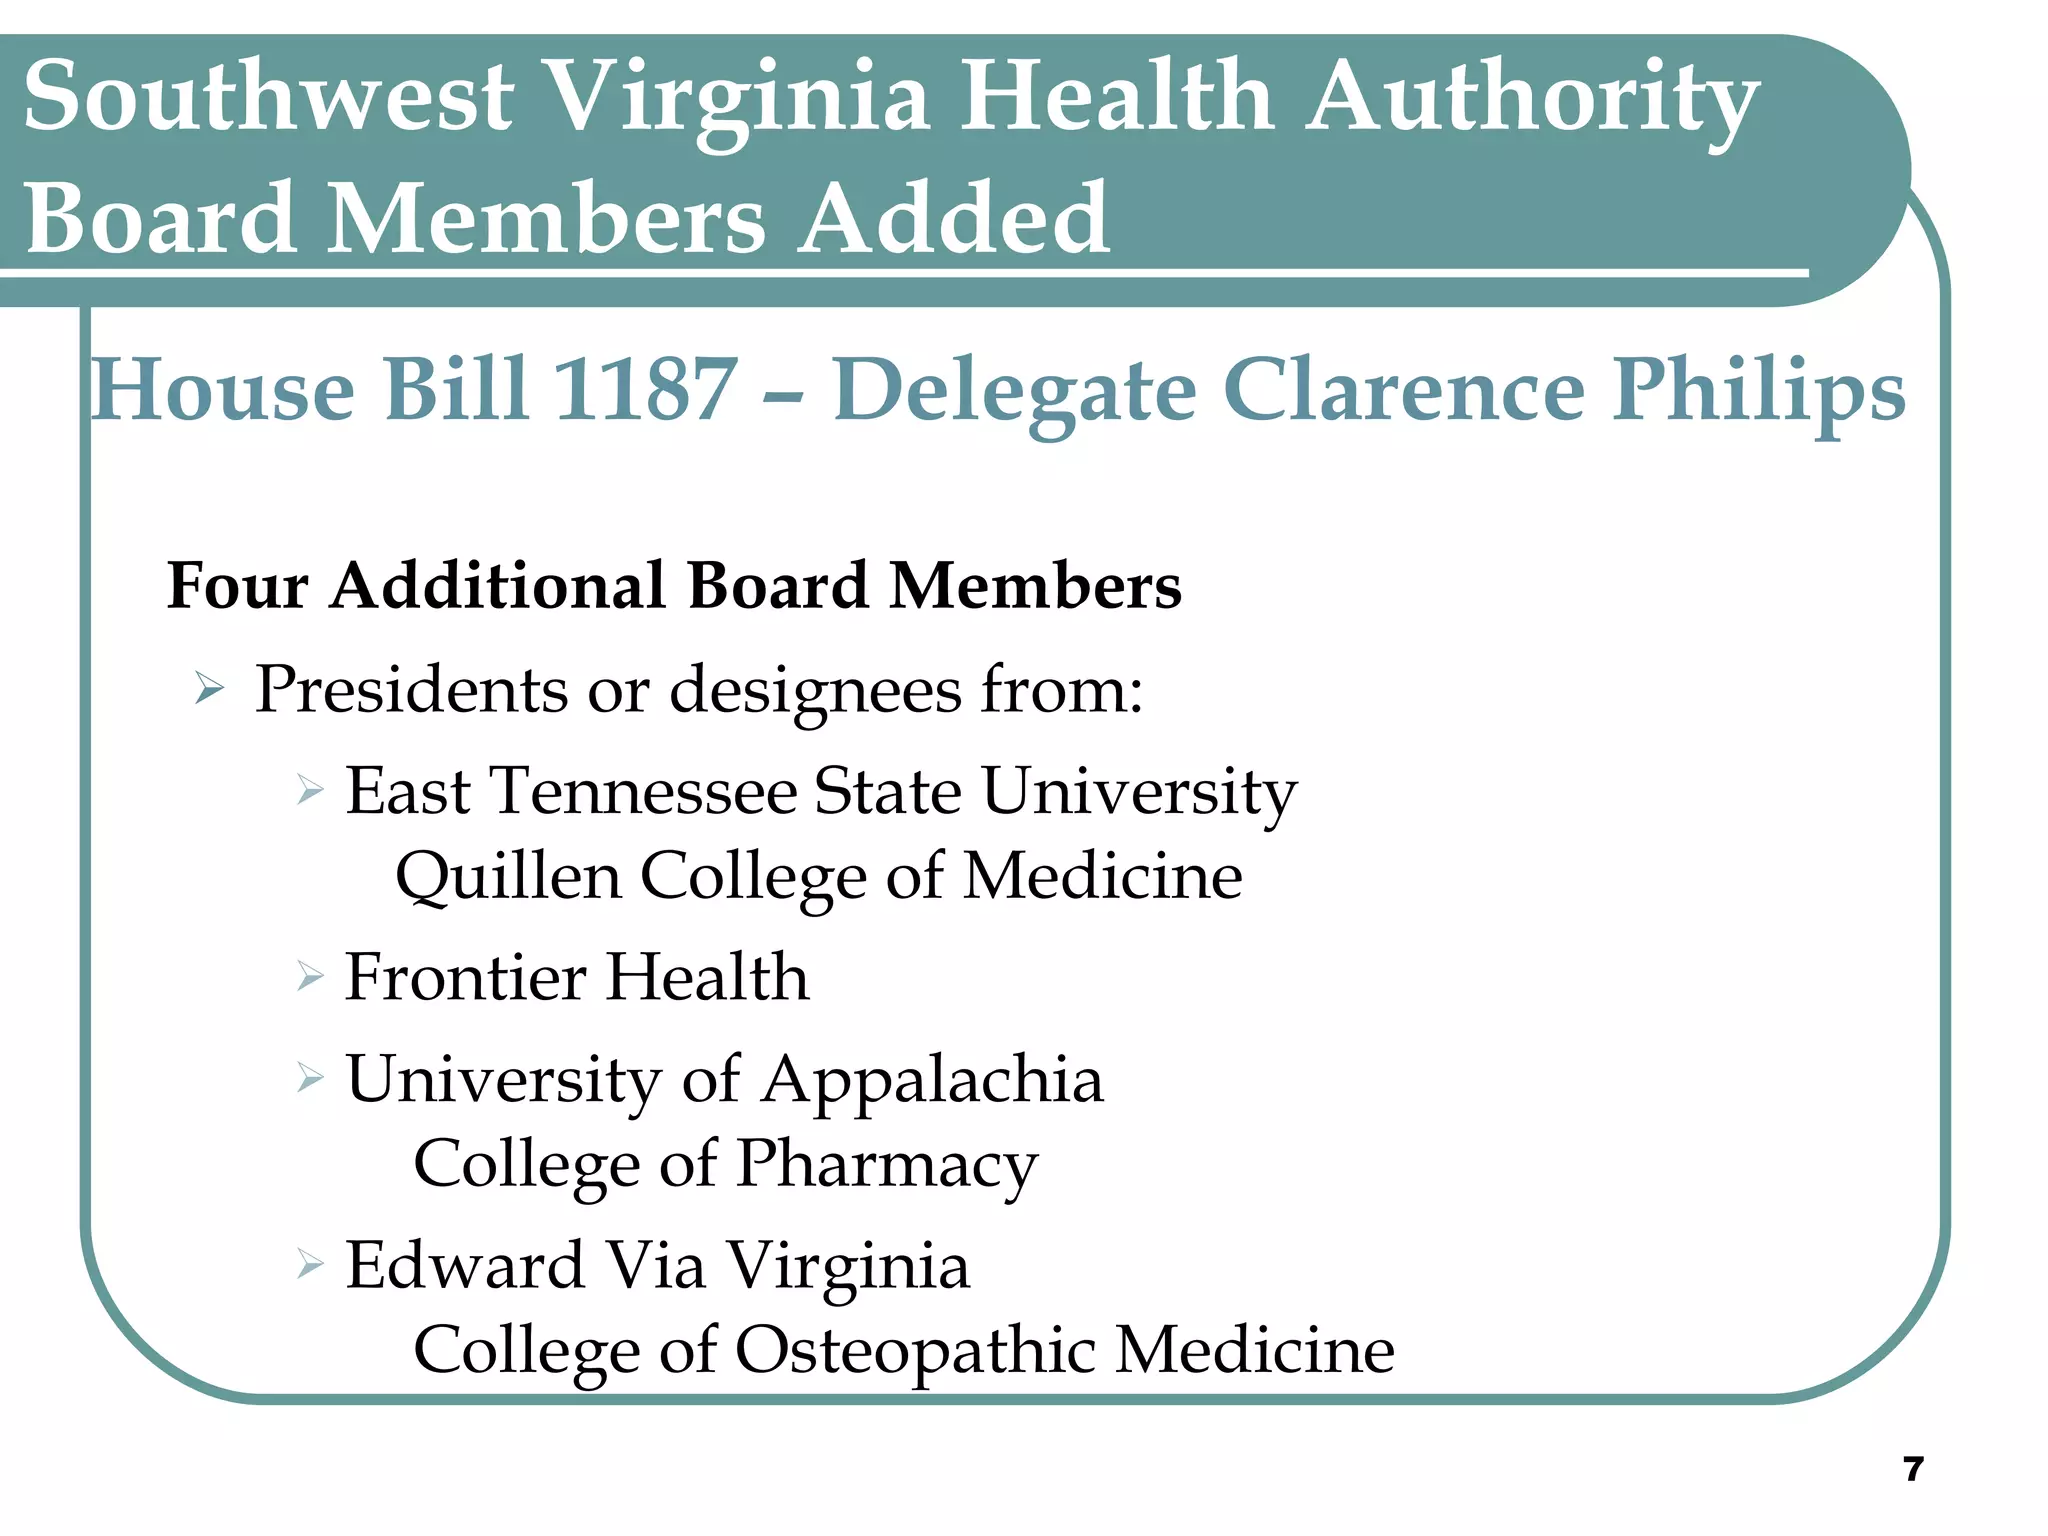
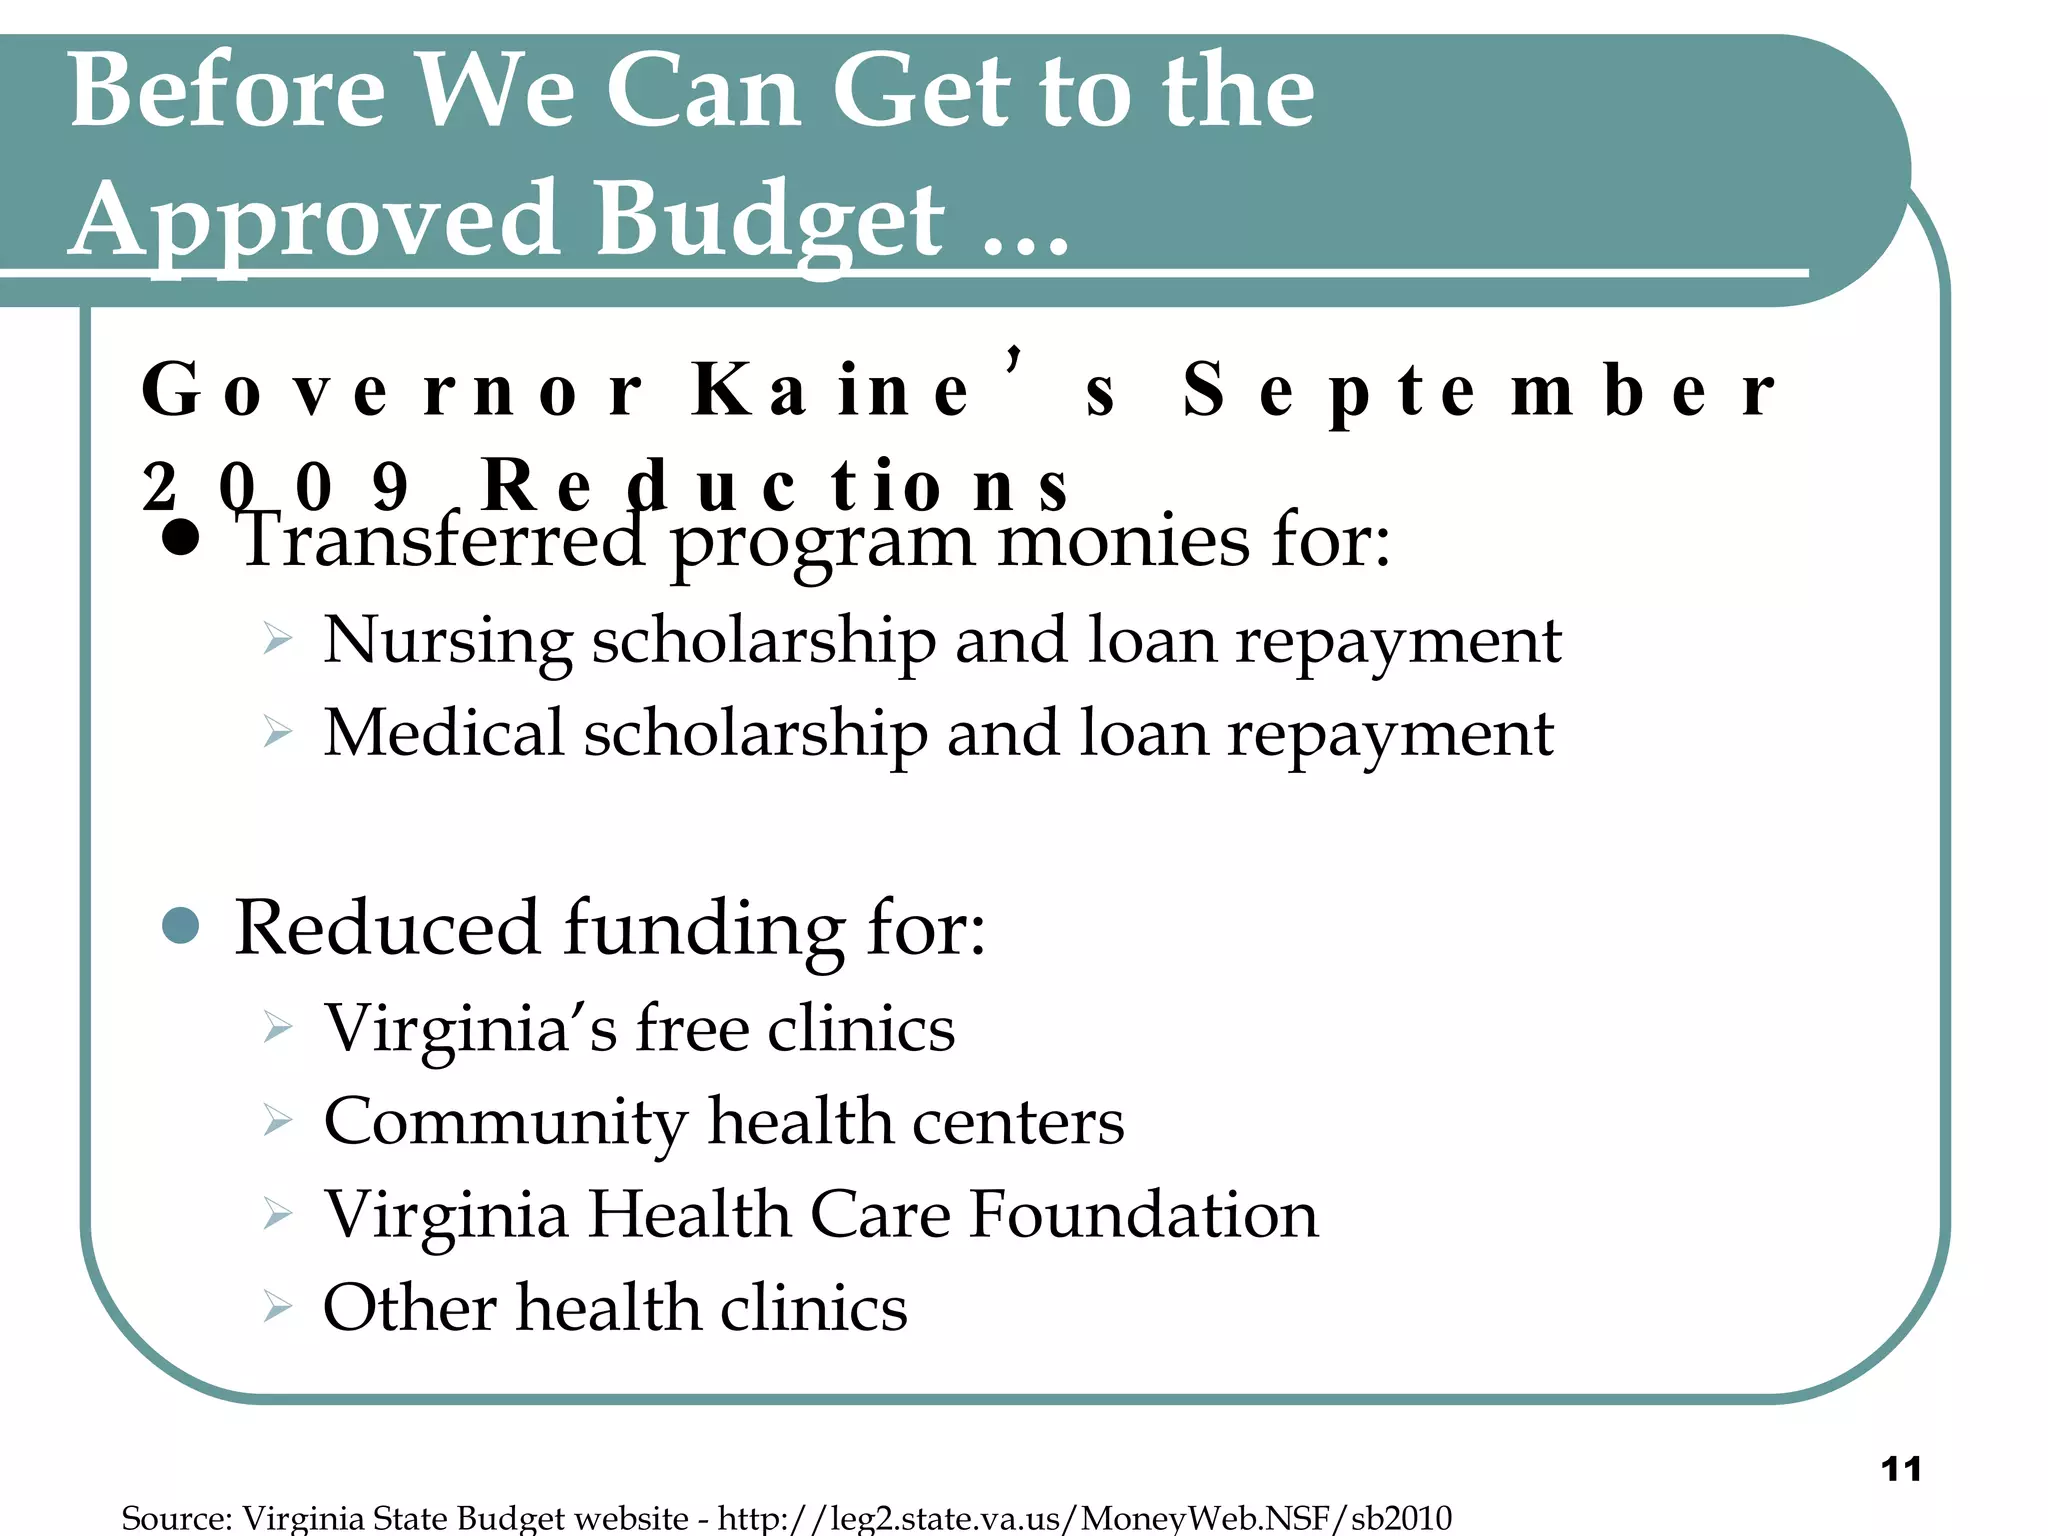
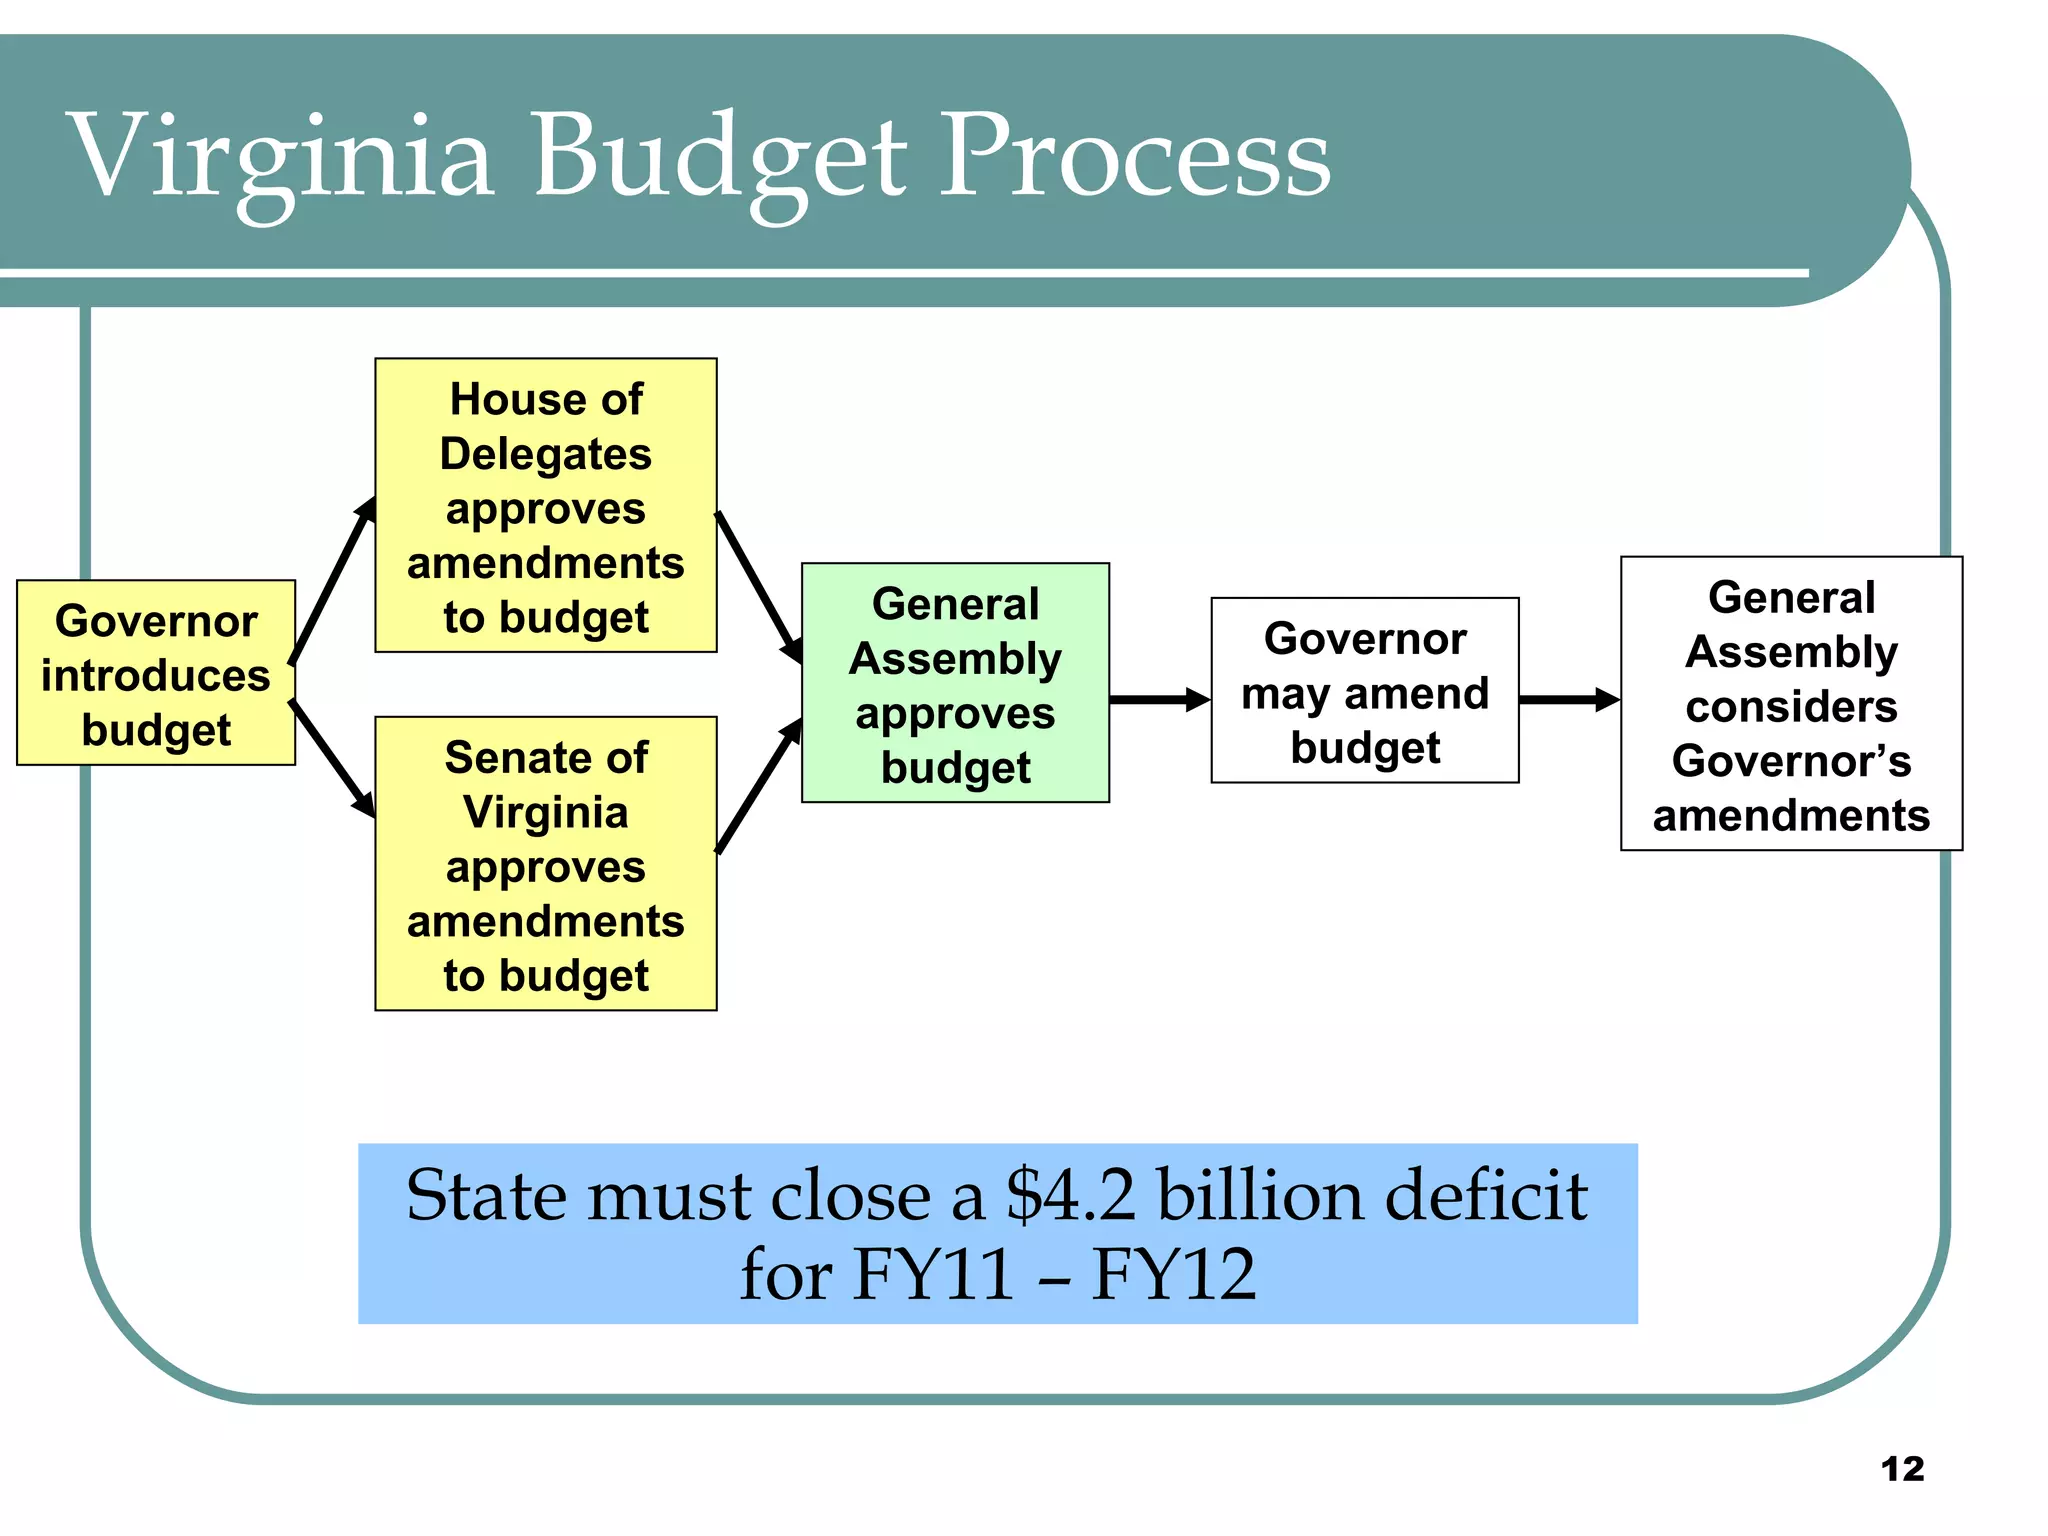
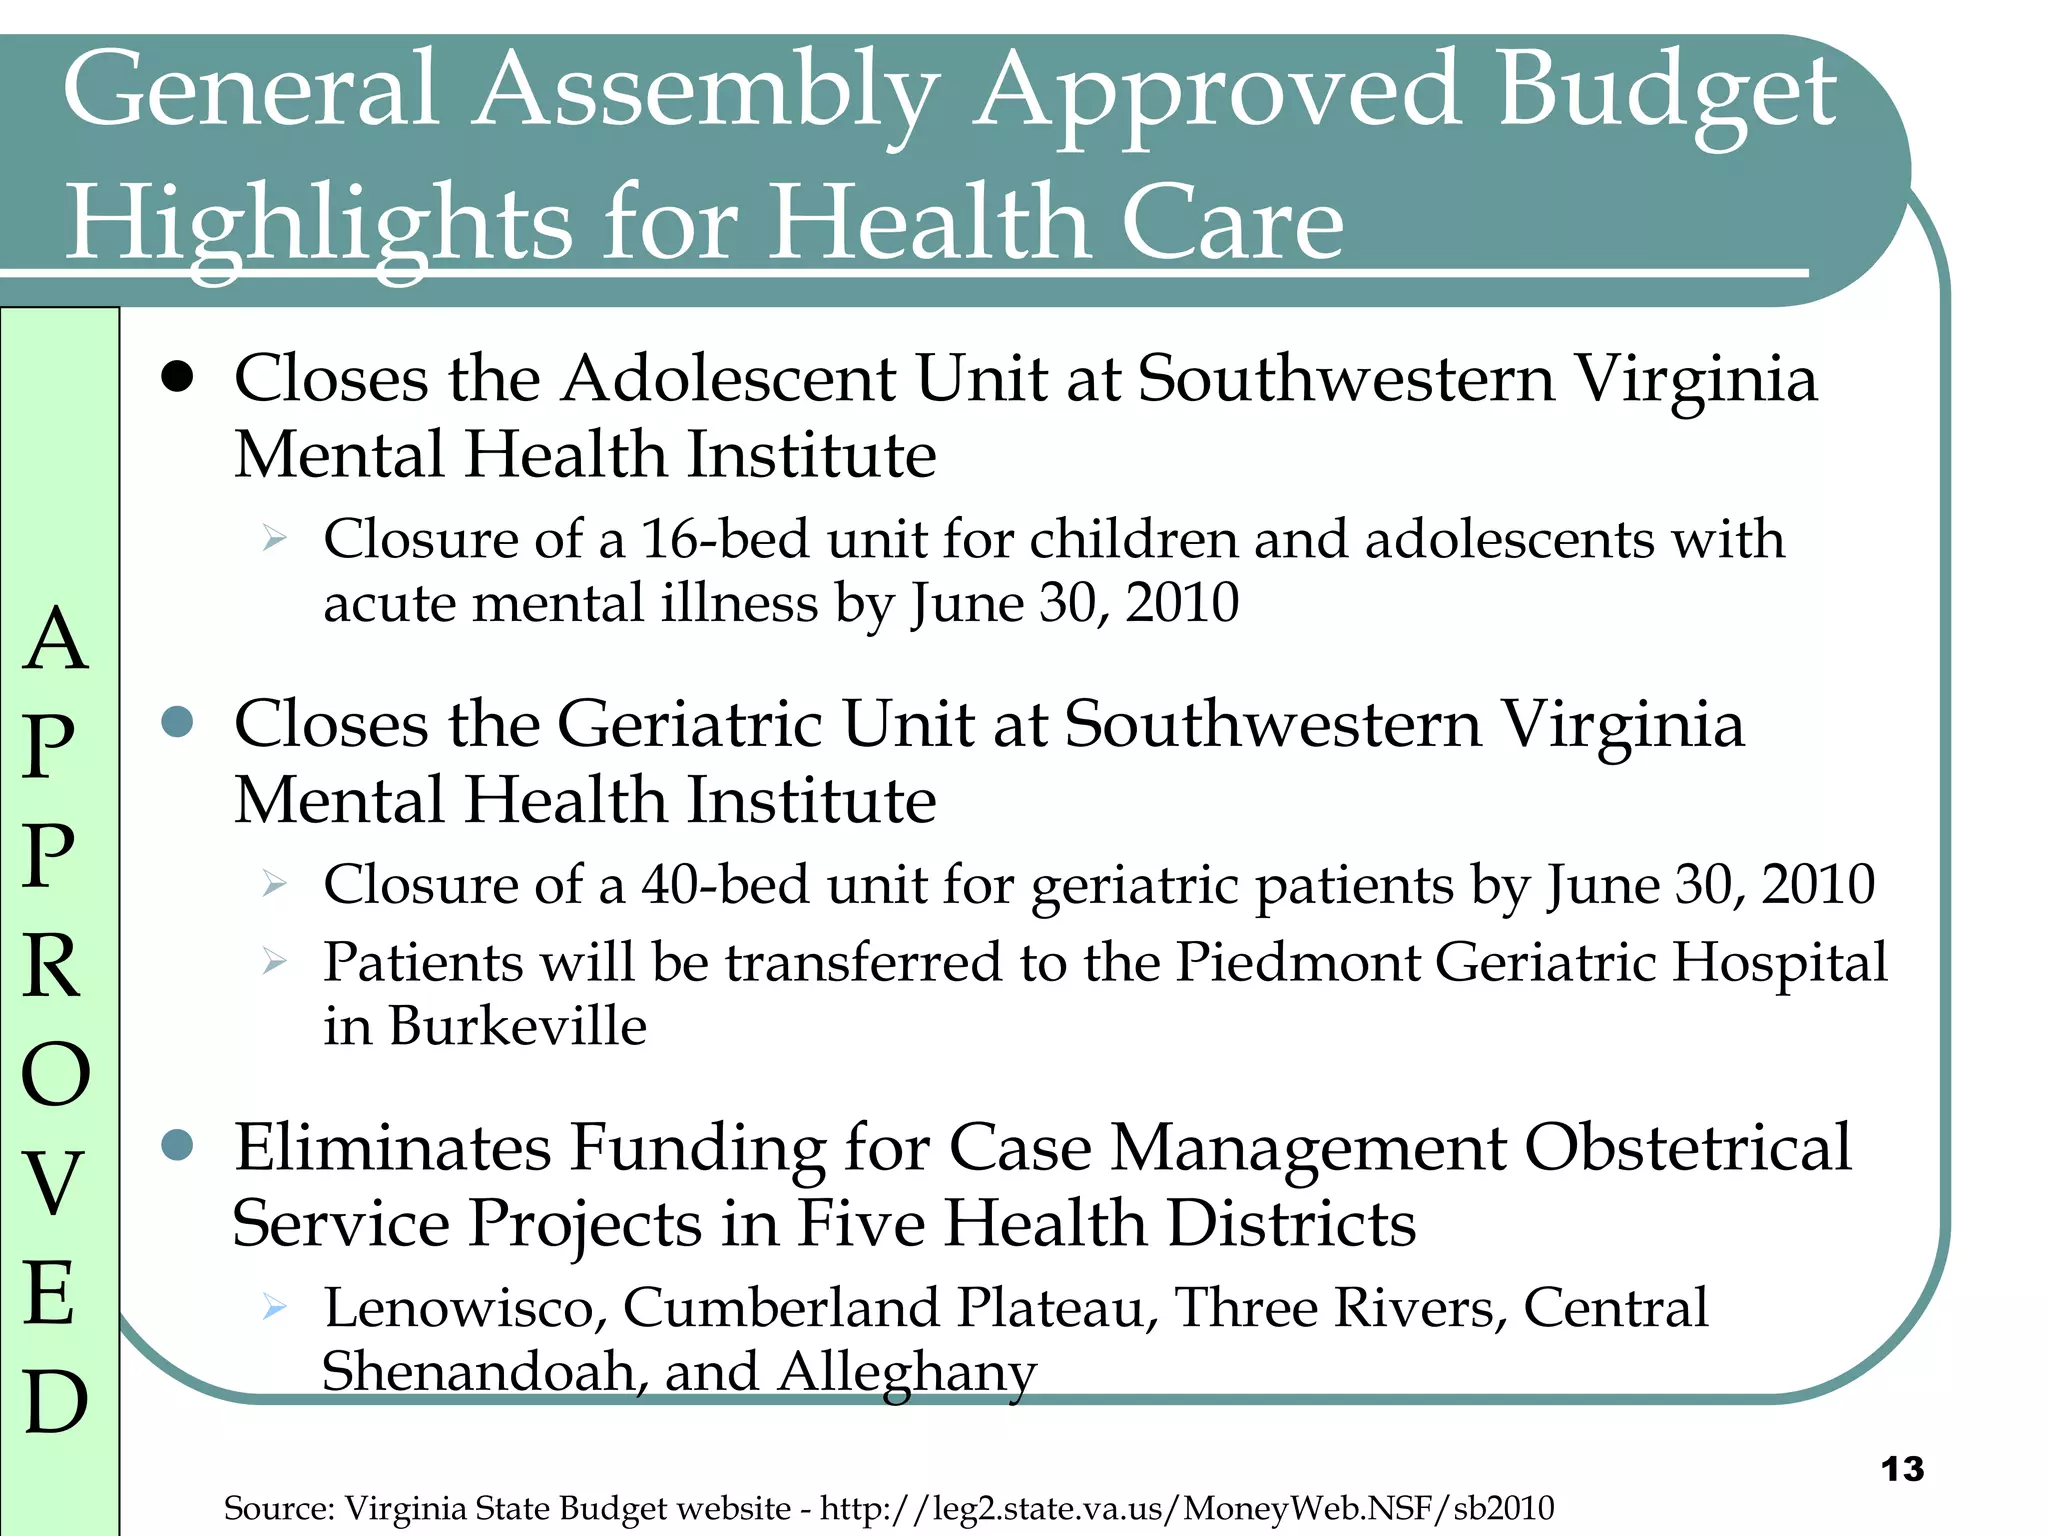
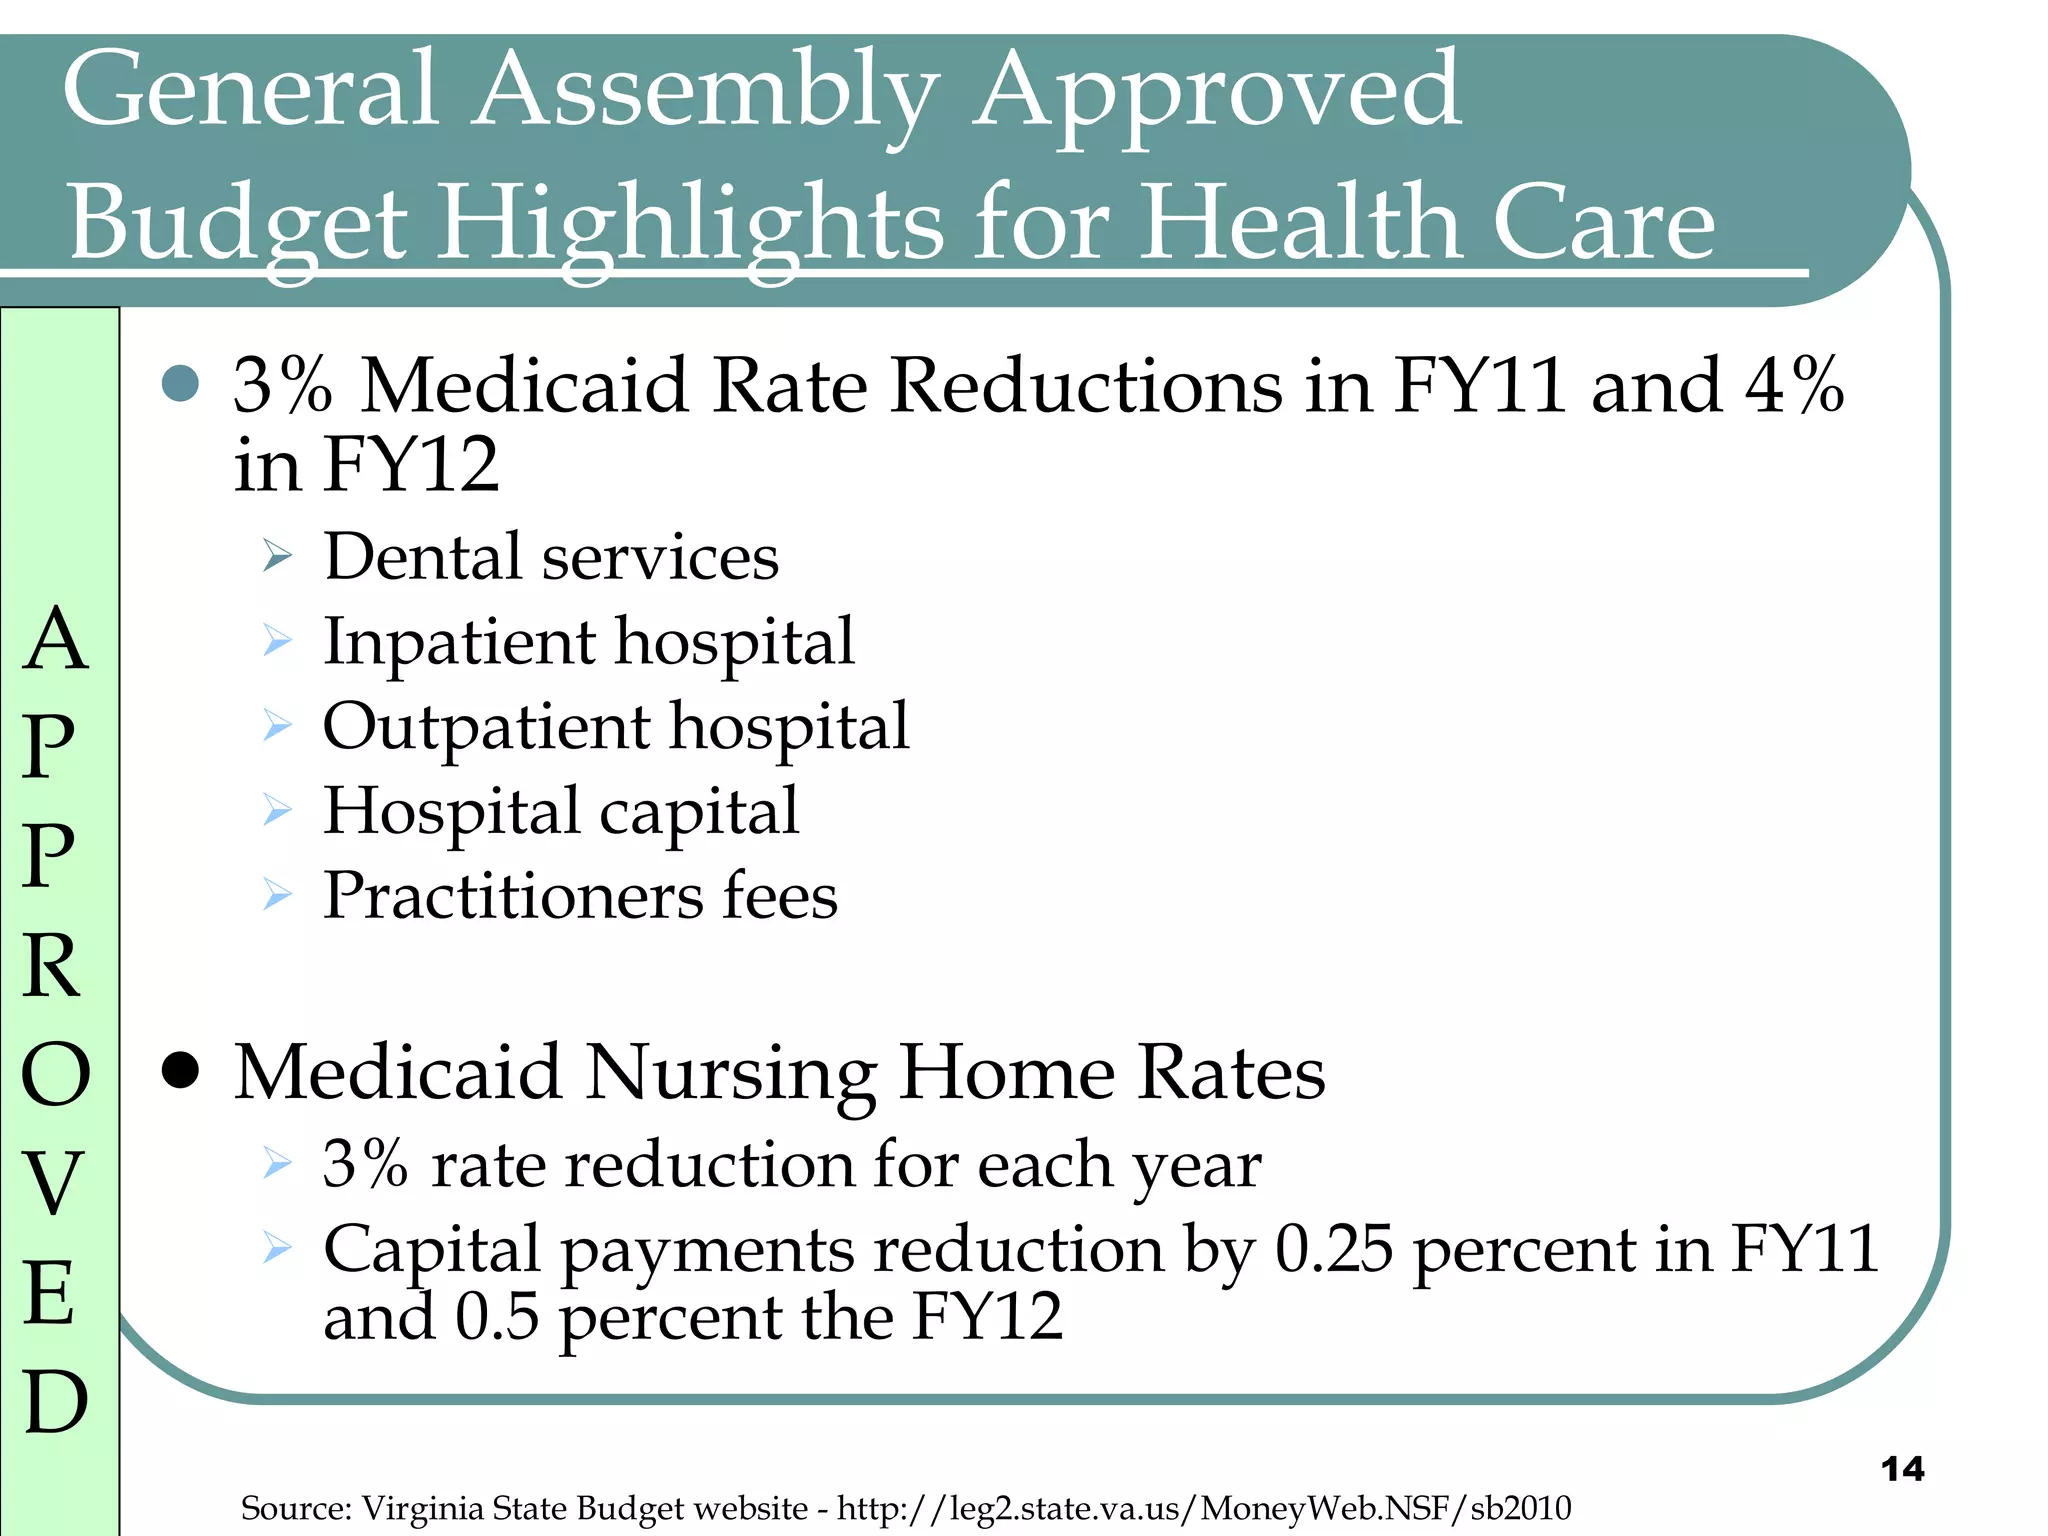
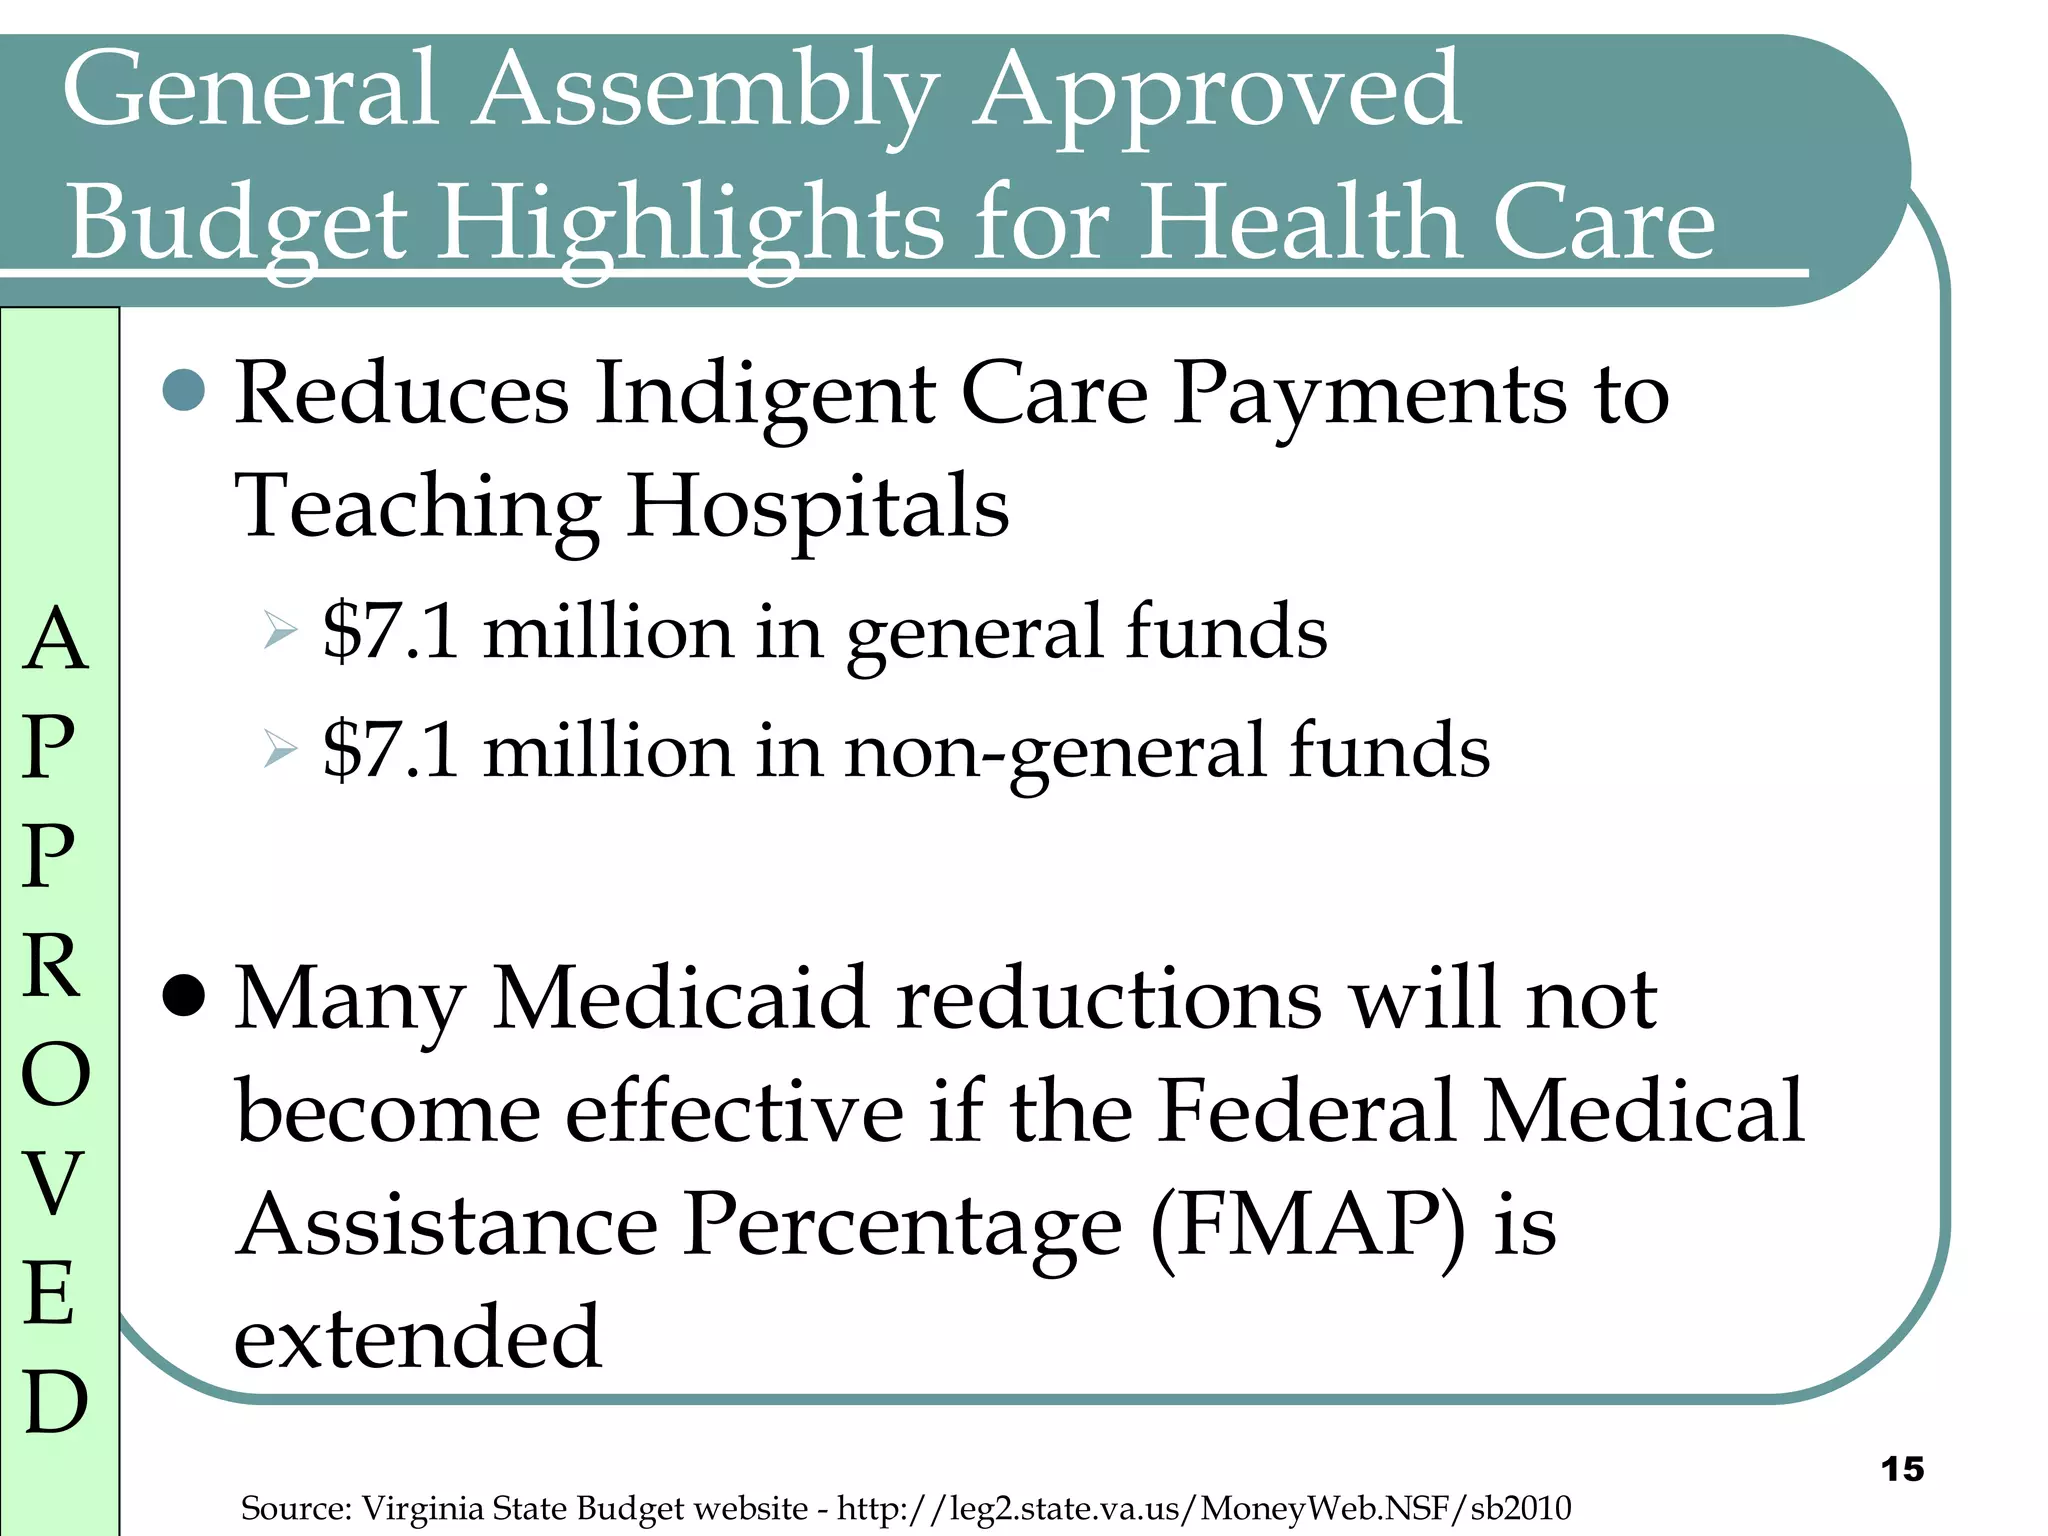
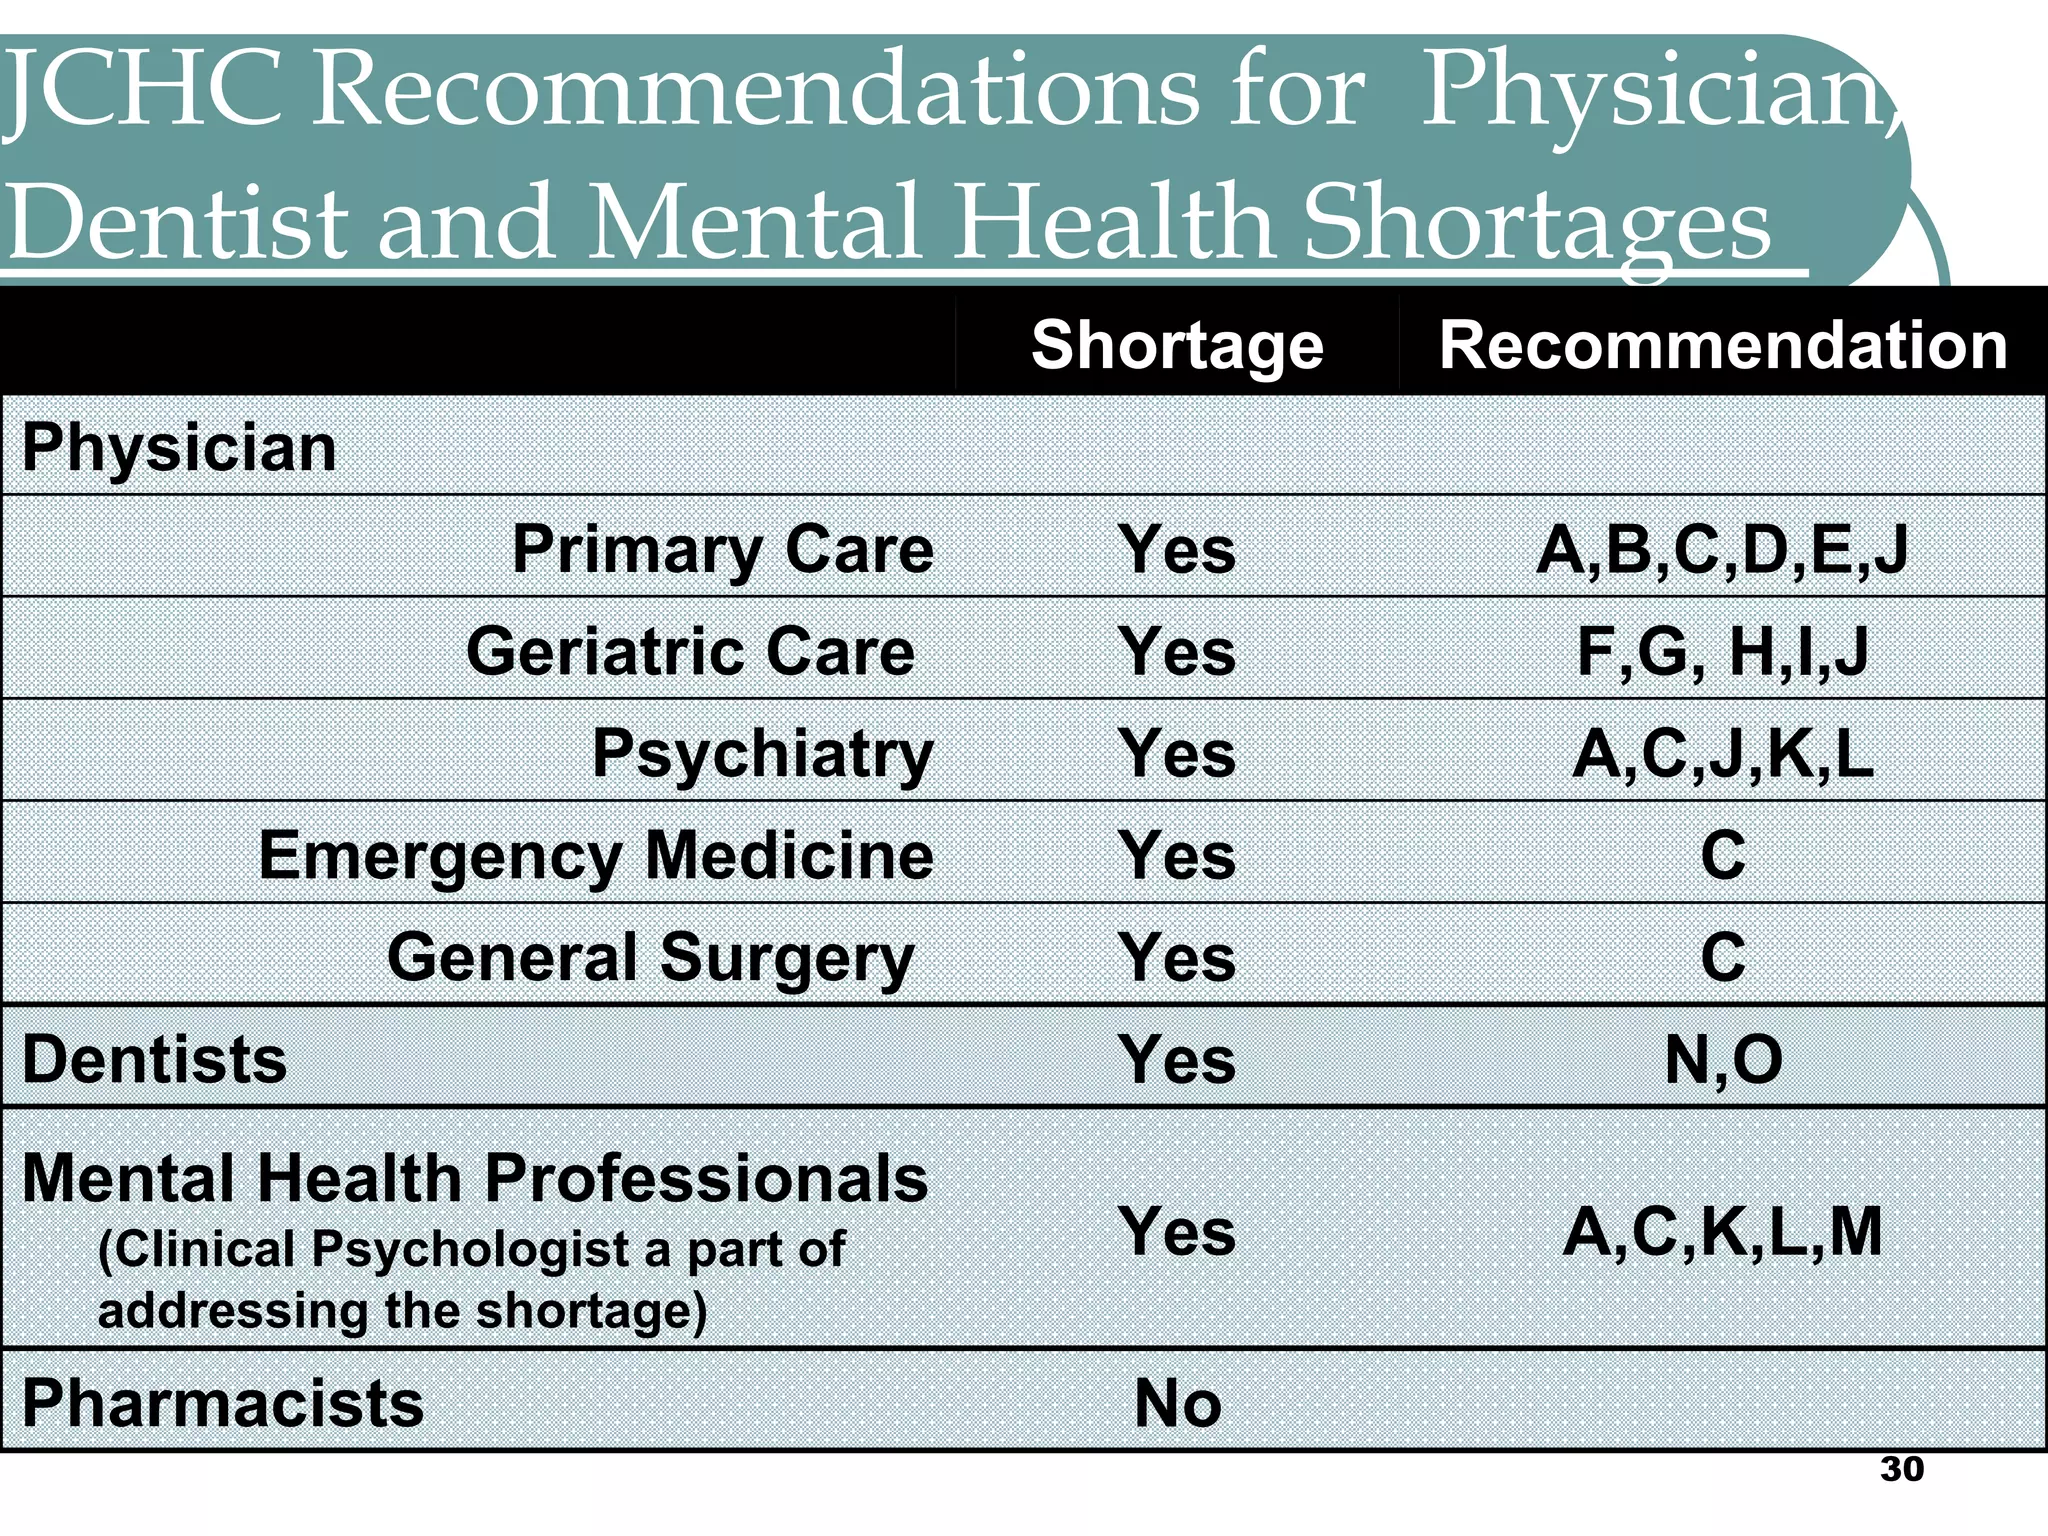
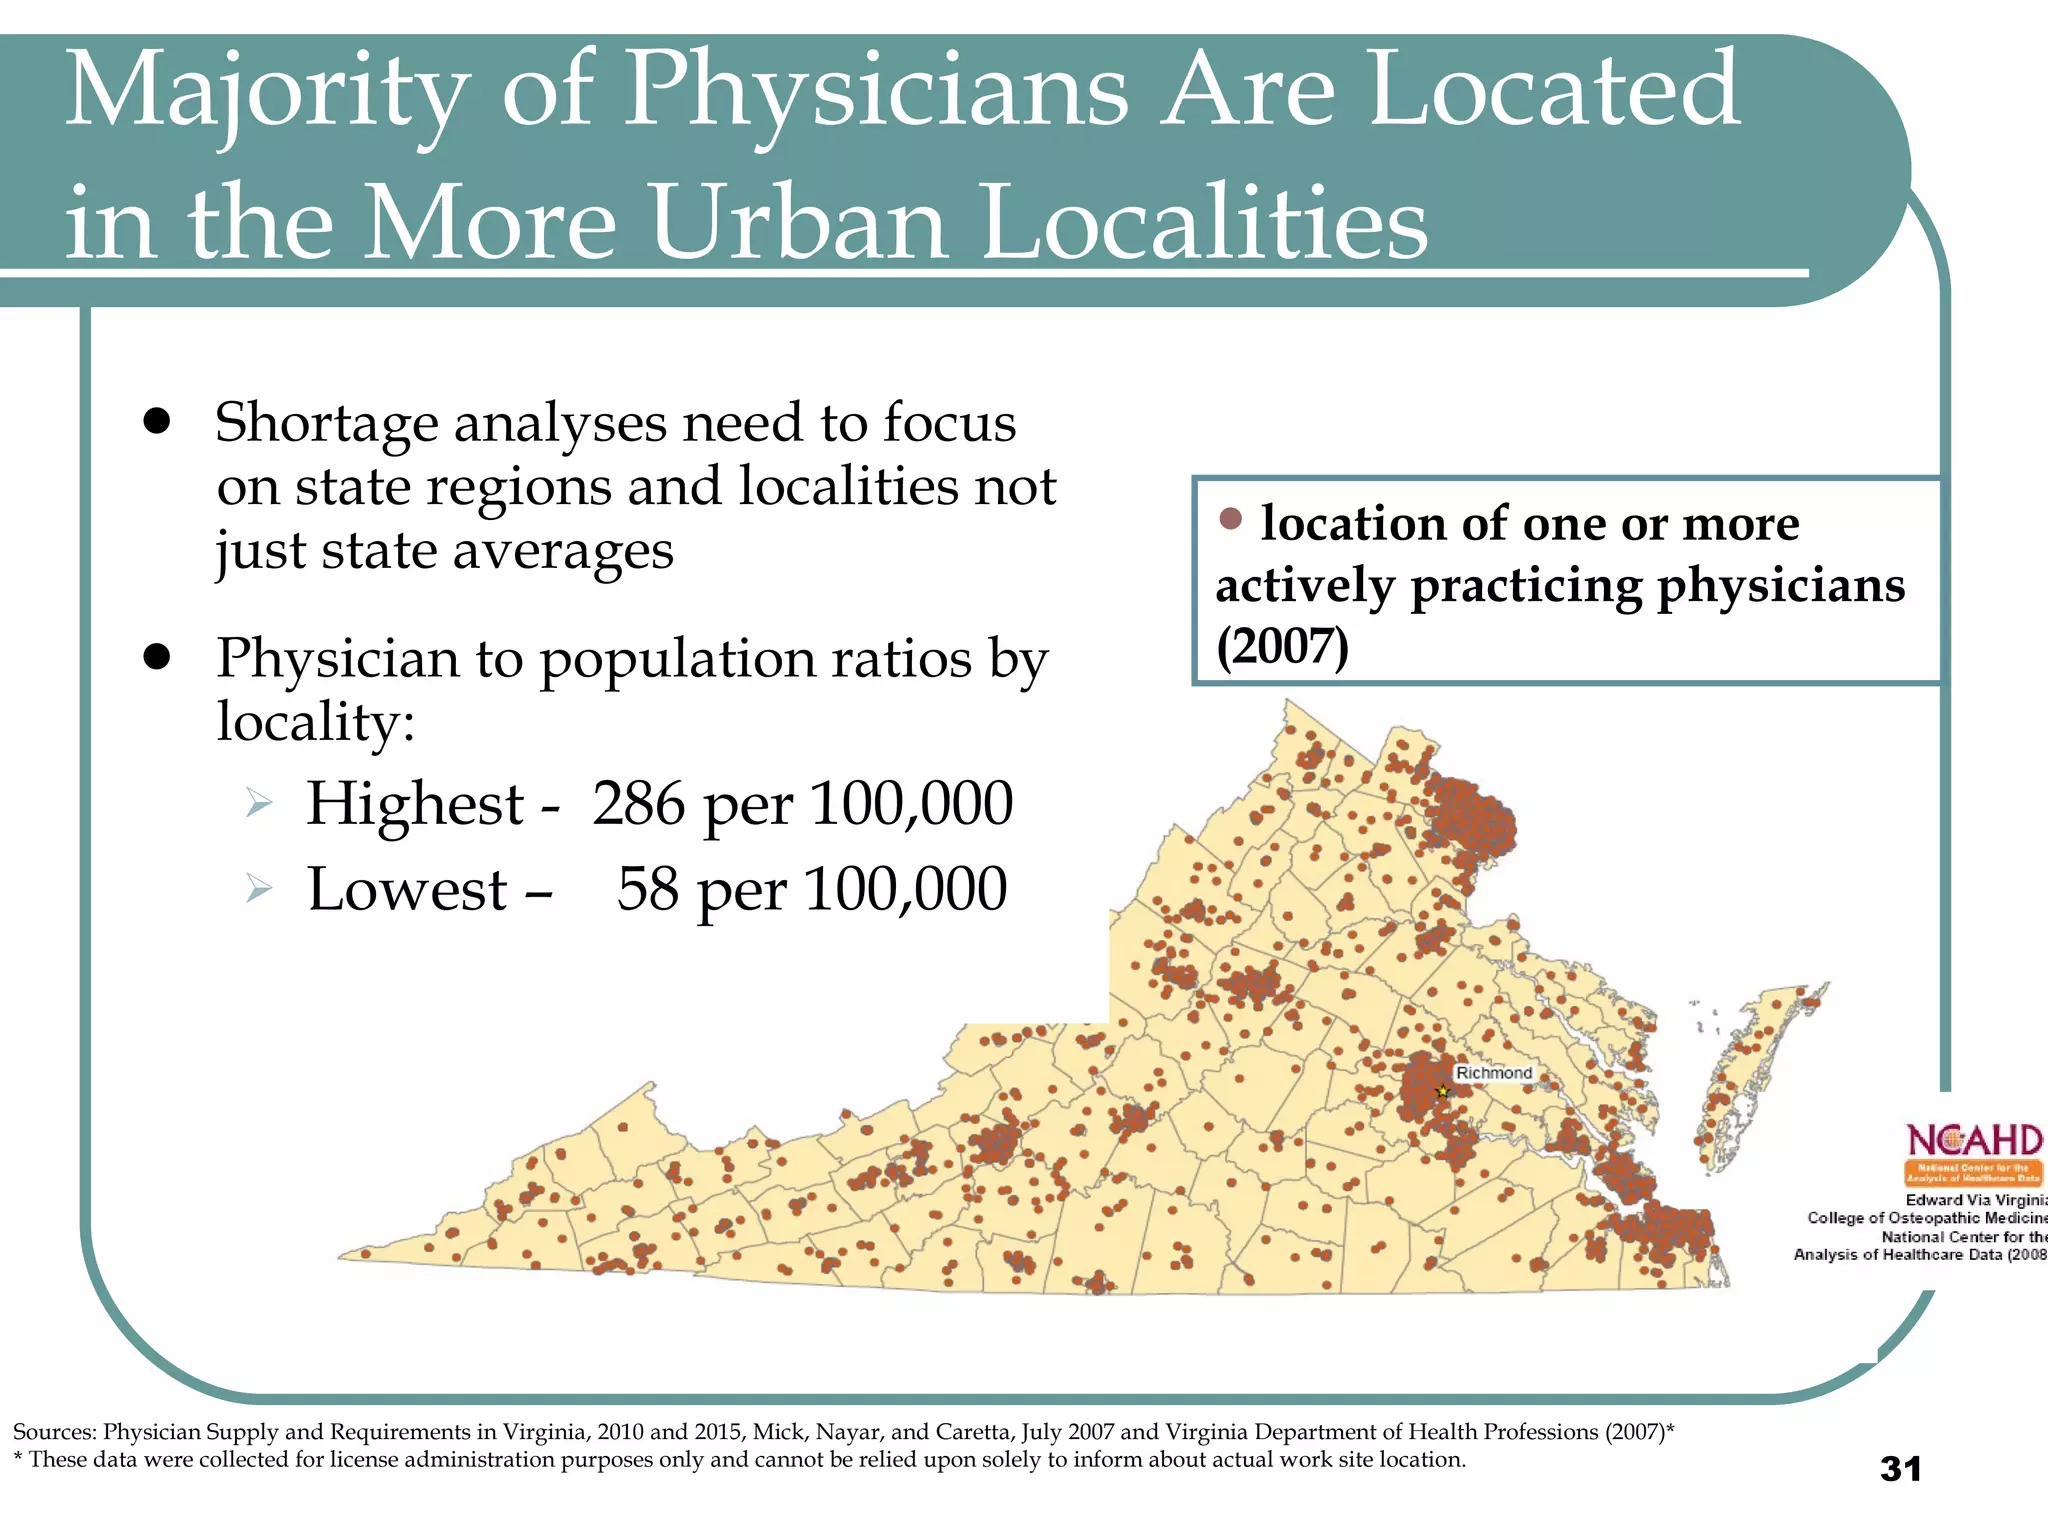
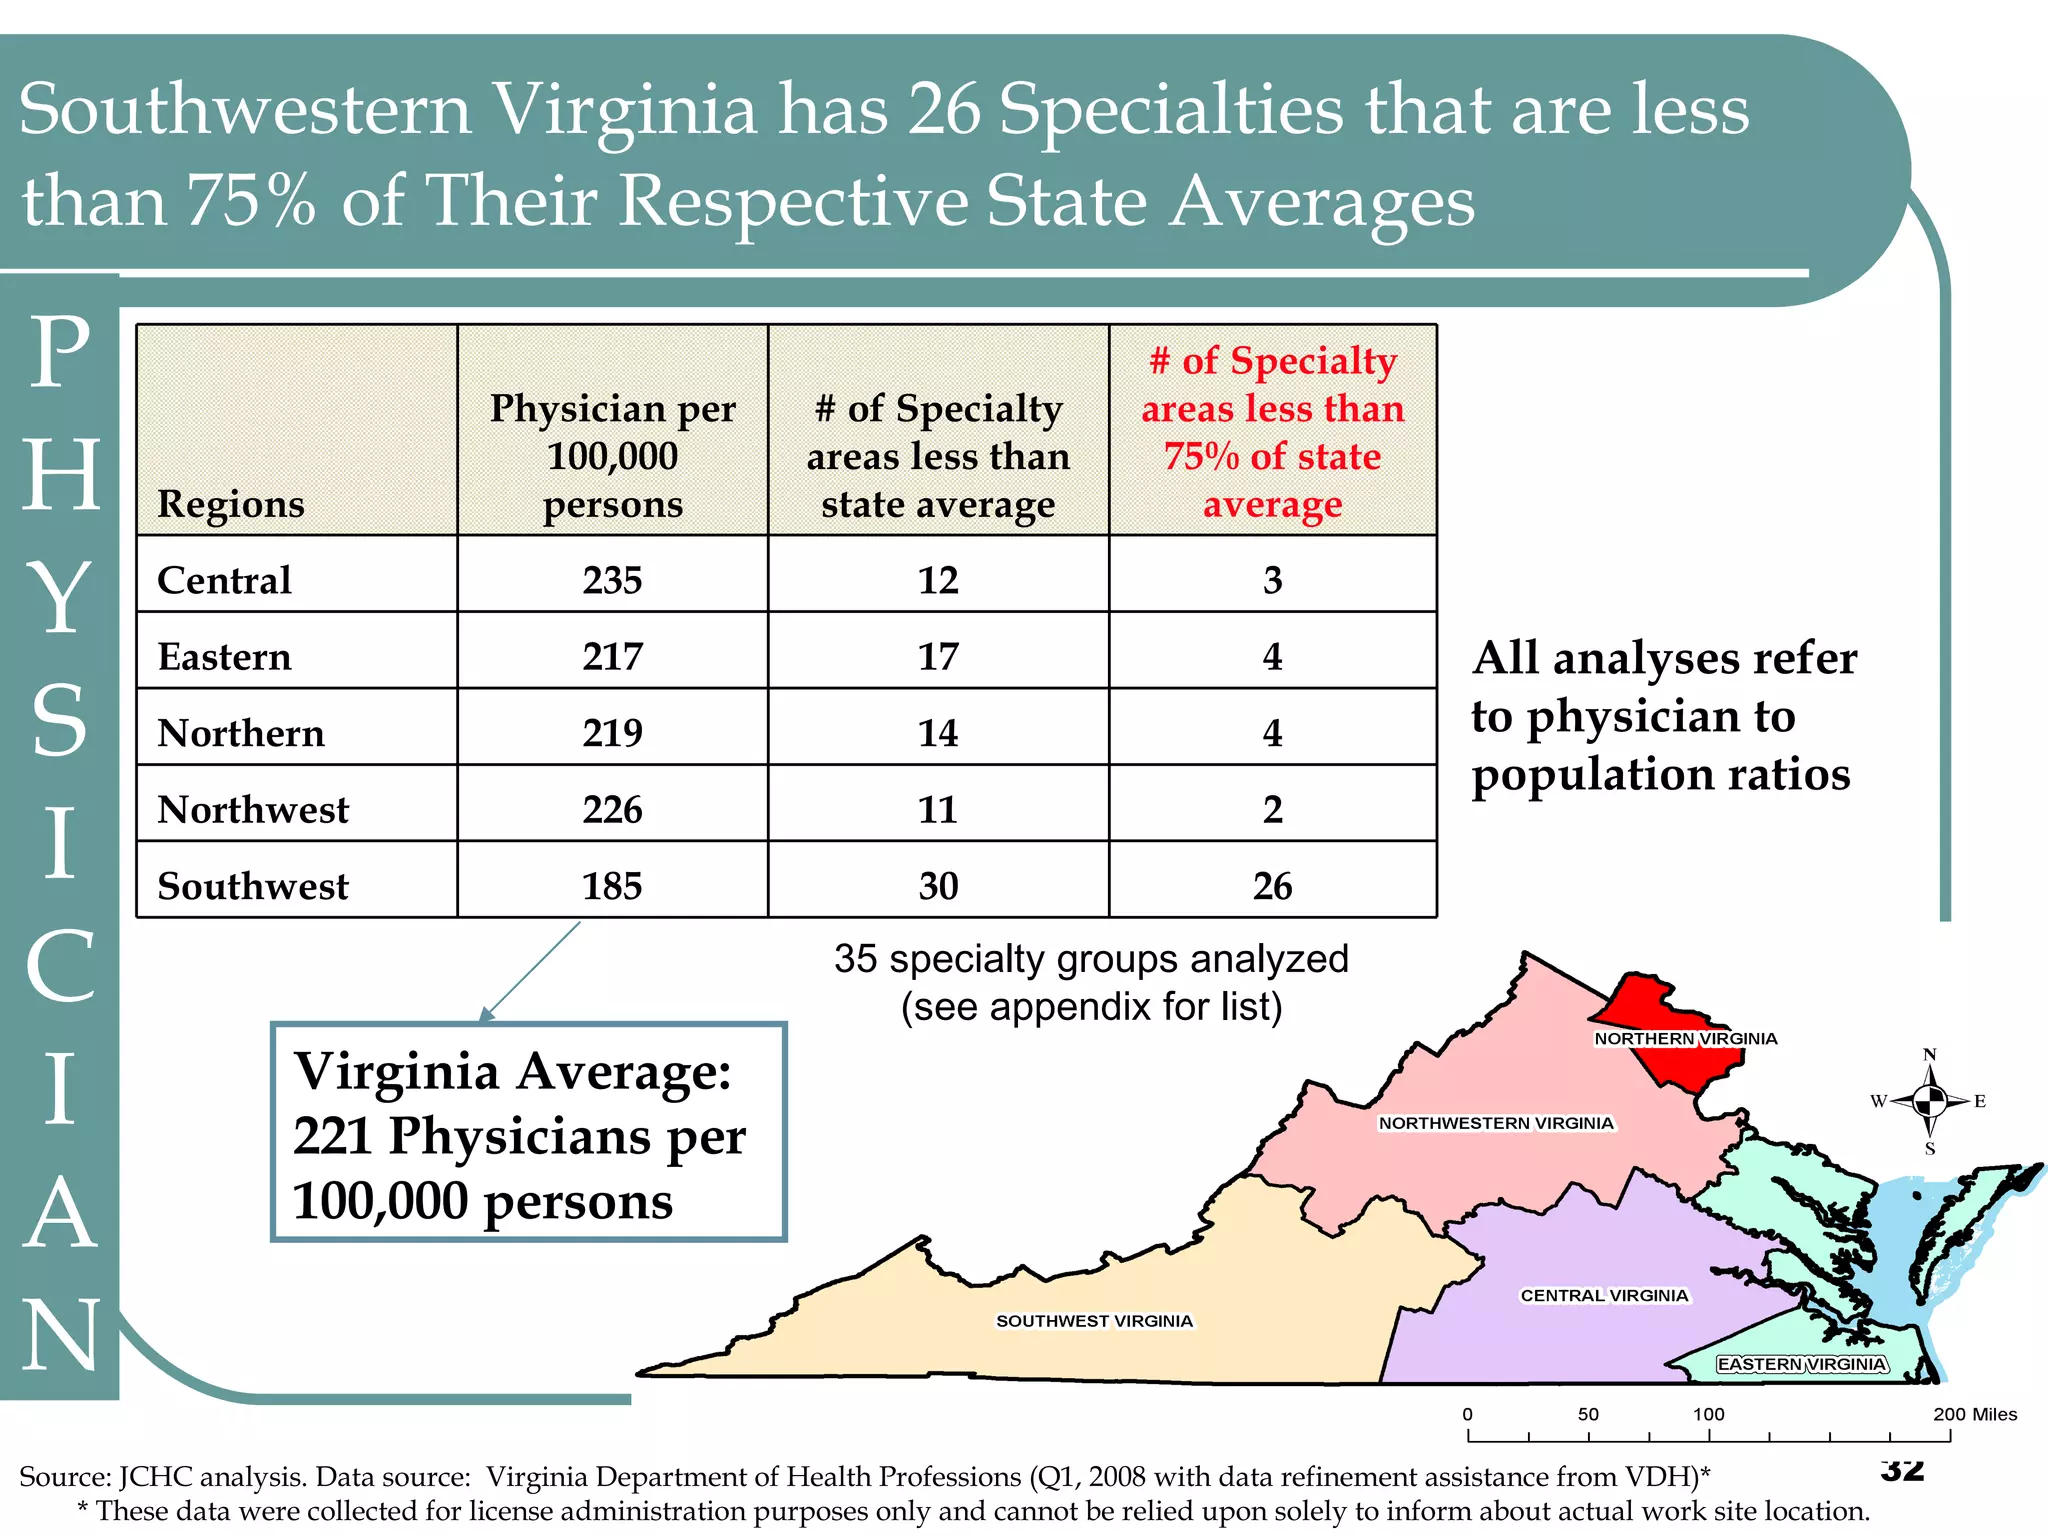
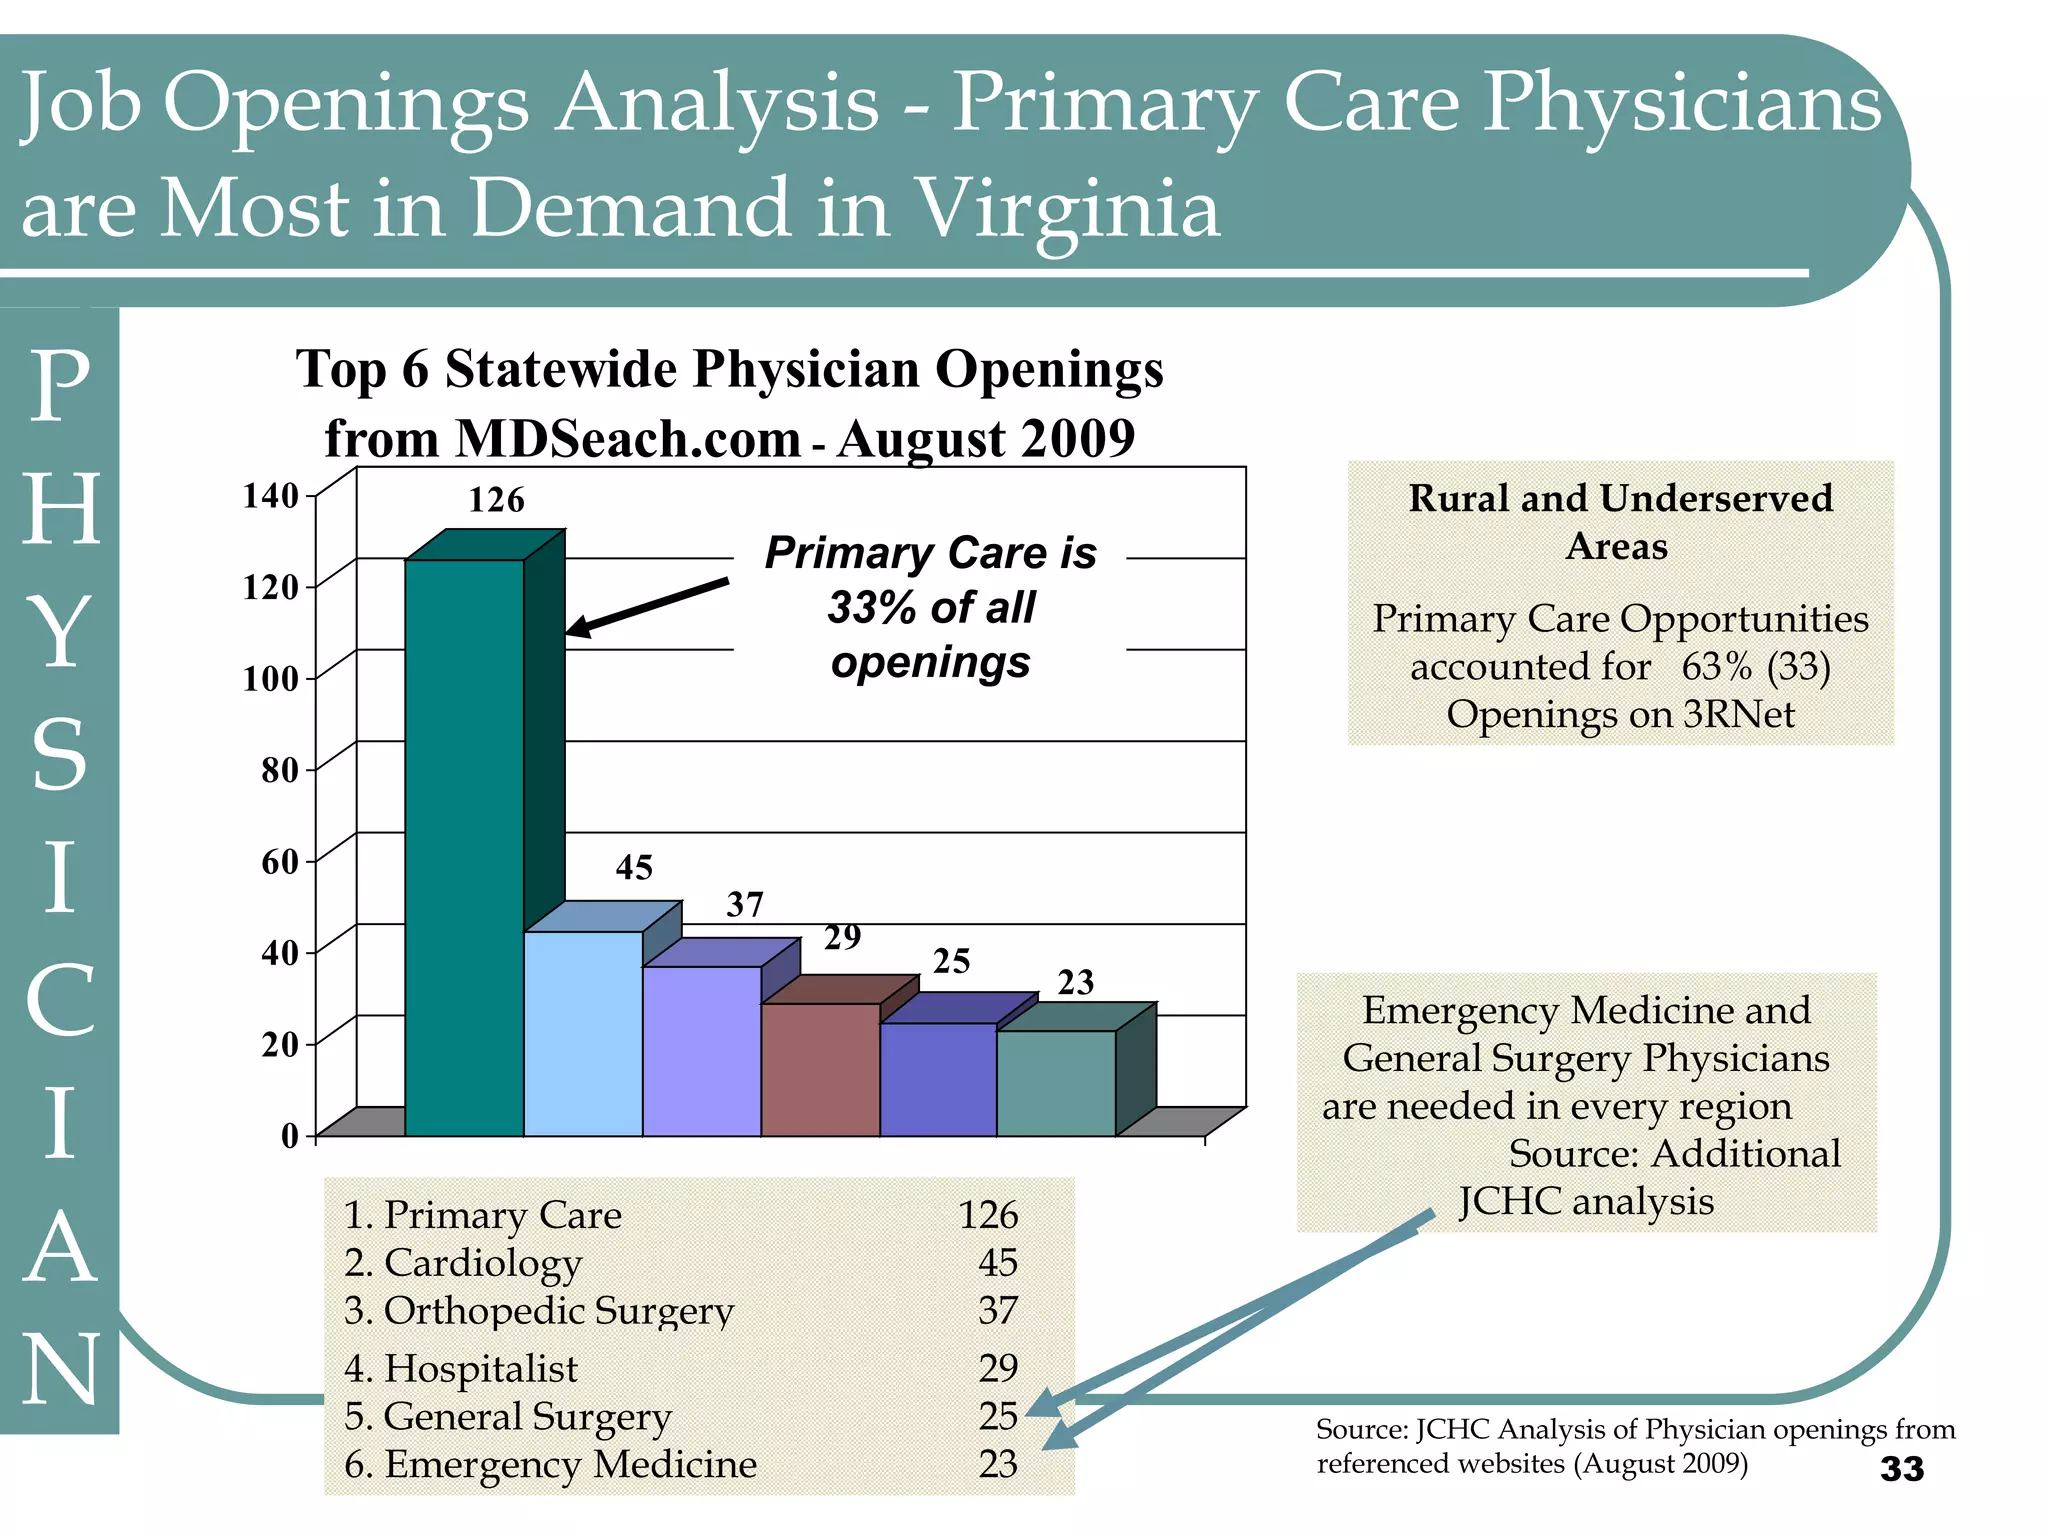
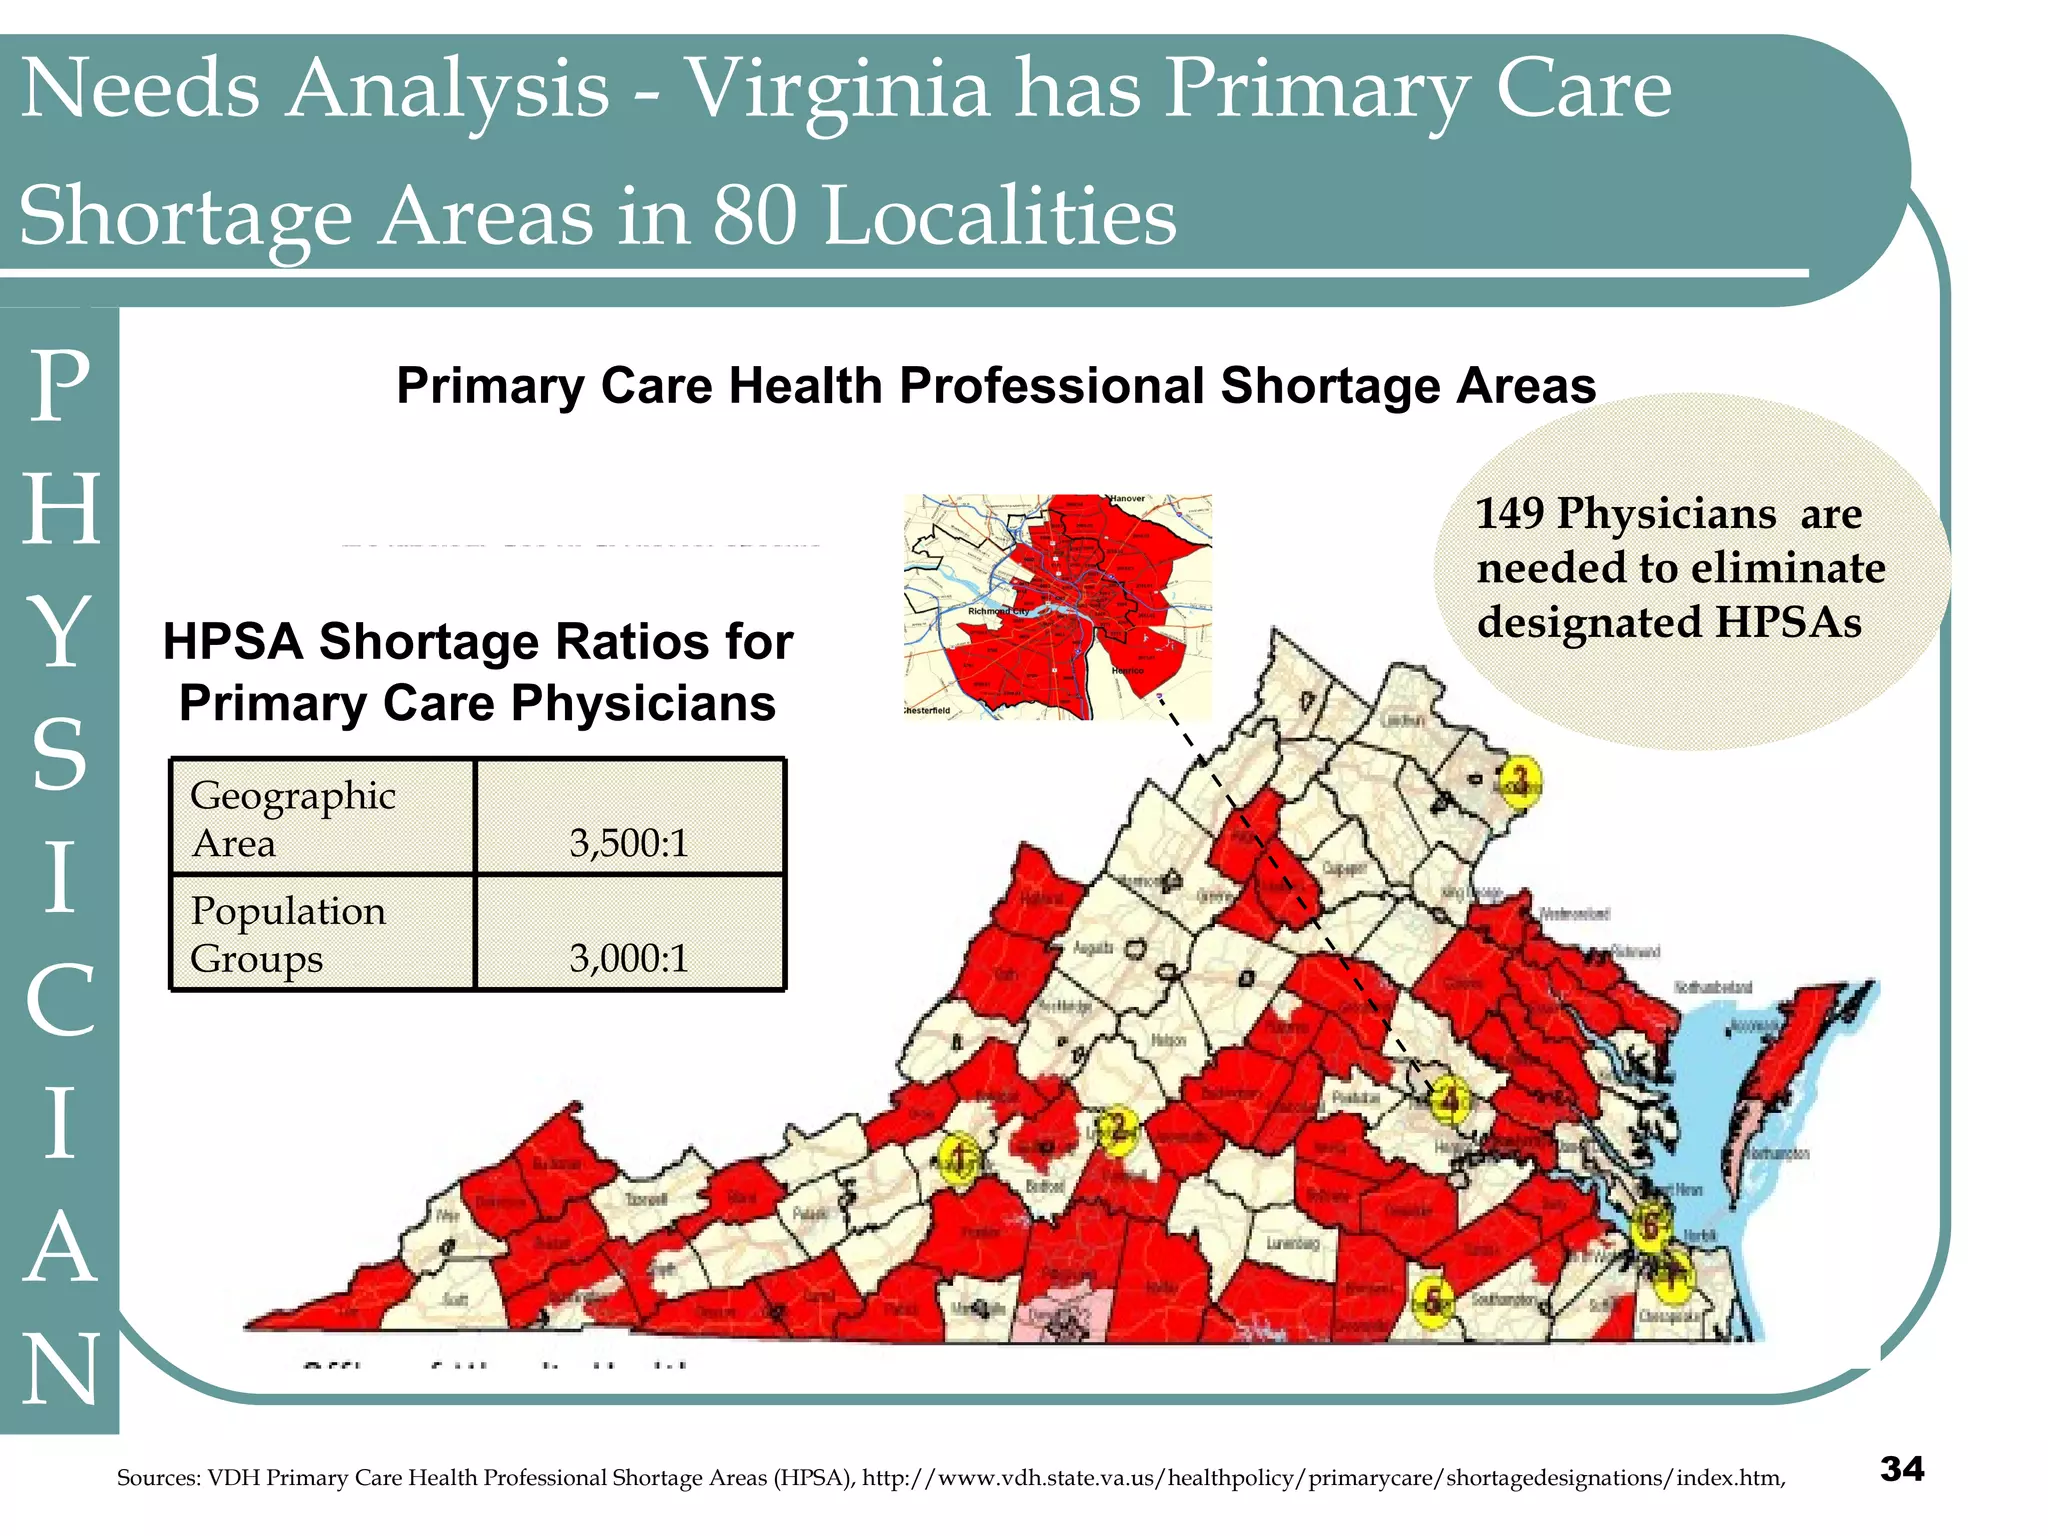
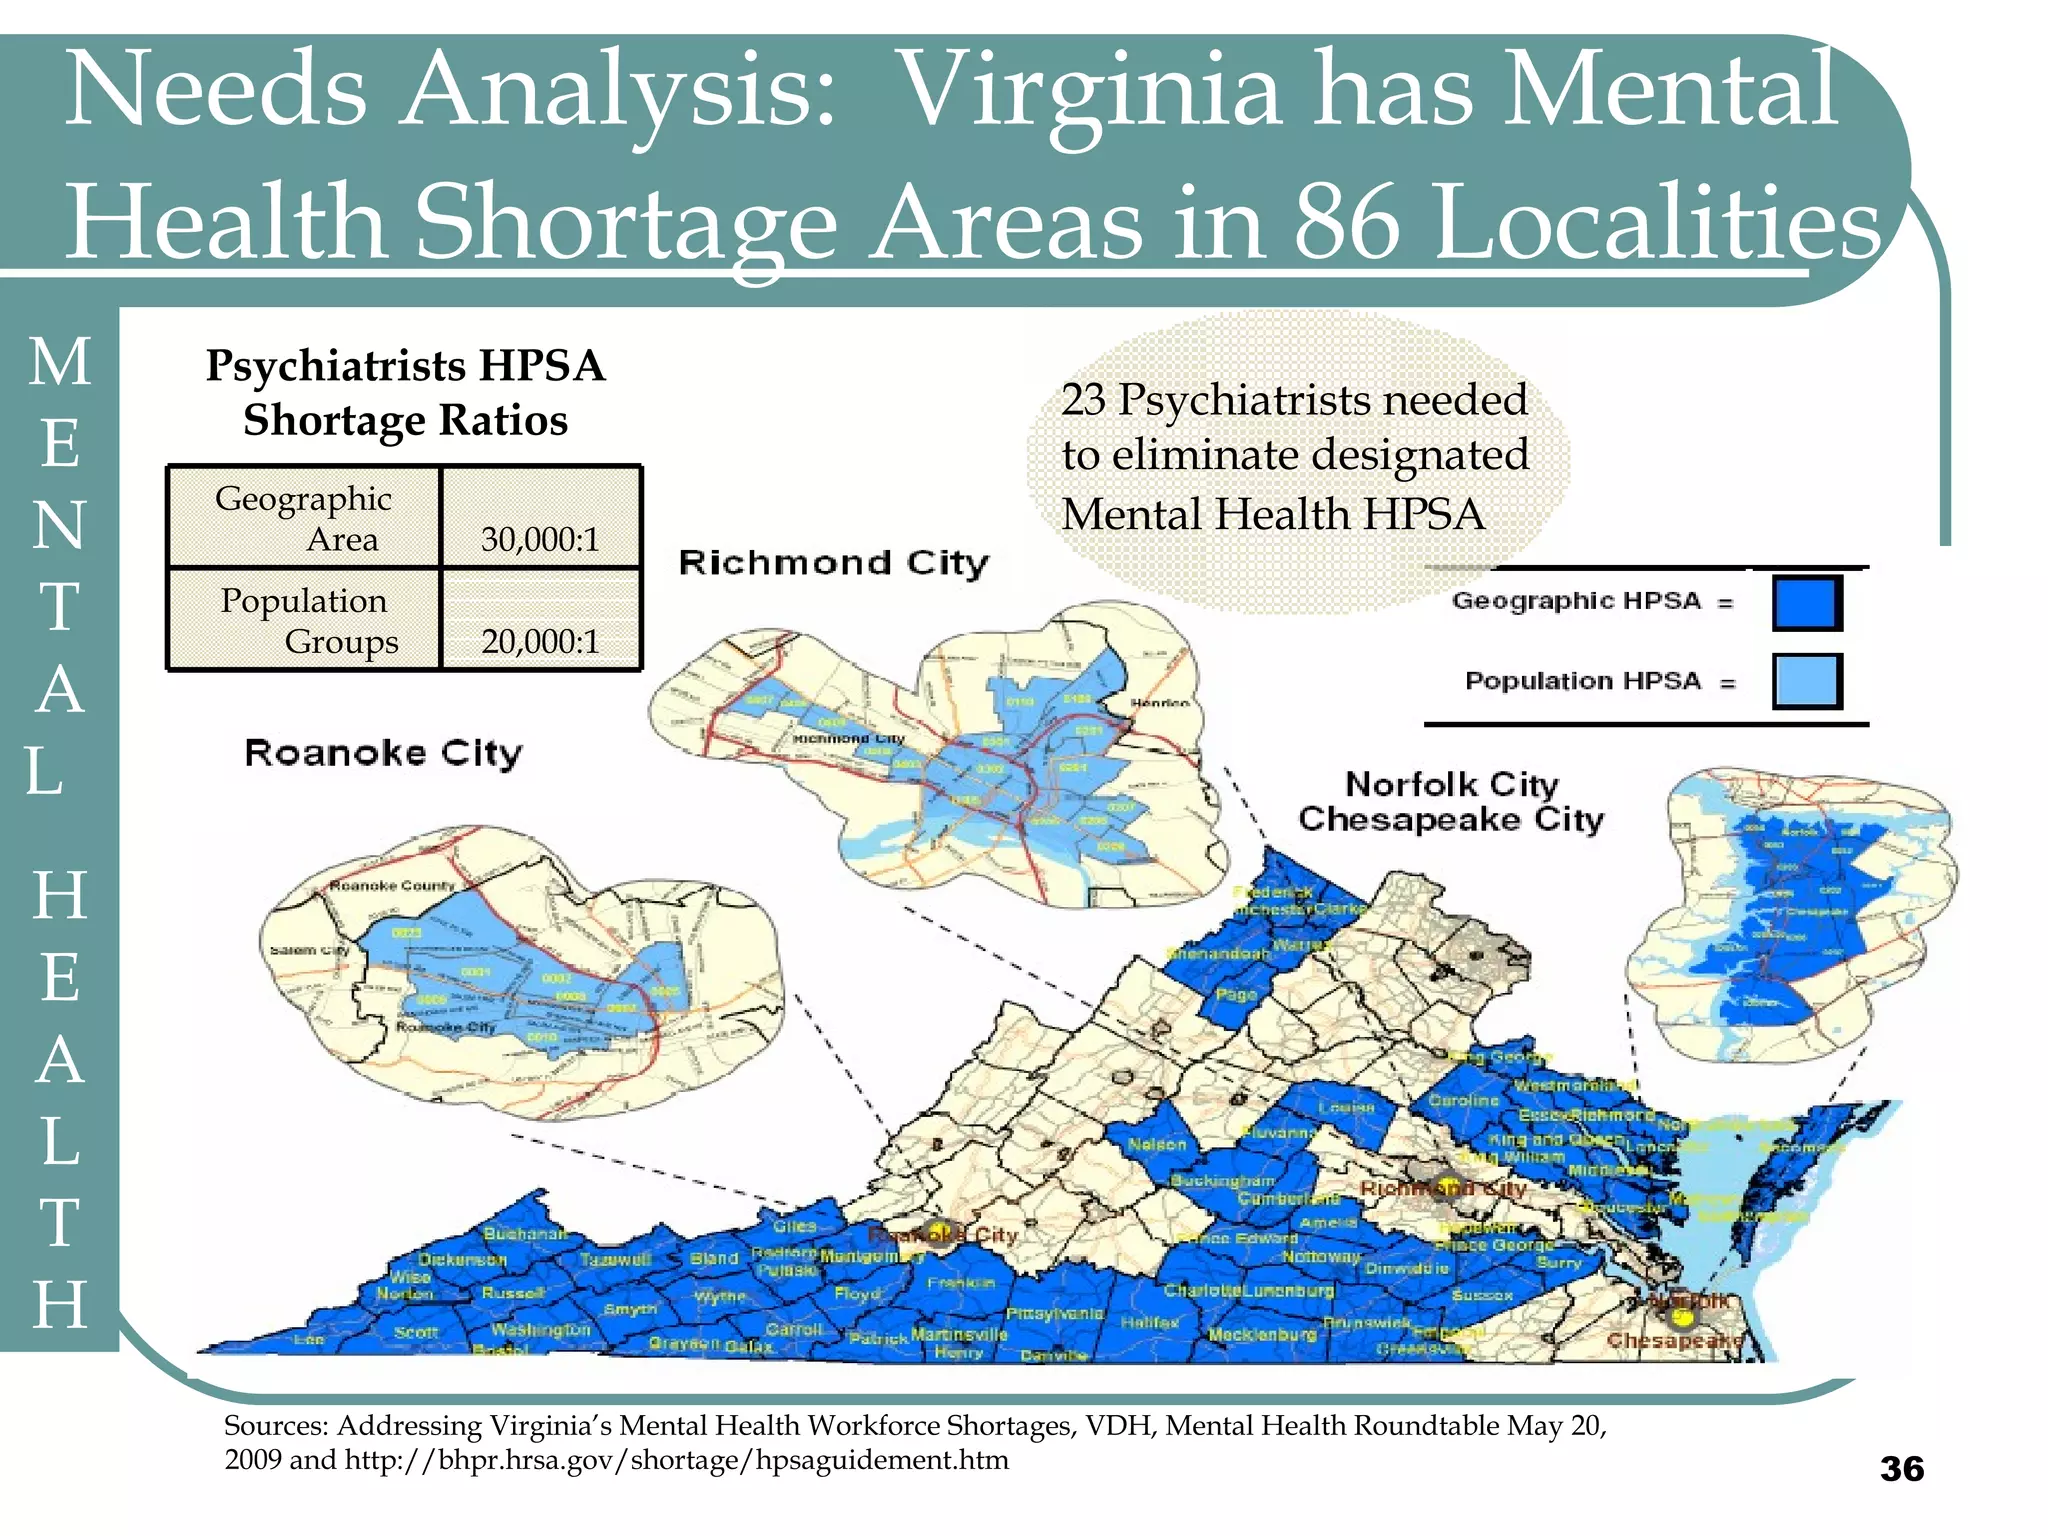
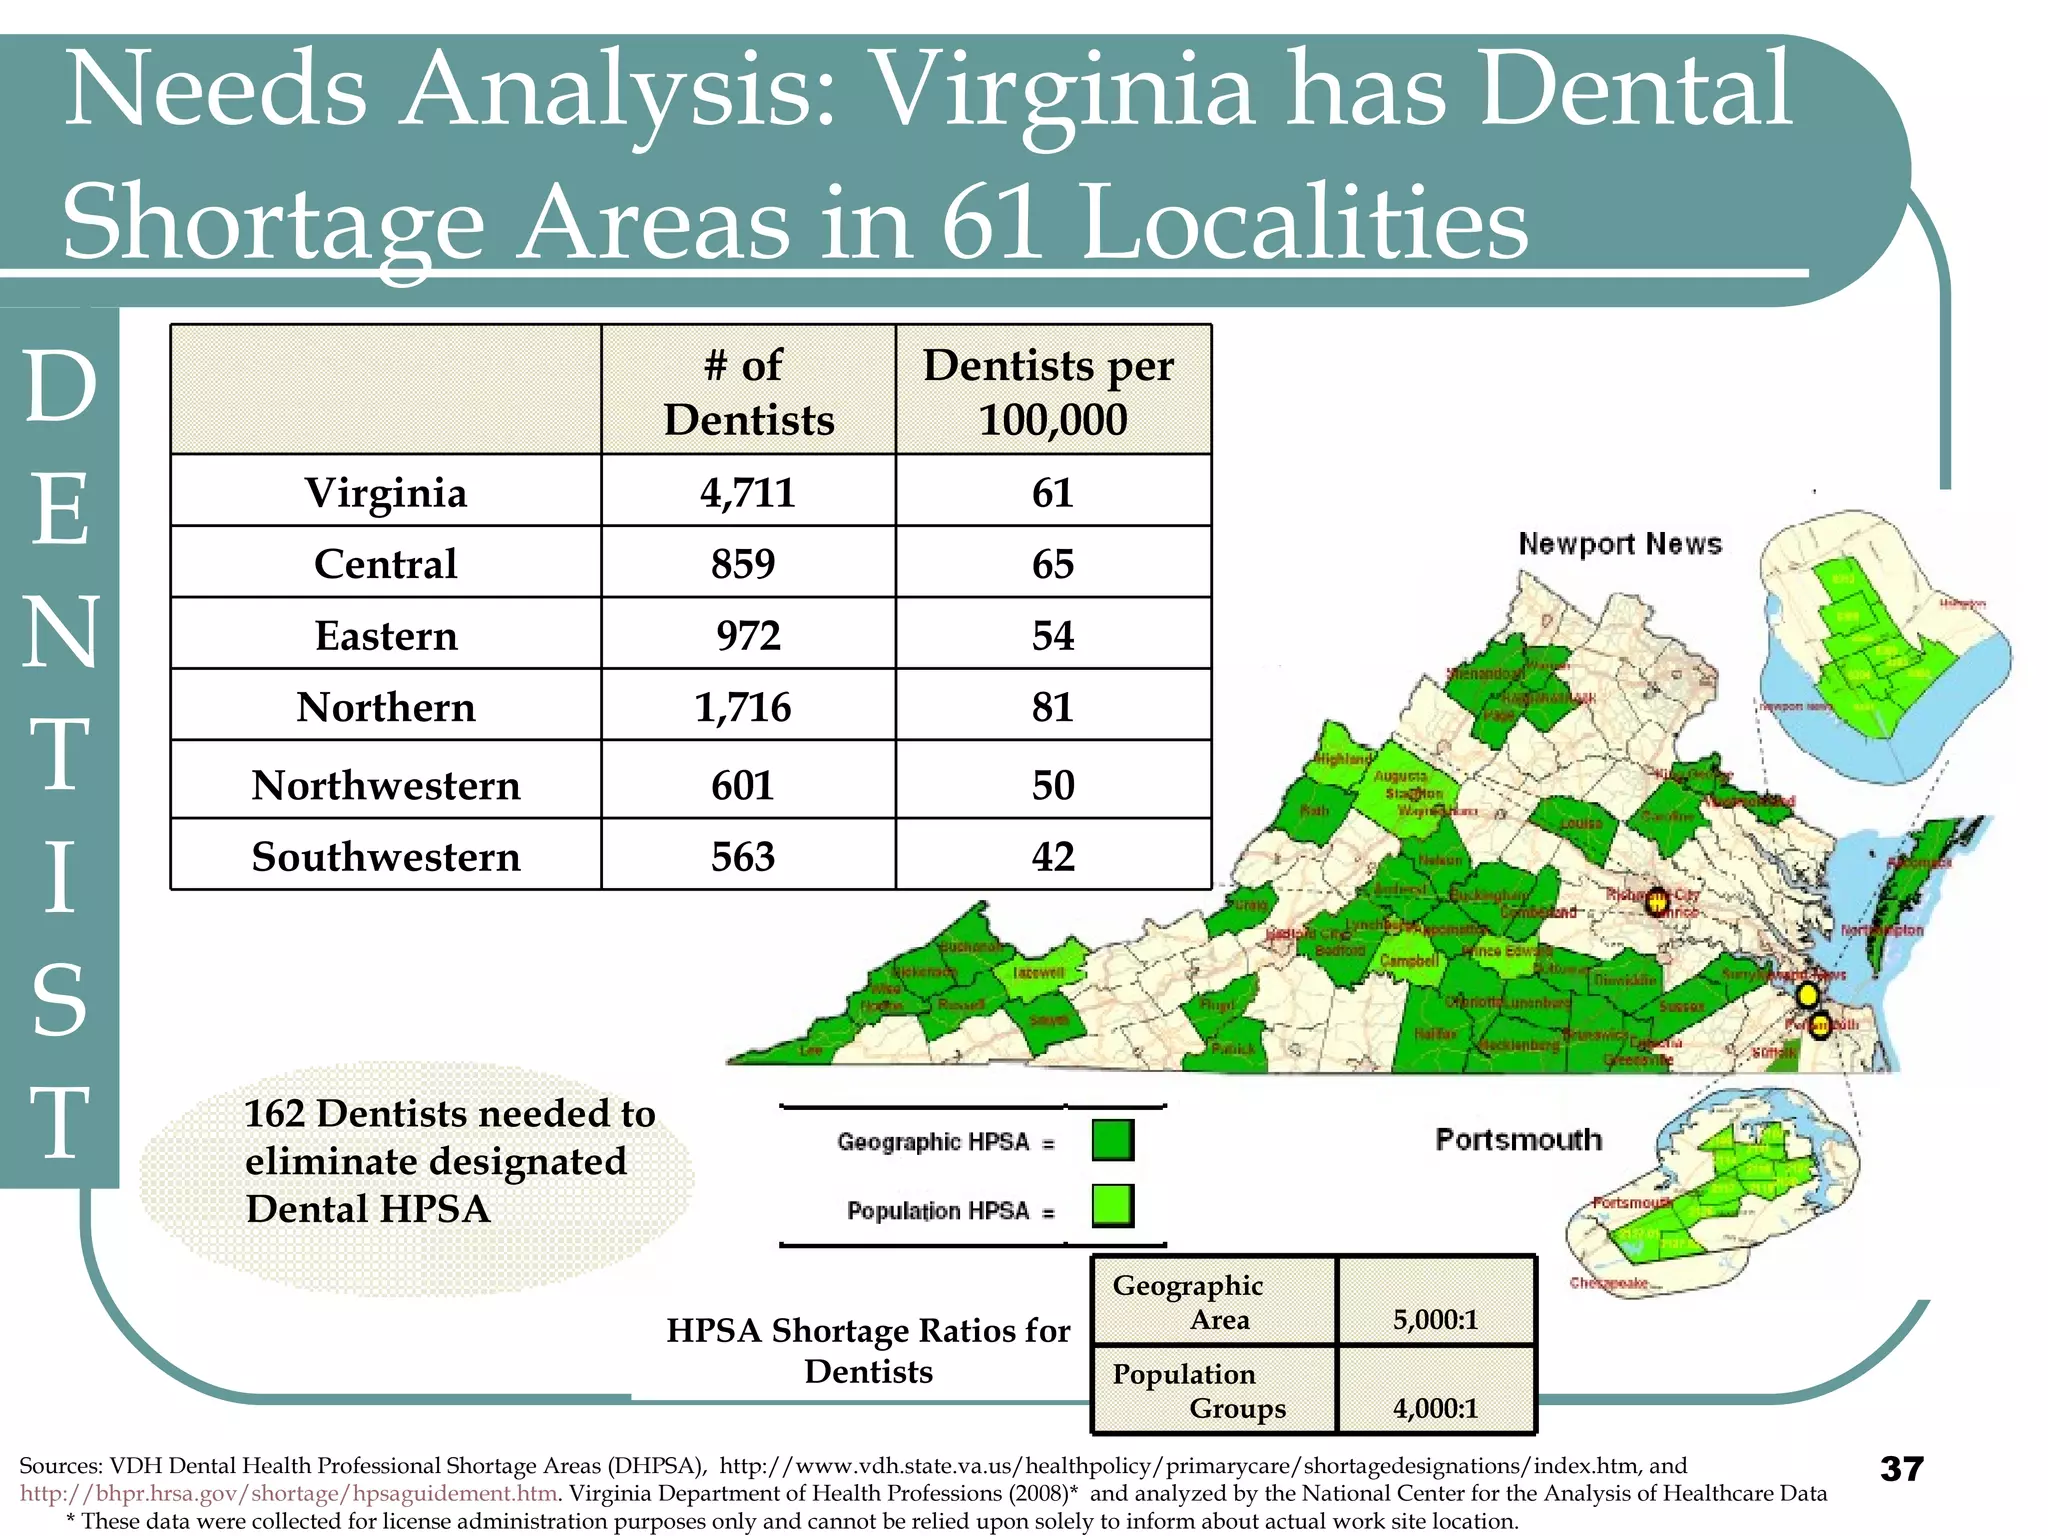
The document summarizes bills passed by the 2010 Virginia General Assembly related to health care, the state budget, and health care workforce needs in Virginia. Key points included the creation of the Virginia Health Workforce Development Authority, requiring insurers to cover telemedicine, prohibiting requirements for individuals to have health insurance, cuts to the state budget including Medicaid rate reductions and closure of mental health units, and shortages of physicians, dentists, and mental health professionals in certain areas of the state.