Download as PDF, PPTX


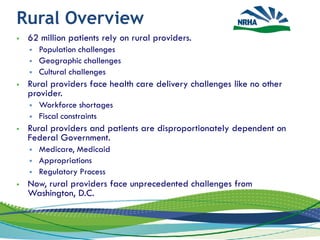
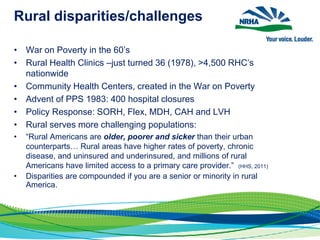


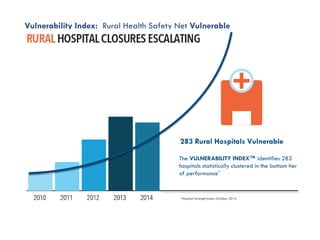
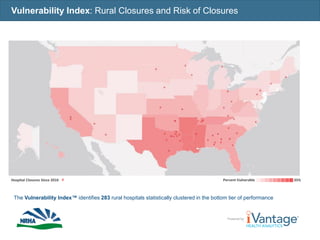


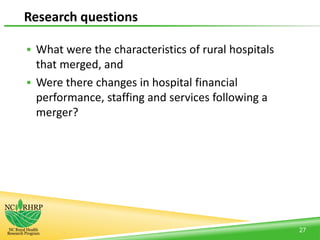


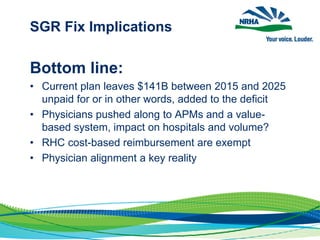


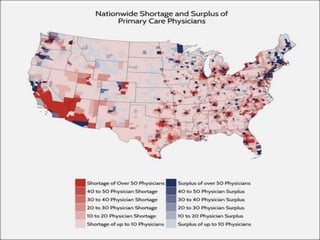


This document discusses challenges facing rural healthcare providers. It notes that 62 million patients rely on rural providers who face unique population, geographic, cultural and healthcare delivery challenges. Rural providers and patients are disproportionately dependent on federal programs like Medicare and Medicaid. Recent federal policies have enacted Medicare cuts that negatively impact rural hospitals. The document examines characteristics of rural hospitals that have closed since 2010 and potential factors contributing to closures. It also reviews characteristics of rural hospitals that have merged with other providers and whether mergers improved financial performance. The document advocates policy solutions to stabilize rural hospitals and ensure their future viability.


![CodeBlue_amended_03_14_071[1]](https://cdn.slidesharecdn.com/ss_thumbnails/b6e2212f-bc15-4d64-885e-c9fdf1da76ba-150325154249-conversion-gate01-thumbnail.jpg?width=640&height=640&fit=bounds)


