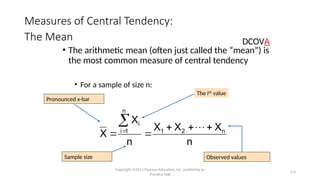
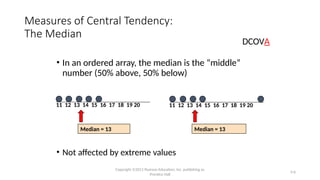
Numerical Descriptive Measures
3-2
Copyright ©2011 Pearson Education, Inc. publishing as
Prentice Hall
In this chapter, you learn:
• To describe the properties of central tendency,
variation, and shape in numerical data
• To calculate descriptive summary measures for a
population
• To construct and interpret a boxplot
• To calculate the covariance and the coefficient of
correlation
Learning Objectives
3-3
Copyright ©2011 Pearson Education, Inc. publishing as
Prentice Hall
Summary Definitions
 The central tendency is the extent to which all the data values group
around a typical or central value.
 The variation is the amount of dispersion or scattering of values
 The shape is the pattern of the distribution of values from the lowest
value to the highest value.
DCOVA
3-4
Copyright ©2011 Pearson Education, Inc. publishing as
Prentice Hall
Measures of Central Tendency:
The Mean
• The arithmetic mean (often just called the “mean”) is
the most common measure of central tendency
• For a sample of size n:
Sample size
n
X
X
X
n
X
X n
2
1
n
1
i
i






 
Observed values
The ith
value
Pronounced x-bar
DCOVA
3-5
Copyright ©2011 Pearson Education, Inc. publishing as
Prentice Hall
Measures of Central Tendency:
The Mean
• The most common measure of central tendency
• Mean = sum of values divided by the number of values
• Affected by extreme values (outliers)
(continued)
11 12 13 14 15 16 17 18 19 20
Mean = 13
11 12 13 14 15 16 17 18 19 20
Mean = 14
3
1
5
65
5
5
1
4
1
3
1
2
1
11





 4
1
5
70
5
20
4
1
3
1
2
1
11






DCOVA
3-6
Copyright ©2011 Pearson Education, Inc. publishing as
Prentice Hall
Measures of Central Tendency:
The Median
• In an ordered array, the median is the “middle”
number (50% above, 50% below)
• Not affected by extreme values
Median = 13 Median = 13
11 12 13 14 15 16 17 18 19 20 11 12 13 14 15 16 17 18 19 20
DCOVA

Numerical Descriptive Measuressssss.pptx

  • 1.
  • 2.
    3-2 Copyright ©2011 PearsonEducation, Inc. publishing as Prentice Hall In this chapter, you learn: • To describe the properties of central tendency, variation, and shape in numerical data • To calculate descriptive summary measures for a population • To construct and interpret a boxplot • To calculate the covariance and the coefficient of correlation Learning Objectives
  • 3.
    3-3 Copyright ©2011 PearsonEducation, Inc. publishing as Prentice Hall Summary Definitions  The central tendency is the extent to which all the data values group around a typical or central value.  The variation is the amount of dispersion or scattering of values  The shape is the pattern of the distribution of values from the lowest value to the highest value. DCOVA
  • 4.
    3-4 Copyright ©2011 PearsonEducation, Inc. publishing as Prentice Hall Measures of Central Tendency: The Mean • The arithmetic mean (often just called the “mean”) is the most common measure of central tendency • For a sample of size n: Sample size n X X X n X X n 2 1 n 1 i i         Observed values The ith value Pronounced x-bar DCOVA
  • 5.
    3-5 Copyright ©2011 PearsonEducation, Inc. publishing as Prentice Hall Measures of Central Tendency: The Mean • The most common measure of central tendency • Mean = sum of values divided by the number of values • Affected by extreme values (outliers) (continued) 11 12 13 14 15 16 17 18 19 20 Mean = 13 11 12 13 14 15 16 17 18 19 20 Mean = 14 3 1 5 65 5 5 1 4 1 3 1 2 1 11       4 1 5 70 5 20 4 1 3 1 2 1 11       DCOVA
  • 6.
    3-6 Copyright ©2011 PearsonEducation, Inc. publishing as Prentice Hall Measures of Central Tendency: The Median • In an ordered array, the median is the “middle” number (50% above, 50% below) • Not affected by extreme values Median = 13 Median = 13 11 12 13 14 15 16 17 18 19 20 11 12 13 14 15 16 17 18 19 20 DCOVA