Download as PDF, PPTX
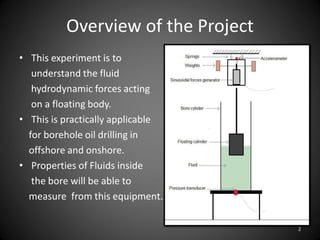
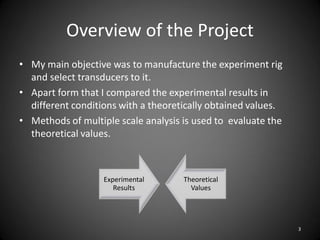
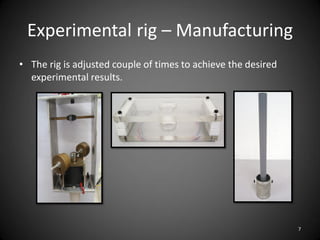

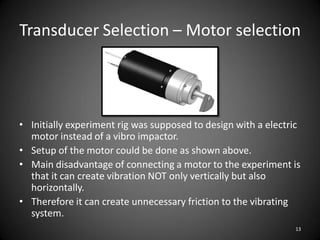
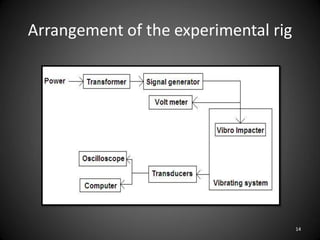
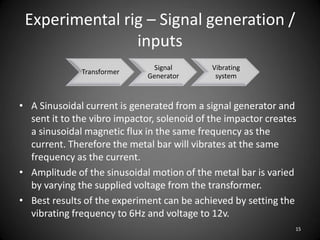
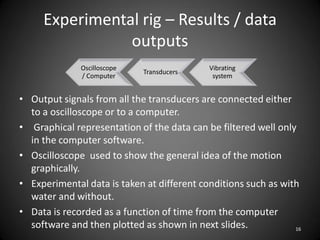

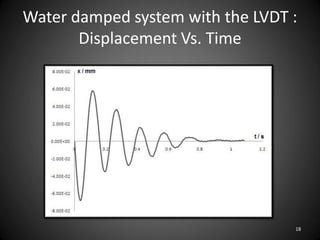
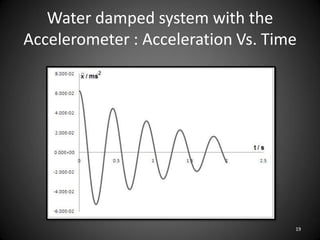
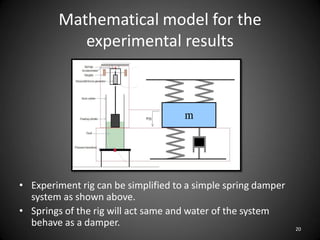
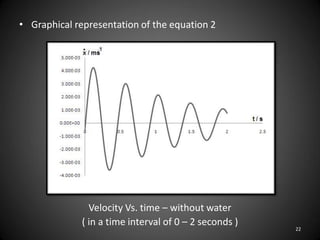
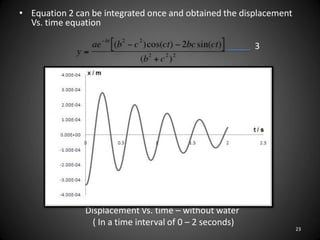
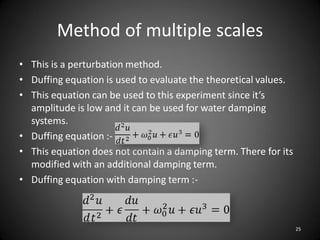
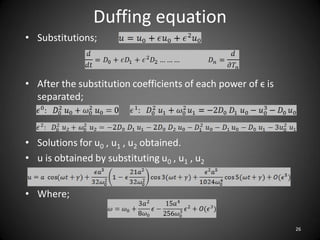
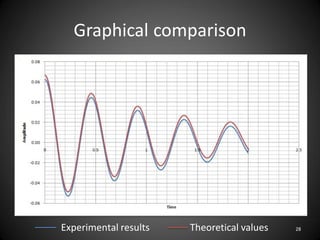


This document describes an experiment to understand hydrodynamic forces on a floating body. The author manufactured an experimental rig and selected transducers to measure displacement, acceleration, pressure, and create vibrations. Tests were conducted with and without water, and results compared to theoretical values using multiple scale analysis and the Duffing equation. The rig design achieved the desired results but could be improved for accuracy and real-world applications.


