This document summarizes several articles from an investment bulletin for endowments and foundations. The first article discusses how Case Western Reserve University addresses challenges in balancing short-term budget needs with long-term investment horizons through strategic and tactical asset allocation. The second article makes the case for tail risk protection based on current market valuations and volatility levels. The third article outlines the University of Chicago's framework for managing endowment risk through a risk-based investment model.
![in thi s i s sue
page one
Bridging Big Gaps with Strategic
and Tactical Allocation
page two
The Case for Tail Risk Protection
page thr e e
A Framework for Endowment
Risk Management
page four
Investment Governance:
Easier Said than Done
page f i v e
Taxes, Liquidity, The Investment
Arms Race, Cost Structures
and the Dependency Ratio:
Surprising Differences between
Endowments and Foundations
page s i x
A Value Approach to Investing
in Biotech
By Sally J. Staley
Chief Investment Officer
Case Western Reserve
University
By Anjum T. Hussain
Director of Risk Management
Case Western Reserve
University
Bridging Big Gaps with Strategic
and Tactical Allocation
Case Western Reserve University
An endowment is a pool of capital with the ultimate luxury
of an investment horizon stretching to perpetuity. Yet the
institution served by the endowment’s distributions pre-pares
its financial plans in much shorter cycles—perhaps
a year or two at a time. And the institution’s fiduciaries
overseeing investment policy and investment results are
accustomed to focusing on portfolio returns over short,
rolling periods—usually of three years.
Suffice to say there is a Big Gap between a year or
two or three and perpetuity. So, how to align investment
policy for perpetual assets with budget planning and in-vestment
reviews occurring with much greater frequency.
There is a similar Big Gap, even an outright conflict,
between common investment policy goals: How to earn
a nominal return that is high enough to support current
spending; protect the erosion of real value from infla-tion;
and, not deliver a major drawdown in a serious
bear market. Meeting these challenges merely stabilizes
the real value of the assets over time. Often, investment
policy calls for more—earning a margin of extra return
that delivers “some to grow on” so the real value of the
assets actually increases into perpetuity.
Case Western Reserve University (CWRU) has ad-dressed
these challenging and sometimes conflicting
objectives with by distinguishing more clearly between
strategic allocation and tactical allocation. Strategic asset
allocation serves the perpetual nature of the assets. Tacti-cal
asset allocation tunes long-term strategy to serve the
much shorter horizon of the annual distribution liabil-ity
and the institution’s risk appetite. Tactical allocation
also disaggregates and expands the traditional high-level
strategic labels of equity, fixed-income, natural resources
and real estate.
Traditional, long-term strategic asset allocation is a
“hope-for-the-best” plan with an overlay of “all things
work out over perpetuity.” Setting shorter-term tacti-cal
allocations alongside strategic allocations is help-ful
in closing the two Big Gaps of time horizons and
investment goals.
The NMS Management
Investment Bulletin for the Endowment
& Foundation Community
December 2014
[Continued on Page 7]
ABOUT NMS
NMS is a membership-based organization serving as the
primary educational resource for the endowment and
foundation community through its high caliber meetings.
Believing that most successful business ventures are built
on trust, and trust can only be developed through rela-tionships,
NMS strives to facilitate relationships through
its membership platform.
As the chief source of unbiased educational forums,
NMS promotes high standards of competence and eth-ics.
As part of its mission, NMS provides its members
with access to leading thinkers in the asset management
industry through its content rich programming in a non-commercial
setting of peers. NMS is the bridge to the
latest investment ideas and information applicable to the
endowment and foundation community.
NMS Management, Inc.
Nancy M. Szigethy
Founder and
Chief Executive Officer](https://image.slidesharecdn.com/bcff697f-1c7a-4388-954e-c8e356391886-141210193213-conversion-gate02/85/NMSExchange_EF2014-1-320.jpg)
![in thi s i s sue
page one
Bridging Big Gaps with Strategic
and Tactical Allocation
page two
The Case for Tail Risk Protection
page thr e e
A Framework for Endowment
Risk Management
page four
Investment Governance:
Easier Said than Done
page f i v e
Taxes, Liquidity, The Investment
Arms Race, Cost Structures
and the Dependency Ratio:
Surprising Differences between
Endowments and Foundations
page s i x
A Value Approach to Investing
in Biotech
By Sally J. Staley
Chief Investment Officer
Case Western Reserve
University
By Anjum T. Hussain
Director of Risk Management
Case Western Reserve
University
Bridging Big Gaps with Strategic
and Tactical Allocation
Case Western Reserve University
An endowment is a pool of capital with the ultimate luxury
of an investment horizon stretching to perpetuity. Yet the
institution served by the endowment’s distributions pre-pares
its financial plans in much shorter cycles—perhaps
a year or two at a time. And the institution’s fiduciaries
overseeing investment policy and investment results are
accustomed to focusing on portfolio returns over short,
rolling periods—usually of three years.
Suffice to say there is a Big Gap between a year or
two or three and perpetuity. So, how to align investment
policy for perpetual assets with budget planning and in-vestment
reviews occurring with much greater frequency.
There is a similar Big Gap, even an outright conflict,
between common investment policy goals: How to earn
a nominal return that is high enough to support current
spending; protect the erosion of real value from infla-tion;
and, not deliver a major drawdown in a serious
bear market. Meeting these challenges merely stabilizes
the real value of the assets over time. Often, investment
policy calls for more—earning a margin of extra return
that delivers “some to grow on” so the real value of the
assets actually increases into perpetuity.
Case Western Reserve University (CWRU) has ad-dressed
these challenging and sometimes conflicting
objectives with by distinguishing more clearly between
strategic allocation and tactical allocation. Strategic asset
allocation serves the perpetual nature of the assets. Tacti-cal
asset allocation tunes long-term strategy to serve the
much shorter horizon of the annual distribution liabil-ity
and the institution’s risk appetite. Tactical allocation
also disaggregates and expands the traditional high-level
strategic labels of equity, fixed-income, natural resources
and real estate.
Traditional, long-term strategic asset allocation is a
“hope-for-the-best” plan with an overlay of “all things
work out over perpetuity.” Setting shorter-term tacti-cal
allocations alongside strategic allocations is help-ful
in closing the two Big Gaps of time horizons and
investment goals.
The NMS Management
Investment Bulletin for the Endowment
& Foundation Community
December 2014
[Continued on Page 7]
ABOUT NMS
NMS is a membership-based organization serving as the
primary educational resource for the endowment and
foundation community through its high caliber meetings.
Believing that most successful business ventures are built
on trust, and trust can only be developed through rela-tionships,
NMS strives to facilitate relationships through
its membership platform.
As the chief source of unbiased educational forums,
NMS promotes high standards of competence and eth-ics.
As part of its mission, NMS provides its members
with access to leading thinkers in the asset management
industry through its content rich programming in a non-commercial
setting of peers. NMS is the bridge to the
latest investment ideas and information applicable to the
endowment and foundation community.
NMS Management, Inc.
Nancy M. Szigethy
Founder and
Chief Executive Officer](https://image.slidesharecdn.com/bcff697f-1c7a-4388-954e-c8e356391886-141210193213-conversion-gate02/75/NMSExchange_EF2014-1-2048.jpg)
![2
The Case for Tail Risk Protection
Ratio fell in the lowest quintile. The highest quintile
of CAPE Ratios, however, saw nearly half of all such
declines. Indeed, the incidence of a tail risk event within
this highest quintile almost equaled the frequency of such
occurrences when the CAPE Ratio was in the 3rd and
4th quintiles combined.
So where are we today? As of September 30, 2014, the
CAPE Ratio stood at 26.4, which ranks in the 94th per-centile
of the 133-year data set—well into the bottom half
of the fifth (i.e., highest valuation) quintile. Objectively
speaking, this makes the current probability of tail risk
protection proving useful quite favorable.
Cost
The simplest and arguably the most common strategy
for hedging tail-risk involves the systematic purchase
of deep out-of-the-money put options on the S&P 500
Index. Options pricing involves complex mathematics
and a sophisticated understanding of a veritable Greek
alphabet soup, but in broad brush terms the cost of buy-ing
an option is proportional to expected volatility. And
over the past 20 years or so, VIX—which stands for the
Chicago Board Options Exchange Market Volatility
Index—has been the most widely used volatility gauge.
The VIX, which trades in both futures and options
markets as well as through various ETFs, relies on current
S&P 500 options pricing to calculate the near-term “implied
volatility” of the stock market benchmark. Over time the
average level of VIX has been 20, which roughly corresponds
to the long-term annualized standard deviation of S&P 500
total returns. The graph on Page 8 (Figure 2), shows the
VIX from its inception through September.
As recently as September 18th, VIX stood at just
12.0—not far off historical lows. A direct consequence
was that on that day tail risk protection was historical-ly
cheap. Four weeks later, on October 15th, the Index
reached an intra-day peak of 31.1, which means the cost
of protection had gone up dramatically. Since that spike,
however, market fears seem to have eased. VIX may or
may not return to extraordinary low levels any time soon,
but there is a point at which the price of put options on
the S&P 500 coupled with relative valuation levels makes
a tail risk protection program extremely attractive.
Potential Impact
Even if the probability and cost factors seem attractive,
an institution’s specific circumstances ultimately will
dictate whether a tail risk protection strategy makes sense.
At its core, managing assets for an endowed institution
entails an inherent tradeoff between the desire to maxi-mize
long-term growth and the need to protect against
extreme short-term losses that could adversely affect the
organization’s mission. Perpetual investment horizons
do not mitigate the reality of needing to meet operating
budget needs on a year-to-year basis.
The value one places on protection against short-term
market downturns depends on
As a business proposition, insurance is relatively straight-forward.
The decision to purchase insurance against a
given event hinges on three factors:
1. Probability of the event occurring
2. Cost of the insurance
3. Potential impact of the event being
insured against
Weighing these considerations leads many Florida
homeowners to buy expensive hurricane insurance, young
and healthy fathers to purchase relatively affordable life
insurance, and most rational travelers to shun cheap offers
of plane crash insurance.
Perpetual investment horizons notwithstanding, many
endowments and foundations would find a compelling
case for adding tail risk protection to their portfolios if
they were to seriously evaluate today’s circumstances in
this three-factor context.
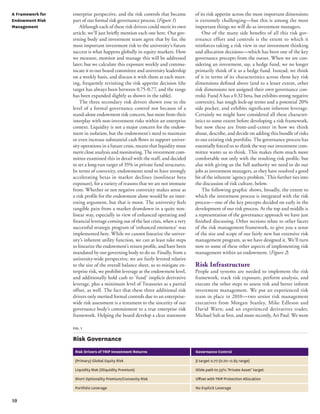
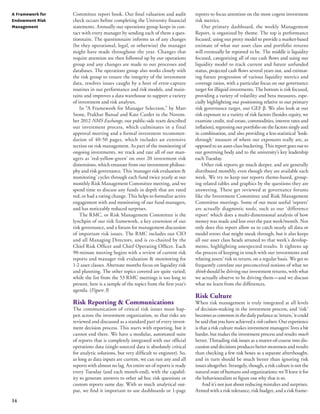
Probability
For the purposes of this discussion, we’re going to define
“tail risk protection” as a strategy designed to partially
offset the impact of a 25% or more drop in the S&P 500
Index over a three-month period. According to the data-base
maintained by Robert J. Shiller, Sterling Professor
of Economics at Yale University (http://aida.econ.yale.
edu/~shiller/data.htm), such a sharp decline has occurred
63 times since 1881. But as shown in the chart below, the
incidence of such market upheavals has been anything but
a “random walk.” (Figure 1)
Shiller pioneered the use of the Cyclically Adjusted
Profit Earnings (“CAPE”) Ratio, which simply divides
the S&P 500 price level by the average of 10-year real
earnings and thus provides a more stable valuation mea-sure
than others driven by shorter-term trends or analyst
forecasts. If we sort historical “tail risk” events based on
the CAPE Ratio that prevailed at the onset, we find a
straightforward monotonic relationship. The stock mar-ket
never once dropped 25% or more when the CAPE
By David Brief
Chief Investment Officer
Jewish Federation of
Metropolitan Chicago
[Continued on Page 7]
fig. 1
Quarterly S&P 500 Returns < -25%
1881–2014
CAPE Ratio Quintile
30
25
20
15
10
5
0
Quintile 1 Quintile 2 Quintile 3 Quintile 4 Quintile 5
# of Quarters](https://image.slidesharecdn.com/bcff697f-1c7a-4388-954e-c8e356391886-141210193213-conversion-gate02/85/NMSExchange_EF2014-2-320.jpg)
![3
A Framework for Endowment
Risk Management
Introduction
In the waning years of the previous decade, before the
onset of the financial crisis, The University of Chicago’s
Investment Committee decided to take a ‘risk view’ of
the endowment and its governance process. The goal
was to have a better understanding of the investment
risks faced by the endowment, within the broader con-text
of the strategic mission and overall risks faced by
the university. Instead of taking a purely traditional
asset class view (e.g., hedge funds, private equity), the
investment portfolio and decisions at the governance
level would be framed in terms of the key risk drivers
affecting risk and return. With a new CIO in place in
2009, the Investment Office transitioned to a risk-based
investment model over the next several years, enhancing
rather than replacing the traditional endowment model,
with a more customized solution.
A risk-based approach is not the subjugation of the
pursuit of investment return to the minimization of risk.
Instead of chasing the highest return at the exclusion of
any consideration of risk, the focus shifts to a conscious
choice of the type and size of risks best suited to our
University’s long-term strategies. Investors may pursue
higher returns, but we don’t have direct control over the
investment outcomes. We can, however, directly choose
the risks that we take in pursuit of those outcomes. Risk
is not only an integral part of the investment process; the
amount and type of risk chosen by managers are the most
critical factors in determining their investment success.
Risk and return are the yin and yang of the financial uni-verse.
And, risk management is not just defensive, but is a
key offensive weapon in the investment manager’s arsenal.
The financial crisis provided a litmus test of the im-portance
of risk management in the long-term outlook
of endowed universities. In the financial crisis, the larg-est
endowments reported FY2009 returns ranging from
-15% to -28%. From peak-to-trough, the typical large
endowment losses were in the mid-30s range, as report-ed.
Given the return lags present in reported returns,
though, these reported returns suppressed the true
economic losses. Including lagged or suppressed losses,
the typical endowment’s economic loss estimate for the
crisis exceeds -40%, with a couple of large endow-ments
estimated at over -50%. These were real losses,
with real impact on universities for a number of years.
This highlights the need for a top-down proscription of
adverse investment impact, which helps inform the over-all
risk framework. At the University of Chicago, our
endowment risk management and investment strategy
are driven by an enterprise view of the entire university,
including the Medical Center.
Endowment Risk Management for
the Enterprise
“A Total Enterprise Approach to Endowment Manage-ment,”
by Mark Schmid and Que Nguyen in the January
2012 NMS Exchange, introduced our integrated approach
to investment strategy. A couple of examples will serve to
illustrate this enterprise view of the endowment within the
context of the university’s overall business and risk profile.
First, suppose the present value of the university’s future
gifts is directly affected by the market return environ-ment
(i.e., gifts have ‘equity beta’). When considering the
amount of overall exposure of the university’s wealth to the
vagaries of the market, it would be wrong to focus on
a partial analysis of the endowment’s equity risk alone—one
must consider the market exposure inherent in gifts as well.
A degree of equity risk that might seem acceptable to
a stand-alone portfolio, may in fact be overly aggressive in an
enterprise context, when considering the additional equity
exposure from the gifts’ value, which is sizable and illiquid.
Second, suppose the university’s debt issuance is sizable
relative to its financial base. This financial leverage could be
compounded, or offset, by the cash, fixed income, or lever-age
within the university endowment. Making a standalone
decision on the endowment’s asset allocation could leave
the university far too levered, or even not levered enough.
An integrated look at the risks across the enterprise should
result in the right amount and right types of risk to support
a university’s long-term needs and risk appetite.
Our own top-down analysis of key risk sensitivities
showed potential tangible adverse impact in the event of:
(1) too much equity risk, (2) too much illiquidity, (3) too
little equity risk, (4) excessive leverage, and (5) nonlinear
pain response to the degree of market decline. Thus, even if
a stand-alone endowment manager were somehow uncon-cerned
with these five parameters, these sensitivities would
have to be considered in the endowment’s asset allocation
and governance, to have any hope of leaving the university
in its comfort zone. These issues should be considered in the
endowment’s risk framework to give the university it serves
the best chance of achieving its strategic goals.
Risk Framework
(Risk Management Process)
Consistent with the TEAM strategy and vision of our
administration and governance body (investment
committee), we have developed a comprehensive, formal
risk management framework at The University of Chicago.
Risk management is not a “one size fits all” solution, but is
customized and essential to the enterprise’s needs and goals.
But every risk management framework should address the
following key factors:
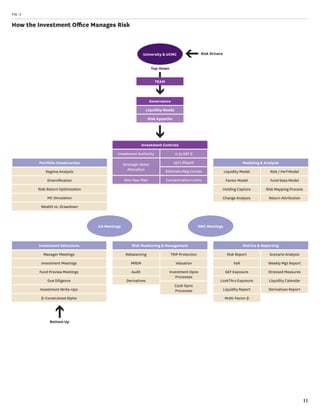
By Mark A. Schmid
Vice President and
Chief Investment Officer
The University of Chicago
[Continued on Page 9]
By Mike Edleson
Chief Risk Officer
The University of Chicago
By Patrick O’Hara
Chief Operating Officer
The University of Chicago
Risk
management is
hard work,
requiring both
deep and
broad expertise.](https://image.slidesharecdn.com/bcff697f-1c7a-4388-954e-c8e356391886-141210193213-conversion-gate02/85/NMSExchange_EF2014-3-320.jpg)
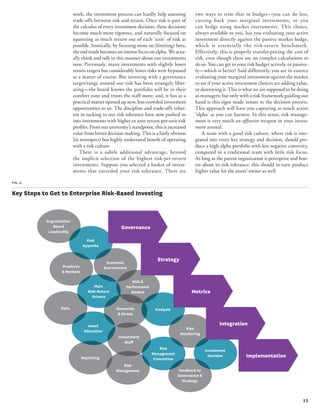
![4
Summary
A surprising disconnect faces institutional asset owners.
Governance best practices are widely published and agreed
upon, yet I hear many of my industry colleagues dissatisfi ed
with their institutions’ governance. Evidently there is some
barrier to executing widely agreed-upon governance ideals.
In this literature review, I draw from roughly 90 books,
articles, and interviews covering both general governance
and investment committees (IC) specifi cally. In each of six
areas, I share the consensus view, and some thoughts on
how to execute it. The six areas are: Role Clarity, Agenda,
IC membership qualifi cations, Role of the chair, IC size,
and Service length. I hope that readers will reach out to me
to share their own thoughts, particularly on why IC best
practices are not more widely adopted.
Introduction
“Good governance is having the right people making the
right decisions about the right issues.”— Myra Drucker
(Griswold 2014)
Boards are sometimes described as a ceiling on quality,
e.g. “A nonprofi t organization, in the long run, is no
better than its board.” (Boardsource 2012) But a more
compelling view is one of opportunity, e.g. “One of the
structural advantages endowments… have is their boards.
Members… have likely attained a measure of success.
They have broad experiences, developed networks, and
a deep and emotional investment in the institution.”
(Roundtable 2014) However, the mere presence of capable
individuals on a board is insuffi cient to produce superior
organizational leadership. The critical additional ingredi-ent
is governance skill, as practiced both by trustees and
senior executives of the institution.
After reviewing roughly 90 sources on governance,
I learned something surprising; the principles expressed
are clear and consistent across sources. Yet after spend-ing
a day speaking with CIOs and senior staffmembers
of large institutions, Cathleen Rittereiser observed that
“Governance turned out to be… the leading component that
both needs fi xing and promises to give investment offi cers
what they most need to succeed.” (Rittereiser 2013) To the
extent that institutions wrestle with governance, the problem
is not a lack of consistent and well-documented best prac-tices.
Instead, the challenge appears to be executing on this
guidance. And this challenge has a real cost; Ambachtsheer,
Capelle and Lum (2008) found “a positive correlation
between governance quality and fund performance.”
To help support greater adoption of investment
governance best practices, I assembled this literature
review. Each section highlights some ideas from my sources
regarding how to execute best practices.
Role Clarity: What is Governance?
Consensus View: Overwhelmingly, sources state the
importance of clear roles for the IC and staff.
Suggestions to execute:
1. Defi ne Governance. I was surprised to learn that
there is no widely shared defi nition of governance.
Among the many thoughtful defi nitions that I found
were these:
“Governance is anything that lasts fi ve years or
more.” — Interviewee
“The management team runs, the board course-corrects,
offers advice and guides. Governance is
setting standards, advising how to live up to them,
and reviewing how well they are lived up to—not
making decisions. A trustee’s job isn’t to make
things exactly as they want it, just not too far off.”
— Interviewee
“Discuss guardrails, not specifi cs of where within
those guardrails to be.” — Interviewee
By David Slifka
Senior Portfolio Manager
YMCA Retirement Fund
With so much
at stake, why
do so many
institutions not
yet execute on
governance best
practices?
[Continued on Page 17]
Investment Governance:
Easier Said than Done
Overview of Sources
My sources include 55 books and articles on invest-ment
governance, roughly a dozen conversations
with individuals experienced with investment and
general governance, and 20 books and articles on
general governance. The sources refl ect a wealth of
knowledge across constituencies: Investment consul-tants
(e.g. Cambridge, Russell, RV Kuhns), Industry
groups (e.g. CFA Institute, Association of Governing
Boards), Asset managers (e.g. Howard Marks, Arnold
Wood), Investment trustees (e.g. Charley Ellis, Myra
Drucker), CIOs (e.g. David Swensen, David Salem),
academics (e.g. Yale and Harvard business schools)
and others with broad perspective (e.g. McKinsey,
Korn/Ferry). Many of the sources are themselves
surveys, making the aggregate data set quite rich.
Sources cover endowments, foundations and pen-sion
funds, mostly but not exclusively in non-profi t
or government contexts. Of the sources that address
general governance, I found their advice equally
applicable to ICs, and their advice regarding chair/
CEO relationships equally applicable to IC-chair/
CIO relationships. The full bibliography is available
upon request; many more contain valuable insights
than could be cited in this document.](https://image.slidesharecdn.com/bcff697f-1c7a-4388-954e-c8e356391886-141210193213-conversion-gate02/85/NMSExchange_EF2014-4-320.jpg)
![5
By Nina Scherago
Managing Partner
Edgehill Endowment
Partners
Taxes, Liquidity, The Investment
Arms Race, Cost Structures and
the Dependency Ratio:
Surprising Differences between
Endowments and Foundations
Endowments and foundations with a perpetual life are
identified as generally having the same investment objec-tive,
which is to generate a real return net of spending in
order to preserve purchasing over multiple generations of
students, faculty or grantees. In practice, different tax and
legal requirements, and circumstances such as a lack of
new gifts, apply to foundations relative to endowments,
which should result in endowments and foundations
having meaningful distinctions in asset allocation.
We also note some differences in culture and
circumstances between foundations and endowments.
For example, foundations tend to be more collegial, while
endowments—and especially the elite institutions—have
created an investments arms race that emanates from direct
competition and a need to meet ever-rising costs of a college
education. Competitiveness among colleges for faculty and
students (and especially football or field hockey players),
plays a role in determining the greater level of resources
that academic institutions dedicate to managing their
investment portfolios relative to foundations.
We think that these circumstances, combined with
the elevated sensitivity to the generous compensation
of investment professionals at foundations, have an
impact on the level of resources that these two groups of
otherwise similar institutions devote to managing their
endowed assets.
We also conclude that the largely variable cost struc-ture
of foundations is more influential on how a founda-tion
manages its investment portfolio than its dependency
ratio of 100%. Conversely, the largely fixed cost structure
of a college is more influential than its dependency ratio,
typically below 50%, on how a college manages its invest-ment
portfolio.
The authors recognize that there will be many excep-tions
to the generalities we describe, and that individual
treatises could be written on each of these topics. The
spirit of this article is to stimulate thinking and discus-sion
within the endowment and foundation communities,
and not to prove without a doubt any of these points,
especially given the many unique circumstances among
institutions represented by our readers.
Foundation Headwind: Taxes
Foundations are subject to Unrelated Business Taxable
Income (UBTI) to a much greater extent than their
academic peers.
Foundations are subject to an annual excise tax of
either 1% or 2% on income and realized gains from
investment returns.
Consequence: Foundations often generate lower after-tax
returns than their endowment brethren on identi-cal
investments in private real estate, and also on private
investments that utilize an LLC structure. In addition,
foundations have wisely shied away from UBTI-gener-ating
investments, which are concentrated in real estate
and other real assets, causing them in aggregate to be less
diversified than colleges and universities.
Federal UBTI is paid at the institution’s corporate rate, and
not the capital gains rate. An increasing number of states,
ravenous for tax revenue, have imposed UBTI requirements
of up to 11%. Many institutions with diversified portfolios
now file state tax returns in a majority of the 50 states. While
institutions typically do not report their investment returns
net of taxes, the direct and indirect burden of taxes on
foundations is costly relative to endowments.
Foundation Headwind:
Greater Liquidity Needs
Mandated Minimum Spending: Private foundations are
required by the IRS to spend 5% of average assets each year
in order to maintain their tax-exempt status, whereas en-dowments
do not have a minimum spending requirement.
Consequence: Foundations do not have the luxury, like
their academic brethren, of spending at a rate lower than
5%, and thus foundations have a lower probability of
maintaining the purchasing power of the corpus. More-over,
foundations are required to spend 5% each year and
may need to over-ride the smoothed spending formula if
it results in persistent under-spending relative to the 5%
IRS-mandated requirement.1
Both endowments and foundations typically utilize a
smoothing function for their spending formula to create
a sustainable flow of funds into their operating budgets or
their programmatic initiatives. Smoothing creates counter-cyclical
spending rates—when asset values are rising,
spending is lower as a percentage of the total market value,
and when asset values are decreasing, spending is higher
as a percentage of the total market value.
Restricted Borrowing Capacity
Foundations engage in very limited borrowing because of
the tax consequences of UBTI.
Consequence: Having little or no borrowing capacity
means that foundations have [Continued on Page 22]
By D. Ellen Shuman
Managing Partner
Edgehill Endowment
Partners
Liquidity is
not the only
headwind faced
by foundations
in their effort to
generate strong
investment
returns.](https://image.slidesharecdn.com/bcff697f-1c7a-4388-954e-c8e356391886-141210193213-conversion-gate02/85/NMSExchange_EF2014-5-320.jpg)
![7
The first consideration was strategic asset alloca-tion.
Here the challenge was to develop a policy port-folio
calibrated to deliver on two of the five objectives
specified in CWRU’s Investment Policy Statement:
1) Produce a return of at least 8% over rolling three-and
five-year periods and 2) Avoid a drawdown of more
than 15%. The first step was to articulate the purpose
of each asset class along with the usual expected returns
and volatility, but also including drawdown and factor
exposures. Public market equivalents were used for private
sectors. The calibration modeling produced appropriate
weights for each asset class and created the strategic asset
allocation or policy portfolio.
What differentiated this from the usual process was
the clear articulation of the role of each asset class along
with the explicit identification and separation of betas to
reduce confusion about risk/return/drawdown profiles.
Hedge funds had always been categorized as an asset class
in CWRU’s portfolio but were assigned the new role of
seeking uncorrelated alternative risk premia with expo-sures
beyond the long/short bond and equity positions.
The asset classes used in the calibration modeling
process were the usual long-only equities, fixed income,
natural resources and real estate. But the traditional macro-level
categories masked the richness of the opportunity
sets they contain. So CWRU also sought to disaggregate
the usual broad universes into smaller components that
might have tactical opportunities. This disaggregation
process is useful at the total portfolio level and within the
marketable asset classes.
With an endowment’s unique access to data from many
brokers, exchanges and research houses, CWRU assembled
a data set of the monthly return histories of 1,400 (and
growing) global style, geographic, sector, rates, spreads
(and more) indexes that are accessible and available for
actual transactions.
At the total portfolio level, CWRU created an additional
“slice” of the asset allocation pie to sit alongside hedge funds
as a risk management tool. This additional asset class has
a return objective of 8%, drawdown objective of less than
10-12%, and volatility of about 6%. The purpose was
to create a single, dynamic “slice” with multi-asset-class
components to behave like an endowment replicator with less
risk. Importantly, the slice also had to complement the hedge
fund allocation as a diversifier. It provided the additional
attractive feature of total liquidity by virtue of its index com-ponents.
This new slice of the total allocation has been in
place for about 20 months and will be reviewed and dissected
after its 24-month anniversary.
Using the same investment goals and calibration pro-cess
as for the strategic policy portfolio, CWRU also has
begun to designate a portion of the global public equity
allocation for investment into liquid and dynamic sub-indexes
that can be combined and transacted into a tacti-cal
component of this major asset class. This dynamic
sleeve fits well alongside the two existing sleeves of
active funds/managers and a traditional passive index
sleeve based on the asset class’ Global ACWI benchmark.
Within the global public equities asset class, the
importance of the dynamic sleeve is to produce alpha
return alongside active funds/managers. The appropri-ate
weightings for the three sleeves—passive, active, and
dynamic—are being further modeled and discussed.
Fundamentally, CWRU has sought changes to the
traditional strategic asset allocation process to introduce
dynamic, tactical ability at the total portfolio level and
within the marketable asset classes beginning with public
equity. The benefits would be greater control of invest-ment
results versus investment objectives, total liquidity,
lower management fees, and the ability to notice and capi-talize
on opportunities around the globe without the long
process of manager due diligence.
The model so far can be characterized as a slow
momentum-based strategy across the various risk premia
of style, geography, region, sector, country, rates, spreads,
duration and carry. It has a wide set of potential port-folio
construction applications for CWRU’s endowment
and could be useful for building a cash management
tool, ESG-compliant portfolio, hedge fund replicator
and more. Most importantly, it has already provided
a new perspective on how to bridge the Big Gaps of
mis-matched time horizons and competing investment
goals that are the fundamental challenges facing endow-ments
and other pools of global, institutional capital.
myriad factors, some quantifiable and others psychological.
The most salient of these are as follows:
◆ Degree of reliance on annual distributions.
A public school that obtains 5% of its revenue
from endowment funds has much less sensitiv-ity
to market declines than does a private school
whose endowment provides 40% of revenues.
Obviously a private foundation that has a budget
supported only by investment-related income is even
more sensitive. Another way to look at this issue is
to think about the magnitude of market decline
that would translate into a 1% hit to the annual
budget. Again, the school with a budget that is 95%
covered by non-endowment sources could afford
a much bigger hit before feeling the pain.
◆ Sensitivity of other income. During a broad
market downturn, other sources of revenue
may be pressured as well. But some will hold up
better than others. For example, schools get
much of their income from tuition and govern-ment
grants. At selective schools, demand for
admissions vastly exceeds the supply of spots and
this demand is relatively price-inelastic. So while
net tuition may decline slightly, due to perhaps
increases in financial aid, there exists a significant
cushion. Many charities, on the other hand, rely
on annual fundraising campaigns for the bulk
of their revenues. A steep market decline makes
donors feel poorer, which leads to fewer of them
writing checks—and those that do often write
smaller checks than they otherwise would have.
Bridging Big Gaps with
Strategic and Tactical
Allocation
[Continued from Page 1]
The Case for Tail
Risk Protection
[Continued from Page 2]](https://image.slidesharecdn.com/bcff697f-1c7a-4388-954e-c8e356391886-141210193213-conversion-gate02/85/NMSExchange_EF2014-7-320.jpg)
![9
A Framework for
Endowment Risk
Management
[Continued from Page 3]
◆ Risk governance
◆ Risk identification and measurement
◆ Risk infrastructure
◆ Defined policies and procedures
◆ Risk monitoring, mitigation and management
◆ Communications (more than just reports)
◆ Strategic analysis and integration
To start building this, initially the critical elements are
governance, strategy, and resources. Knowing how risk
management will fit into the governance structure is a
key starting point. Is there strong sponsorship for risk
management at the committee or CIO level? What ques-tions
is the committee trying to answer, and what are
their key risk concerns? Is there a desire to truly inte-grate
risk into the investment and decision process, or
is it more of a lip service exercise, or ‘checking the box’?
Is the intended outcome just a few reports, or a ‘risk
culture’? Risk management is deeply embedded in the
governance here—our committee was driving this top-down,
and hired a CIO of like mind (Mark Schmid had
previously built comprehensive risk programs at Boeing
and Chrysler).
But while our commitment to risk management is full
immersion, that won’t necessarily be the right answer at
other endowments. You need a strong sense, going in,
of what you want out of your risk program. You should
be open and honest about this, even if the answer is not
politically correct.
Related to governance is the element of strategy.
What are the investment strategy and philosophy, and
how will risk management inform and integrate with
them? At the outset you need to develop some idea of
this, even if the mechanics aren’t worked out. At The
University of Chicago, even before the first risk hire,
it was decided that there would be an enterprise view
of endowment risk, that we would take a ‘risk view’ of
asset allocation, focus our attention on key risk drivers,
and integrate risk management fully into investment
management. After the fact this all seems fairly obvious
to us, but in the initial months much of this seemed
both controversial and unreasonably ambitious.
The other foundation element is resources, and that
can’t be well addressed until the elements of governance
and strategy are worked out. Consistent with the goals
and vision of risk management that you develop, you
will need to commit the people, dollars, systems, and
time to implement that vision. Risk management is
hard work, requiring both deep and broad expertise.
It is not easily done on a shoestring by having ‘everyone’
do a little bit of it, or by expecting the boss to do it in
his or her spare time. The resources can be internal,
outsourced, or a mix of both (an internal risk manager
using a vendor system is quite common)—but a keen
focus and clear responsibilities are needed. Consistent
with our deep dive as determined in the governance
and strategic version of risk, we have invested heavily
with an experienced risk team representing about 10%
of our manpower, and have pursued a fully internal
approach, built mostly from scratch since the new risk
team’s 2010 arrival.
Risk Governance
Governance (the top-level system of structures, rights,
duties, etc.) is a very broad topic, and that is true as it
relates to risk as well. At an informal level, as discussed
above, the key issues surround what the governing body
hopes to get out of risk management, and their key ques-tions
and expectations. This is dynamic and subtle, and
best developed by frequent and open discussion with the
board or committee. At a formal level, risk governance
is about the expectations and concerns of the board, as
formalized in authorities, limits, and other constraints on
risk. Best practice would result in a clear statement of risk
appetite or tolerance from the board, along with high-level
controls consistent with that risk appetite.
What does this mean in concrete terms? You must
tease out, by a variety of methods, what are the key risk
drivers of your investment performance, and what are the
key concerns of your governance body, especially as relates
to risks facing the overall enterprise. Then you have to
figure out what to do about those concerns and drivers.
At The University of Chicago, this meant deep analysis
and frequent discussions with the investment commit-tee—
on top of our four ‘informal’ strategic guidelines
mentioned earlier (enterprise approach, risk view, focus
on drivers, and integrated approach) which were devel-oped
early on. The first step, identifying our primary
risk driver, also led us to how to allocate with a risk view,
formalize a risk appetite, develop primary risk controls
to effect that, and integrated the risk discussion with the
enterprise strategy (TEAM approach).
A variety of statistical analysis showed us that the clear-ly
dominant risk factor in our returns was global equity
market returns—this isn’t surprising, and is probably the
case for most endowments. The investment committee
and staff agreed quite early to use the amount of overall
global equity risk exposure as the basis of our risk view of
the endowment—the ‘language’ we would use to allocate
assets. This board committee then took a detailed look
at the endowment’s contribution to the university’s risk
(and wealth) profile, and developed a clear risk appetite
couched in terms of global equity exposure, in an enter-prise
risk context. This complex governance process was
described in detail in the TEAM article referenced above,
and resulted in a stated risk tolerance with a global equity
factor beta range between 0.70 and 0.80. This range then
became our primary governance control, with a central
target of a 0.75 beta to the global equity factor. So, we
know what our main risk is, and we have determined how
it affects the university as a whole, how much of it our
governing body is willing to take, how to translate this
into numbers, and how to use it to both control and com-municate
our investment allocation and risk, and how to
integrate this into our investment decisions.
While this all was a huge leap forward, the risk gov-ernance,
risk appetite, and key driver risk control work
did not stop there. We continued to analyze and discuss
a variety of risk drivers with our investment committee,
and discovered a few other dimensions in which to nar-row
the stated risk appetite, and develop secondary gover-nance
controls on our investment authority. The following
table outlines the four most important risk drivers from an](https://image.slidesharecdn.com/bcff697f-1c7a-4388-954e-c8e356391886-141210193213-conversion-gate02/85/NMSExchange_EF2014-9-320.jpg)
![17
Investment Governance:
Easier Said than Done
[Continued from Page 4]
“Governance should include the following: Evaluat-ing
the supervisory capabilities of the fund’s inter-nal
management; … Clarifying long-term objectives
and short-term risk tolerance; … Determining the
consistency with which actions fulfill agreed poli-cies;
Asking searching questions about the process
followed by the fund’s operating management and
its investment committee.” (Ellis 2012)
“Governance is about PROCESS: Clear roles &
responsibilities, Efficient decision making, Effective
policies & procedures.” (Turner 2011)
2. Use clear verbs to define roles. Don Ezra
of Russell Investments articulates a widely held
concern; that where staff “recommends” and an IC
“approves” managers, it’s unclear where account-ability
and ownership ultimately lie. He advises
instead to use the verbs “decide” and “oversee,”
which have clearer meanings and therefore clarify
which party (staff or IC), as decider, has account-ability
for results. (Ezra 2010)
3. Decide on a brief description of the IC’s role
and/or name. For example, “[T]he duty of the
IC is to protect the staff, allowing them to exercise
their creative freedom.” (Griswold 2014) Several
institutions have renamed their ICs the “Invest-ment
Policy Committee,” to more clearly describe
the intended role.
4. Ask the IC. “For an IC to decide how it can best
help the institution, members might complete
a survey with questions such as:
◆ What decisions do you think the IC can make
effectively?
◆ What are the really good decisions that one can
make in ~20 hrs/year?
◆ Would you invest with a manager whose decision-making
process flows through a group of part-time
volunteers?” — Interviewee
◆ “What distinguishes effective ICs from… ineffec-tive
ICs?” (Cambridge Associates 2008)
Agenda: What are the key items that
an IC should (and should not) address?
Consensus: “When setting agenda, weight items by im-portance
to future returns” advises Arnold Wood (Wood
2010). “Deciding the wrong issues is the biggest weakness
of most ICs,” says Myra Drucker (Griswold 2014). The
large majority view is that ICs should not approve specific
investment managers, as practiced by roughly two-thirds
of large endowments and foundations (Cambridge Asso-ciates
2014). Don Ezra of Russell Investments describes
ICs not hiring managers as the “commonly accepted”
model across institutions generally (Ezra 2010).
Suggestions to execute: Most sources advise focusing
mostly or entirely on items 1-3 below. Item 4, the process of
manager selection (but not the selection decisions them-selves),
is advised by some sources but with caution. The
remaining items are ideas that struck me as interesting,
but are not consensus positions.
1. Define a set of investment beliefs. Howard
Marks provides his suggested starting point when
asked to advise on governance (abridged for brevity):
“[F]ormulate an explicit investing creed. What do
you believe in? What principles will underpin your
process? The investing team and the people who
review their performance have to be in agreement on
questions like these:
◆ Is the efficient market hypothesis relevant?
Do efficient markets exist? Is it possible to ‘beat
the market’?
◆ Will you emphasize risk control or return maximi-zation
as the primary route to success?
◆ Will you put your faith in macro forecasts?
◆ How do you think about risk? Is it volatility or the
probability of permanent loss? Can it be predicted and
quantified a priori? What’s the best way to manage it?
◆ How reliably do you believe a disciplined process
will produce the desired results?
◆ How will you define success, and what risks will
you take to achieve it? In short, in trying to be
right, are you willing to bear the inescapable risk
of being wrong?” (Marks 2014)
2. Approve an Investment Policy Statement
and oversee its execution. The IC is the body
responsible for defining an institution’s target return
and desired risk parameters. Several strong papers
have been written on IPS best practices, so I won’t
summarize them here.
3. Hire, oversee and support the CIO.
“Keep the CIO or fire him, but don’t do his job for
him. In other words, trustees wield a powerful but
blunt instrument.” — Interviewee
“A great board does not… see its power as consist-ing
mainly of checks and balances on the CEO’s
agenda. Great boards support smart entrepreneur-ial
risk taking with prudent oversight, wise coun-sel,
and encouragement.” (Sonnenfeld, Kusin and
Walton 2013)
“As trustees we are there, it seems to me, to sup-port,
encourage, challenge, stimulate, and help that
professional whom we pick to lead our endeavor. If
every board could see its role as that, I am convinced
we would have far more dynamic institutions, far
stronger professional executives, far more attractive
independent sector careers, far better relationships
between board and management…” (Dayton 2001)
“Competent boards… are prepared to hire a com-petent
Chief Investment Officer and delegate man-agement
and operational authority.” (Ambachtsheer
and Ezra, Pension Fund Excellence 1998)](https://image.slidesharecdn.com/bcff697f-1c7a-4388-954e-c8e356391886-141210193213-conversion-gate02/85/NMSExchange_EF2014-17-320.jpg)
![Investment Governance:
Easier Said than Done
18
“Contrary to conventional wisdom, the foremost
reason that CIOs depart foundations and endow-ments
is not monetary, but a lack of authority
necessary to successfully fulfill their responsibili-ties.
In other words, the CIO’s work is thwarted
by the failure of the IC to delegate sufficient author-ity.
Failure to provide sufficient human and other
resources to the investment office is another
impetus for CIO departure.” (Yoder 2011)
4. Most sources agree that overseeing, at a broad
level, the process of investment manager
selection falls squarely into the IC’s purview.
However, this view is not universal; some sources
caution against the IC brushing up too close to the
manager selection process. David Salem shares a cau-tionary
note that “Manager selection and monitoring
tends to be a preoccupying task for most ICs. As such,
it tends to crowd out truly informed discussion of
evolving opportunities and perils arising from broad
market (i.e., asset class) movements.” (Salem 2001)
5. Plan ahead for challenging market conditions.
“An IC could run a ‘war game’ to prepare itself for
a downturn,” suggested one interviewee. If an
institution does not know whether it would have the
ability and willingness to stay the course through
a market crisis, this might be a fruitful topic for
attention. Implementing a “pre-commitment”
policy (Slifka 2013) may help an IC to make better
decisions under stress.
6. Discuss what it means in practice to have
a long-term orientation.
“Many asset owners will tell you they have a long-term
perspective. Yet rarely does this philosophy
permeate all the way down to individual invest-ment
decisions. To change that, the asset owner’s
board and CEO should start by defining exactly
what they mean by long-term investing and what
practical consequences they intend. The defini-tion
needs to include a multiyear time horizon for
value creation. For example, Berkshire Hathaway
uses the rolling five-year performance of the S&P
500…. Just as important as the time horizon is the
appetite for risk. How much downside potential
can the asset owner tolerate over the entire time
horizon? And how much variation from the bench-mark
is acceptable over shorter periods?” (Barton
and Wiseman 2014)
7. Analyze how agendas are set and how delibera-tions
unfold.
“By design, board meetings are typically more
efficient than effective; typically, they are not
designed to elicit critical thinking on the part of
board members. […] It seems easier, and is far more
customary, to present data and information to board
members at board meetings in the form of reports
and PowerPoint presentations than it is to engage
them in a meaningful dialogue about what the data
means or to attempt to clarify and reconcile issues of
mission and values.” (Trower 2012)
Based on a survey of more than 770 directors from public
and private companies across industries around the world
and from nonprofit organizations, “boards with a moder-ate
impact incorporate trends and respond to changing
conditions. More involved boards analyze what drives
value, debate alternative strategies, and evaluate the
allocation of resources. At the highest level, boards look
inward and aspire to more ‘meta’ practices—deliberating
about their own processes, for example—to remove biases
from decisions.” (Bhagat and Kehoe 2014)
Counterpoint: Why should ICs
approve managers?
The minority opinion was encapsulated by an interviewee
who said, “There are two schools of thought; my think-ing
is less popular. More popular is that ICs shouldn’t
approve individual managers so they can focus on policy.
But I liked the IC approving manager recommendations
because then they can buy into the portfolio. … Espe-cially
when doing things that are contrarian, you know
the IC backed you up on it, that they won’t turn around
and question you later. That helped us take more risk.”
There was a consensus view, from this interviewee and
other sources, that where ICs do approve managers they
should rarely if ever overrule the CIO (see e.g., Kochard
and Rittereiser [2008]).
Who: Selecting the best IC members
Consensus View: This is an area where there’s not a clear
consensus. Most sources believe investment profession-als
make the best IC members, but several argue that an
investment background is not necessary. Both views are
reflected below.
Desirable Professional Backgrounds of IC Members:
A majority of sources cite the importance of includ-ing
investment professionals on an IC; the arguments
for this are numerous and obvious. However, several
sources advanced a variety of more nuanced and even
differing opinions.
View 1 (Majority): IC Members Should be Investment
Professionals
“Skills and habits accumulated in the successful
pursuit of excellence in one craft can be not merely
useless but positively harmful in other pursuits,
including the discharge of duties borne by most
investment committees” (Salem 2012)
“Private equity professionals serve on lots of boards,
which often makes them good board members.”
— Interviewee
Several sources suggested that current or former CIOs
or Deputy CIOs of comparable institutions often make
strong IC members. Such individuals have experience
working with ICs and also understand the daily challeng-](https://image.slidesharecdn.com/bcff697f-1c7a-4388-954e-c8e356391886-141210193213-conversion-gate02/85/NMSExchange_EF2014-18-320.jpg)
![19
es faced by an investment operation. One sees precedent
for this suggestion in the business world, where board
members are often CEOs of other companies.
View 2: IC Members Need Not be Investment Professionals
“In investing, experience is not only the best teach-er;
it’s the only good teacher. ICs need… members
ready and able to make judgments based on the
kind of wisdom that can only come from experi-ence
in investing, so a majority of the members of
each IC should have substantial experience as inves-tors.
A minority of IC members may be chosen for
other reasons…” (Ellis 2013)
“IC members should be selected primarily for
good judgment. While no particular background
qualifies an individual to serve on the committee,
broad understanding of financial markets proves
useful in overseeing the investment process.
Aggregating a collection of investment special-ists
occasionally poses dangers, particularly when
committee members attempt to manage the
portfolio, not the process. Successful executives
bring a valuable perspective to the table provided
they suspend their natural inclination to reward
success and punish failure. The sometimes deep
rooted corporate instinct to pursue winners and
avoid losers pushes portfolios towards fundamen-tally
risky momentum-driven strategies and away
from potentially profitable contrarian opportuni-ties.
The most effective IC members understand
the responsibility to oversee the investment pro-cess
and to provide support for the investment
staff, while avoiding actual management of the
portfolio.” (Swensen 2009)
“[I]t is not necessary to populate the commit-tee
solely with investment professionals; indeed,
doing so may lead to deleterious group-think.”
(Cambridge Associates 2008)
Desirable Personal Characteristics of IC Members:
“The secret message in selecting IC members is
twofold—plays well with others and really under-stands
what investing is all about. They should’ve
read and understood David Swensen’s book.”
— Charley Ellis (Griswold 2014)
“Regardless of their backgrounds, however, the
best investment committee members are… good
at identifying the right questions to ask, and
accustomed to making decisions. […] The invest-ment
world is different from most other worlds: in
other professions, doing more of what has worked
is usually the route to success—in other words,
past performance is generally predictive of future
success because the information necessary to make
successful decisions is readily available to those
trained in that profession. In certain key respects,
however, this is simply not the case in the invest-ment
world—certainly not over a time horizon of a
few years…” (Cambridge Associates 2008)
“Two character traits that should be sought after in
all prospective IC members are a sense of humility
and patience.” (Yoder 2011)
Note on Committee Structure: Cambridge Associates
(2014) found that roughly half of ICs included at least
one non-voting or advisory member. This practice was
anecdotally judged even more common, and very helpful,
by several interviewees. Numerous sources stated that ad-visory
members can be a way of adding otherwise inacces-sible
talent to an IC. Also, advisory members can provide
a “farm team” for future additions to the IC or board.
Investment Committee Chair:
What should he/she do?
Consensus View: Sources identify the IC chair (and
the chair/CIO relationship) as critical to success, but
concretely defining the ideal role for the chair and how
to build the CIO relationship is less broadly discussed.
Many sources lay out important but obvious roles for the
chair such as collaborating to shape meeting agendas and
keeping discussions on track; I include below some non-obvious
(and hence arguable), but interesting and con-crete
formulations of the chairperson’s role. (Recall that I
draw from general governance literature, which refers to a
CEO; I find these sentiments equally applicable to CIOs.)
Suggestions to execute: The most compelling one-sentence
description of a chair’s role was provided by an
interviewee who stated, “The chair should be a consensus
builder on behalf of a shared vision between himself and
the CEO/CIO.” This view is echoed by a corporate chair-person
interviewed by Walton (2011), who said, “I don’t
see how you could have a Chair and CEO who had two
different and separate ideas for the company. That com-pany
would be strategically rudderless. This alignment is
very important—if the Chair and the CEO don’t agree on
some big strategic issues and choices, you’ll waste a lot of
time.” (Walton 2011)
Several CIOs and other sources indicated that IC and
other internal relationships can absorb half of a CIO’s
time. An IC chair can help the CIO spend more time on
investing, by being a conduit for information, questions
and concerns between the CIO and IC members. This
may include, for example, pre-discussing agenda items
and gathering feedback. While several CIOs noted the
importance of direct relationships with IC members, they
were also keenly aware of the need to balance this with the
time required to maintain those relationships.
Some other thoughts on the role of the chair, and the
ideal CIO/chair relationship, included:
“The chair must have an exceeding need to be
silent and to facilitate the success of others.
A servant leader is the perfect IC chair. A good
chair will spend quality one-on-one time with each
member.” — Charley Ellis (Griswold 2014)](https://image.slidesharecdn.com/bcff697f-1c7a-4388-954e-c8e356391886-141210193213-conversion-gate02/85/NMSExchange_EF2014-19-320.jpg)
![20
“A chair’s effectiveness can be defined by three
characteristics: focus, diplomacy, and communi-cation.
An effective chair focuses on probabilistic
consequences (i.e., what is deemed more or less
important).” (Wood 2006)
“I believe the IC chair should be a silent but strong
presence… herding all the stray cats into a good con-sensus
decision.” — Myra Drucker (Griswold 2014)
“The Board Chair is the ‘voice’ of the Board of
Directors to the Chief Executive Officer. … [He
or she] helps the CEO effectively respond to Board
concerns by informally canvassing Board members
prior to formal meetings [and] is the chief advocate
for continuous quality improvement at the Board
of Director level.” (Board Options n.d.)
“I submit that the most crucial relationship in the
entire enterprise is that between the CEO and the
chair. In my view it will be a far better relation-ship
if both clearly recognize that the CEO, not the
chair, is indeed the CEO. Then the chair becomes
the CEO’s partner in making a great board, in
enhancing its ability to carry out all of its responsi-bilities,
and in encouraging it to support the CEO
in every reasonable way.” (Dayton 2001)
In a survey performed on behalf of the Yale School of
Management’s Millstein Center for Corporate Gover-nance
and Performance, Elise Walton found that CEOs
most valued two qualities in a chair: being a good listener
and credibility. “Listening skill… included the ability to
get at the speaker’s underlying thoughts, concerns, and
meaning. Thus, the tag ‘good listener’ often reflected
broader qualities like good thinker, good question-asker,
and good investigator. … Chairs that can listen to, syn-thesize,
and prioritize issues on the mind of the directors
can facilitate board decision making, flag issues and gen-erally
make the CEO’s job easier.” Credibility referred to
prior CEO experience and/or “a track record of having
dealt with challenging situations well.” Walton also notes
that most chairs and CEOs communicate approximately
weekly, and that “the communication should be ‘open.’
The term open was used to express qualities of commu-nication
like direct, unrestrained, informal—the sense
that either party can and will say what is on their mind.”
(Walton 2011)
Size: How big is the ideal IC?
Consensus View: With great consistency, sources place
the ideal investment committee size at five to eight
members; none suggest more than eight as ideal. Com-mon
practice is slightly larger, between eight and ten,
according to a Cambridge Associates (2014).
How to Execute: It’s difficult to offer guidance as this
will be unique to any given institution. For example, the
size might be inflated due to the presence of constituencies
such as union representatives or large donors. One approach
would be to ask if there is any group of five people in whom
the institution would place its trust. As David Salem says,
“Governing boards unwilling to cede responsibility for
investment policy formulation to ICs comprising five or fewer
persons should redouble their efforts to recruit the individuals
in whom they would indeed be willing to repose such trust.”
— David Salem (Salem 2001)
Service Terms: How long is too long?
Consensus View: Two or three terms of three or four
years each (i.e. 6-12 years), with members who are not
productive or helpful eased out at term-ends. Because
the composition of the IC is crucial, terms are a valu-able
tool to make every seat count. “Tenure on best-practices
committees should average six to eight years;
for all sorts of working groups, this proves to be optimal.”
— (Ellis 2013)
How to execute: As with IC size, this will be idiosyn-cratic
by institution.
Conclusion
Discussing governance can be difficult, but as one inter-viewee
says, “it’s necessary because there is no ‘governance
fairy’ who will come and improve these issues.” Such dis-cussions
are important because ICs can be a source of
great strength to an institution. As Charley Ellis writes,
“The best committees help bring stabilizing, rational
consistency to the emotionally draining work of manag-ing
long-term investments in volatile markets and stay-ing
with chosen policies through periods of turbulence”
(Ellis 2012) This can help avoid “the chief hazard for truly
long-term investors [which] is bailing out of inherently
sound policies and practices at highly inopportune times,”
in David Salem’s description (Salem 2012).
With so much at stake, why do so many institutions
not yet execute on governance best practices? This ques-tion
is not yet robustly answered. I ask that you please
reach out to me to share your own thoughts and stories to
help me develop these ideas further.
“Impacting governance is the biggest legacy that a board
member or CIO can have,” said one interviewee. I hope that
this overview enhances your ability to create that legacy.
I am very grateful to the many people who have
discussed this topic with me, and also to the authors of
the many excellent works on this topic, who have taken
the time to share their wisdom with the community.
Works Cited
◆ Ambachtsheer, Keith, and Don Ezra. Pension Fund
Excellence. John Wiley & Sons, 1998.
◆ Ambachtsheer, Keith, Ronald Capelle, and
Hubert Lum. “The Pension Governance Deficit: Still
With Us.” Rotman International Journal of Pension
Management, 2008: 14-21.
◆ Barton, Dominic, and Mark Wiseman. “Focus-ing
Capital on the Long Term.” Harvard Business
Review, February 2014: 48-55.
◆ Bhagat, Chinta, and Conor Kehoe. “High Perform-ing
Boards: What’s on Their Agenda?” McKinsey
Quarterly, April 2014.
Investment Governance:
Easier Said than Done](https://image.slidesharecdn.com/bcff697f-1c7a-4388-954e-c8e356391886-141210193213-conversion-gate02/85/NMSExchange_EF2014-20-320.jpg)
![22
greater liquidity needs than endowments. Therefore
they must retain greater levels of cash and liquid fixed
income securities in their portfolio, or hold fewer illiq-uid
investments, which reduces expected returns over a
market cycle.
Borrowing was a strategic tool utilized by many of the
larger endowments during the financial crisis, which
allowed them to fund the endowment draw without
selling depreciated assets. Most foundations did not have
this option.
Many private foundations do not
receive new gifts
Colleges and universities receive gifts from their alumni
and other donors. Private foundations do not have con-stituents,
including alumni, to make new gifts.
Consequence: Foundations must fund the full endow-ment
draw from the portfolio without the benefits of gifts.
Many academic institutions receive gifts of 2% to 3% of
annual spending, an amount that represents a significant
portion of an endowment’s annual spending requirement.
For all the reasons listed above, foundations have greater
liquidity needs than their endowment colleagues and
therefore must have more liquid, and fewer illiquid,
investments, including more cash and other fixed income
investments. These provide liquidity and diversification
benefits, but have a low expected return that reduces the
probability of an institution meeting its financial objec-tives
of a 5% real rate of return.
Liquidity is not the only headwind faced by founda-tions
in their effort to generate strong investment returns.
We’ve observed through the years that colleges and uni-versities
in general devote greater resources to the invest-ment
function than foundations of similar size. Fewer
resources creates another headwind for foundations.
Hypothesis: Lack of competition among foundations,
and a variable cost structure, may explain why founda-tions
typically have fewer dedicated investment resources,
dollar for dollar, relative to endowments.
The Investment Arms Race
Foundations do not have the historic rivalries and direct
competitiveness that many colleges and universities do.
The Harvard/Yale rivalry extends far beyond the football
field. Their investment results are compared in excruciat-ing
detail each year, while the relative results of the Ford
and Mellon Foundations do not receive the slightest bit
of attention.
The desire among the large endowments to achieve
investment returns that are superior to their competition
motivates them to hire and retain talented investment
professionals, typically in strong numbers. The direct
emphasis on generating returns that out-perform peers
among the foundation world just doesn’t receive much
attention; moreover foundations do not have students and
alumni to carry on traditional rivalries. Therefore, foun-dations
lack the motivation that endowments have to hire
investment staff to beat the competition.
Taxes, Liquidity,
The Investment Arms
Race, Cost Structures
and the Dependency
Ratio: Surprising
Differences between
Endowments and
Foundations
[Continued from Page 5]
Variable Cost Structure of Foundations;
Fixed Cost Structure of Academic
Endowments
The 5% mandated spending rate introduces what is
perceived to be an inflexible hurdle into a private founda-tion’s
portfolio. But this is a misleading concept because
foundations must spend 5% of what they have, so a foun-dation’s
spending will fluctuate as their portfolio value
rises and falls with the market. In reality, foundations have
much more spending flexibility than academic institutions
which require stability and sustainability of spending.
Foundations have a largely variable cost structure,
typically with under 25% of the annual budget devoted
to the fixed costs of administration and overhead, with
75% or more of the budget going to the variable costs of
grants. Colleges and universities on the other hand have
a fixed cost structure of almost 100% because of tenured
faculty, financial aid needs, and the maintenance of a
historic physical campus, among others. One now-retired
college president commented that at colleges, “fixed costs
are fixed, and variable costs are fixed.”
While foundations do not want to cut spending,
grants—a variable cost—can be reduced if necessary,
especially over the medium term. In contrast, the fixed
cost structure of colleges and universities make these
institutions highly reliant on sustainable support for
the operating budget from the endowment draw. It is
logical that an academic institution with a fixed cost
structure and ever-rising cost pressures will channel
more resources into generating investment returns.
In addition, the emphasis on consistency of support
to the operating budget in academic institutions spurs
their relatively greater interest in building meaningfully
diversified portfolios that can perform tolerably well
in most environments. Because of their variable cost
structure, foundations do not share the same intense
spending pressure as an endowment.
Fallacy of the Dependency Ratio
Foundations rely on investment returns to support 100%
of operating revenues, while the wealthiest colleges and
universities depend upon the endowment draw to fund
approximately 50% of the annual operating budget.
Conventional wisdom would conclude that foundations
should therefore be more risk averse than their endowment
peers because of complete reliance on spending. However
the variable cost structure of foundations turns this argu-ment
on its head—foundations can tolerate fluctuations
in spending much more easily2 than a college endow-ment.
The fixed cost structure combined with rising cost
pressures makes a college much more dependent upon
its endowment draw, despite the lower dependency ratio.
Sensitivity to Compensation of
Investment Professionals at Colleges
and Foundations
College campuses are beautiful places. Old buildings are
set around a beautiful quad; students live in old and new
dorms; the athletic fields are brimming with activity, and
music, dance and art programs thrive. There are hundreds
of personnel on a college campus from the President to](https://image.slidesharecdn.com/bcff697f-1c7a-4388-954e-c8e356391886-141210193213-conversion-gate02/85/NMSExchange_EF2014-22-320.jpg)
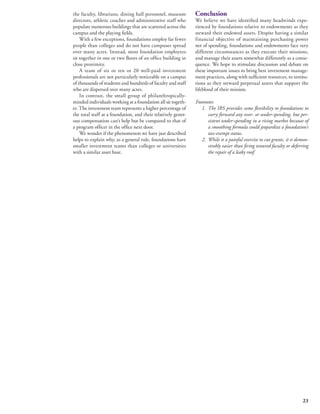


![Ssrn id1862355[1]](https://cdn.slidesharecdn.com/ss_thumbnails/ssrn-id18623551-110621195617-phpapp02-thumbnail.jpg?width=640&height=640&fit=bounds)

