Download to read offline

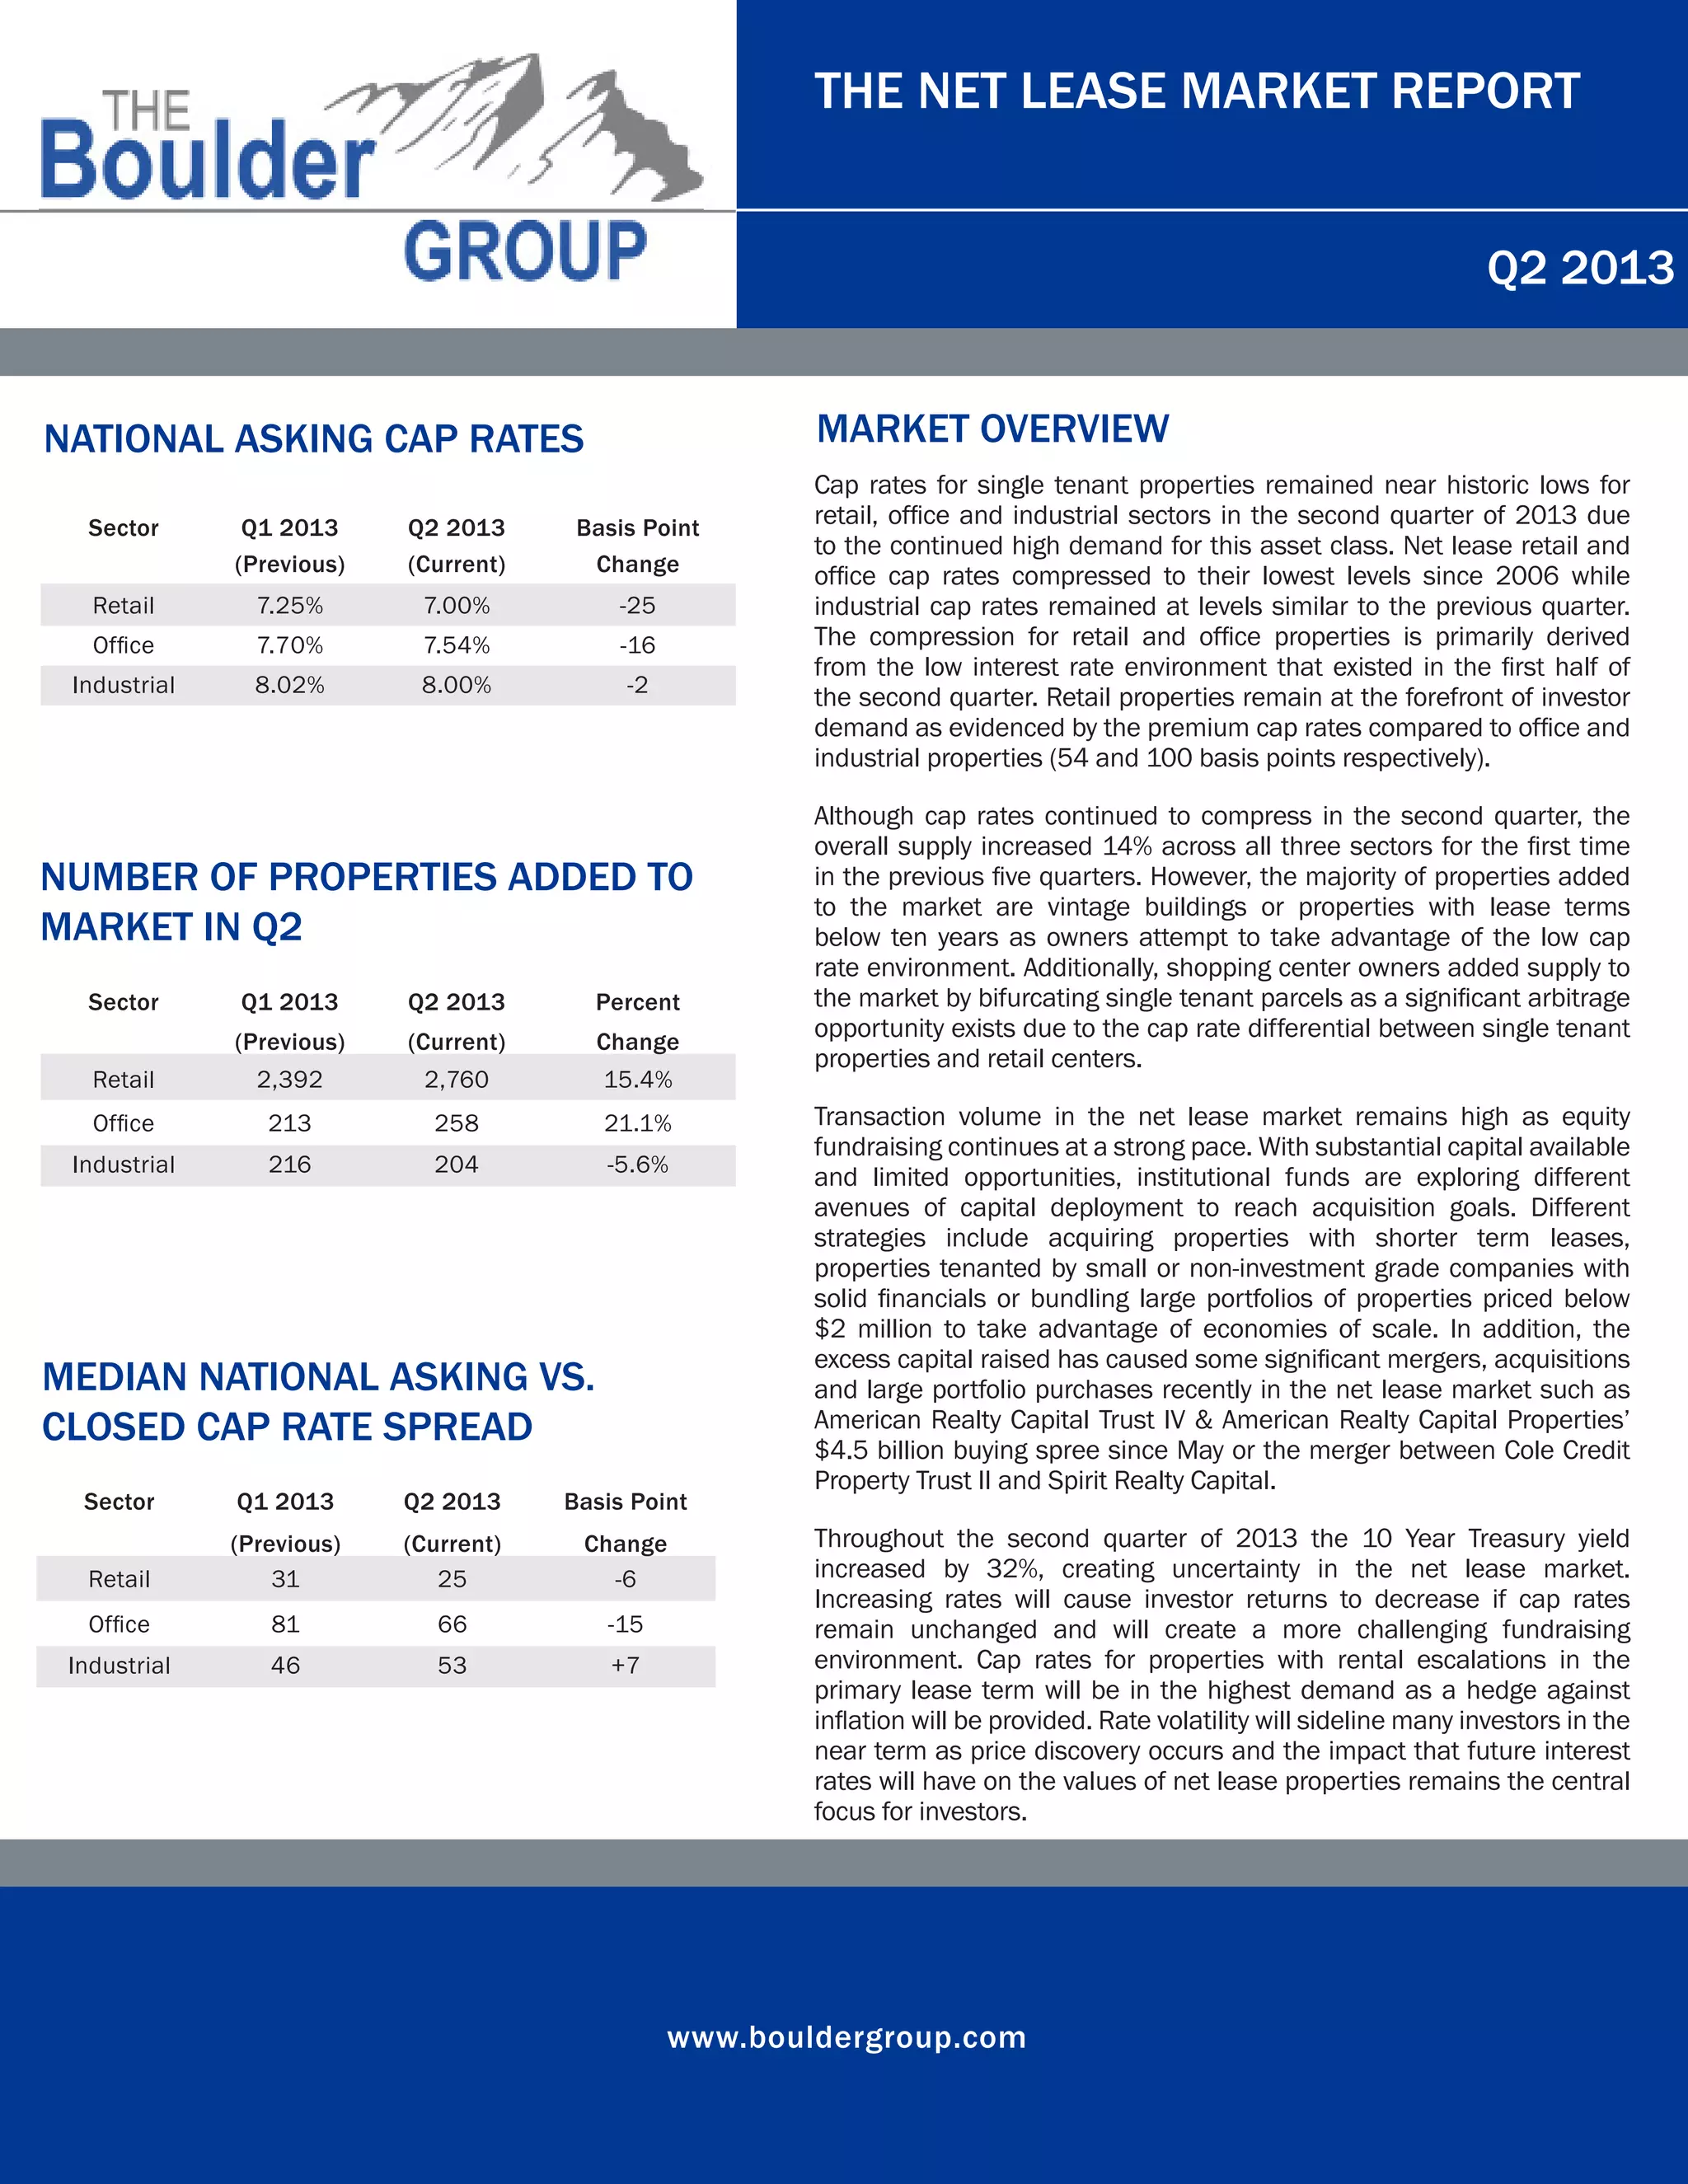

Cap rates for retail, office, and industrial properties remained near historic lows in Q2 2013 due to high investor demand. Retail cap rates saw the largest drop, falling 25 basis points to 7%. The supply of properties for sale increased 14% across sectors compared to the previous five quarters. However, most new properties are older buildings or have leases under 10 years. Transaction volume remains high as investors seek opportunities to deploy substantial capital raised, such as acquiring portfolios or properties with shorter leases. Rising interest rates in Q2 increased uncertainty around future cap rates and investor returns.


