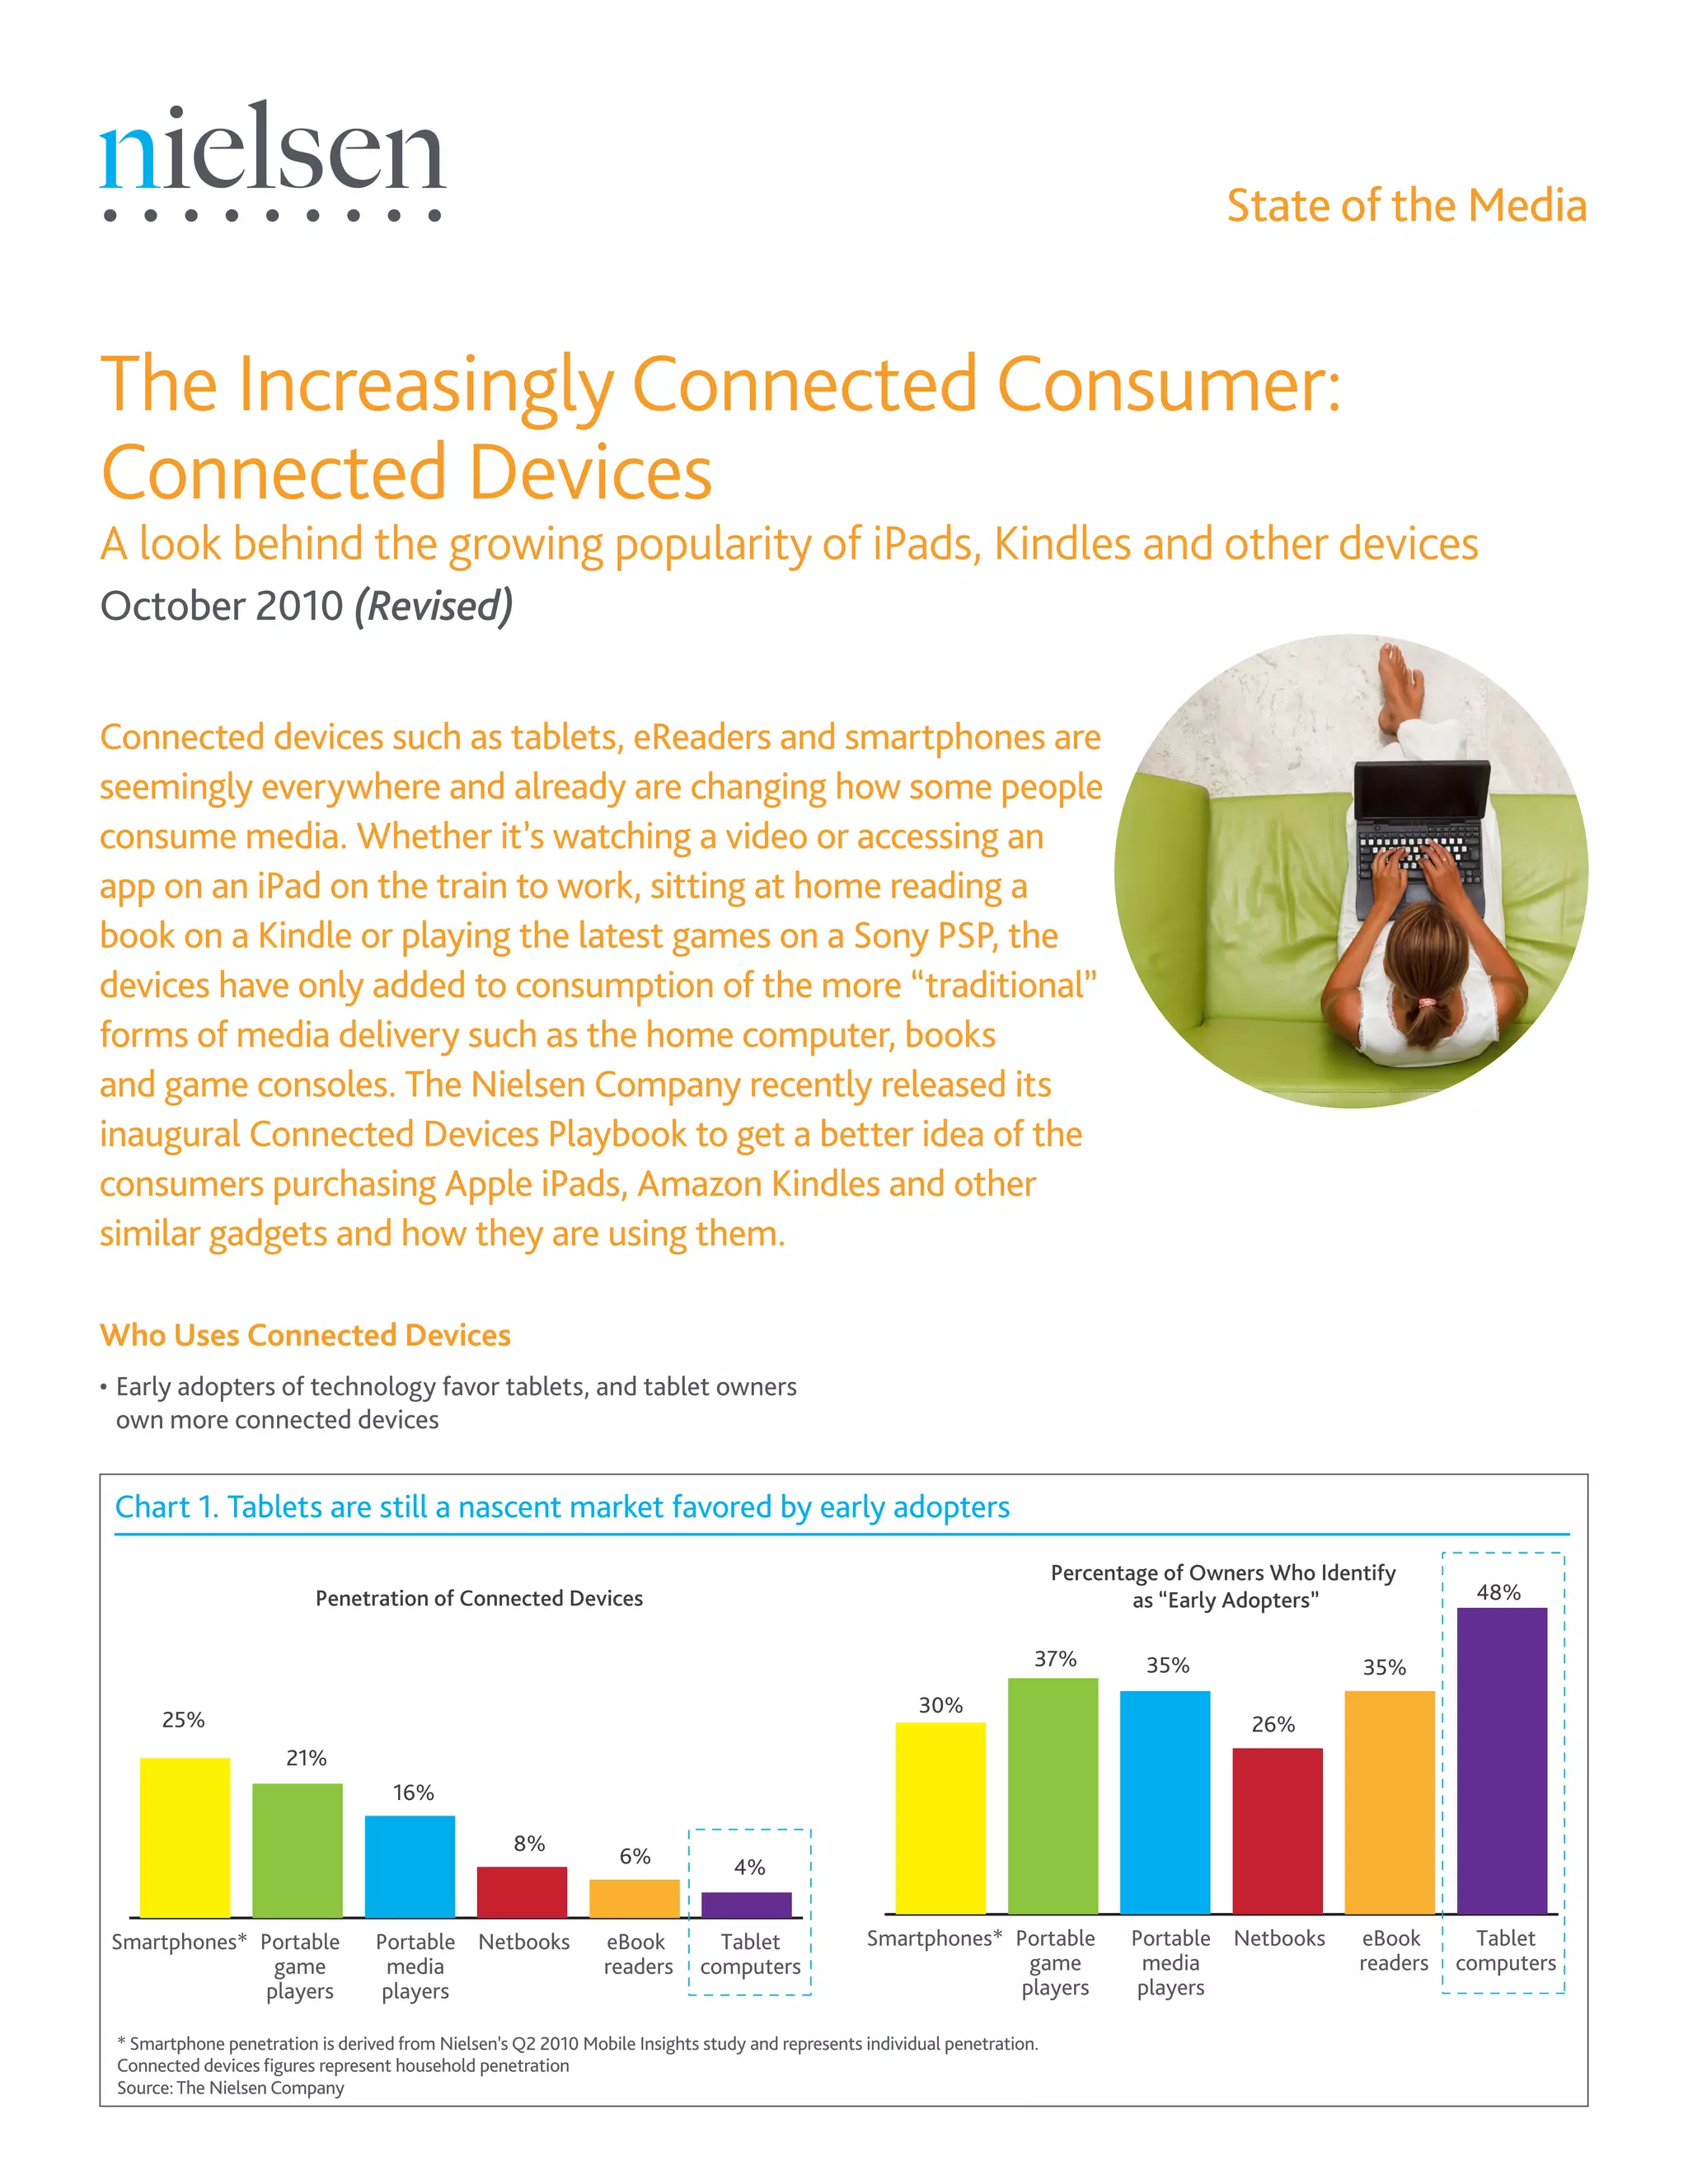
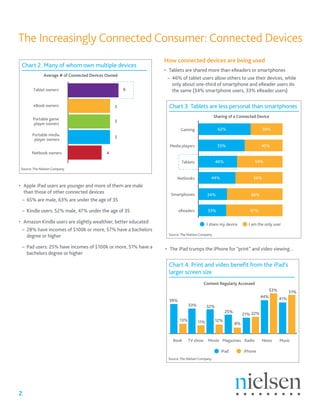
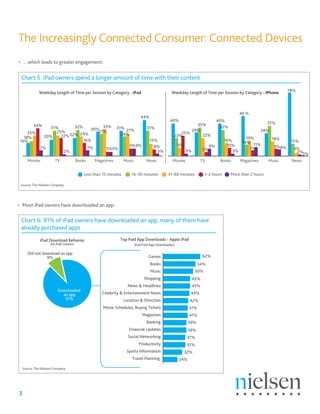
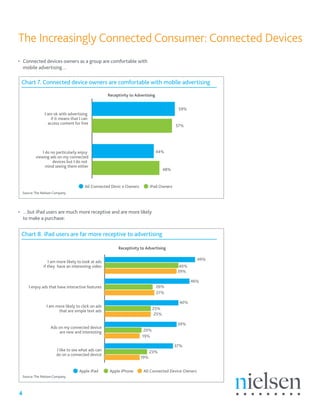
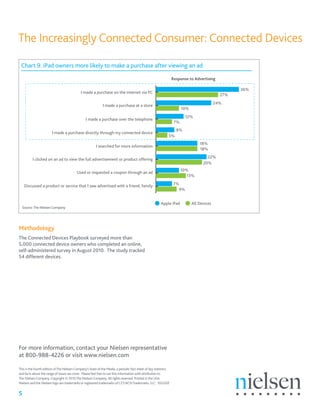
Who Uses Connected Devices
Early adopters of technology favor tablets, and tablet owners
•	
own more connected devices
Connected devices such as tablets, eReaders and smartphones are
seemingly everywhere and already are changing how some people
consume media. Whether it’s watching a video or accessing an
app on an iPad on the train to work, sitting at home reading a
book on a Kindle or playing the latest games on a Sony PSP, the
devices have only added to consumption of the more “traditional”
forms of media delivery such as the home computer, books
and game consoles. The Nielsen Company recently released its
inaugural Connected Devices Playbook to get a better idea of the
consumers purchasing Apple iPads, Amazon Kindles and other
similar gadgets and how they are using them.
The Increasingly Connected Consumer:
Connected Devices
A look behind the growing popularity of iPads, Kindles and other devices
October 2010 (Revised)
State of the Media
Smartphones*
25%
21%
16%
8%
6% 4%
Penetration of Connected Devices
Portable
game
players
Portable
media
players
Netbooks eBook
readers
Tablet
computers
Smartphones*
30%
37% 35%
26%
35%
48%
Percentage of Owners Who Identify
as “Early Adopters”
Portable
game
players
Portable
media
players
Netbooks eBook
readers
Tablet
computers
Chart 1. Tablets are still a nascent market favored by early adopters
* Smartphone penetration is derived from Nielsen’s Q2 2010 Mobile Insights study and represents individual penetration.
Connected devices figures represent household penetration
Source:The Nielsen Company
2
Apple iPad users are younger and more of them are male
•	
than those of other connected devices
65% are male, 63% are under the age of 35
−
−
Kindle users: 52% male, 47% under the age of 35
−
−
Amazon Kindle users are slightly wealthier, better educated
•	
28% have incomes of $100k or more, 57% have a bachelors
−
−
degree or higher
Pad users: 25% have incomes of $100k or more, 51% have a
−
−
bachelors degree or higher
6
5
5
5
4
Average # of Connected Devices Owned
Portable game
player owners
Portable media
player owners
Netbook owners
eBook owners
Tablet owners
Chart 2. Many of whom own multiple devices
Source:The Nielsen Company
How connected devices are being used
Tablets are shared more than eReaders or smartphones
•	
46% of tablet users allow others to use their devices, while
−
−
only about one-third of smartphone and eReader users do
the same (34% smartphone users, 33% eReader users)
Sharing of a Connected Device
Netbooks
Smartphones
eReaders
Tablets
Media players
Gaming 62% 38%
55% 45%
46% 54%
44% 56%
34% 66%
33% 67%
I share my device I am the only user
Chart 3. Tablets are less personal than smartphones
Source:The Nielsen Company
The Increasingly Connected Consumer: Connected Devices
The iPad trumps the iPhone for “print” and video viewing…
•	
39%
13% 11% 12%
8%
33% 32%
25%
21% 22%
44%
53% 51%
41%
Content Regularly Accessed
Book TV show Movie Radio News Music
Magazines
iPad iPhone
Chart 4. Print and video benefit from the iPad’s
larger screen size
Source:The Nielsen Company
3
…which leads to greater engagement:
•	
16%
18%
25%
34% 33%
30% 31%
44%
31%
15%
8%
3%
24%
27%
27%
7%
20% 22%
32%
24%
16%
7% 5%
9%9%
5%
31%
25%
22%
2%
Weekday Length of Time per Session by Category - iPad
Movies TV Books Music News
Magazines
Less than 15 minutes 16–30 minutes 31–60 minutes 1–2 hours More than 2 hours
Weekday Length of Time per Session by Category - iPhone
40%
22%
10%
25%
19%
49 %
28%
78%
15%
4%
2%1%
37%
18%
14%
3%
29%
40%
32%
16%
10%
3%
7% 9%8%
11%
35%
22%
5%
9%
Movies TV Books Music News
Magazines
Chart 5. iPad owners spend a longer amount of time with their content
Source:The Nielsen Company
The Increasingly Connected Consumer: Connected Devices
Most iPad owners have downloaded an app:
•	
Did not download an app
9% 62%
54%
50%
45%
45%
44%
42%
41%
41%
39%
39%
37%
37%
32%
24%
Games
Books
Music
Shopping
News & Headlines
Celebrity & Entertainment News
Location & Direction
Movie Schedules, Buying Tickets
Magazines
Banking
Financial Updates
Social Networking
Productivity
Sports Information
Travel Planning
iPad Download Behavior
All iPad Owners
Top Paid App Downloads - Apple iPad
iPad Paid App Downloaders
Downloaded
an app
91%
Chart 6. 91% of iPad owners have downloaded an app, many of them have
already purchased apps
Source:The Nielsen Company
4
Receptivity to Advertising
I am ok with advertising
if it means that I can
access content for free
I do no particularly enjoy
viewing ads on my connected
devices but I do not
mind seeing them either
59%
57%
44%
48%
All Connected Devic e Owners iPad Owners
Chart 7. Connected device owners are comfortable with mobile advertising
Source:The Nielsen Company
The Increasingly Connected Consumer: Connected Devices
Receptivity to Advertising
I am more likely to look at ads
if they have an interesting video
I enjoy ads that have interactive features
I am more likely to click on ads
that are simple text ads
Ads on my connected device
are new and interesting
I like to see what ads can
do on a connected device
49%
46%
40%
39%
20%
23%
19%
19%
37%
25%
25%
26%
27%
40%
39%
Apple iPad Apple iPhone All Connected Device Owners
Chart 8. iPad users are far more receptive to advertising
Source:The Nielsen Company
Connected devices owners as a group are comfortable with
•	
mobile advertising…
…but iPad users are much more receptive and are more likely
•	
to make a purchase:
5
This is the fourth edition ofThe Nielsen Company’s State of the Media, a periodic fact sheet of key statistics
and facts about the range of issues we cover. Please feel free to use this information with attribution to
The Nielsen Company. Copyright © 2010The Nielsen Company.All rights reserved. Printed in the USA.
Nielsen and the Nielsen logo are trademarks or registered trademarks of CZT/ACNTrademarks, LLC. 10/2202
For more information, contact your Nielsen representative
at 800-988-4226 or visit www.nielsen.com
The Increasingly Connected Consumer: Connected Devices
Response to Advertising
I made a purchase on the internet via PC
I made a purchase at a store
I made a purchase over the telephone
I made a purchase directly through my connected device
I searched for more information
I clicked on an ad to view the full advertisement or product offering
Used or requested a coupon through an ad
Discussed a product or service that I saw advertised with a friend, family
36%
10%
8%
18%
22%
13%
7%
9%
20%
10%
5%
18%
12%
7%
27%
24%
Apple iPad All Devices
Chart 9. iPad owners more likely to make a purchase after viewing an ad
Source:The Nielsen Company
Methodology
The Connected Devices Playbook surveyed more than
5,000 connected device owners who completed an online,
self-administered survey in August 2010. The study tracked
54 different devices.

Nielsen Connected Devices October 2010

  • 1.
    Who Uses ConnectedDevices Early adopters of technology favor tablets, and tablet owners • own more connected devices Connected devices such as tablets, eReaders and smartphones are seemingly everywhere and already are changing how some people consume media. Whether it’s watching a video or accessing an app on an iPad on the train to work, sitting at home reading a book on a Kindle or playing the latest games on a Sony PSP, the devices have only added to consumption of the more “traditional” forms of media delivery such as the home computer, books and game consoles. The Nielsen Company recently released its inaugural Connected Devices Playbook to get a better idea of the consumers purchasing Apple iPads, Amazon Kindles and other similar gadgets and how they are using them. The Increasingly Connected Consumer: Connected Devices A look behind the growing popularity of iPads, Kindles and other devices October 2010 (Revised) State of the Media Smartphones* 25% 21% 16% 8% 6% 4% Penetration of Connected Devices Portable game players Portable media players Netbooks eBook readers Tablet computers Smartphones* 30% 37% 35% 26% 35% 48% Percentage of Owners Who Identify as “Early Adopters” Portable game players Portable media players Netbooks eBook readers Tablet computers Chart 1. Tablets are still a nascent market favored by early adopters * Smartphone penetration is derived from Nielsen’s Q2 2010 Mobile Insights study and represents individual penetration. Connected devices figures represent household penetration Source:The Nielsen Company
  • 2.
    2 Apple iPad usersare younger and more of them are male • than those of other connected devices 65% are male, 63% are under the age of 35 − − Kindle users: 52% male, 47% under the age of 35 − − Amazon Kindle users are slightly wealthier, better educated • 28% have incomes of $100k or more, 57% have a bachelors − − degree or higher Pad users: 25% have incomes of $100k or more, 51% have a − − bachelors degree or higher 6 5 5 5 4 Average # of Connected Devices Owned Portable game player owners Portable media player owners Netbook owners eBook owners Tablet owners Chart 2. Many of whom own multiple devices Source:The Nielsen Company How connected devices are being used Tablets are shared more than eReaders or smartphones • 46% of tablet users allow others to use their devices, while − − only about one-third of smartphone and eReader users do the same (34% smartphone users, 33% eReader users) Sharing of a Connected Device Netbooks Smartphones eReaders Tablets Media players Gaming 62% 38% 55% 45% 46% 54% 44% 56% 34% 66% 33% 67% I share my device I am the only user Chart 3. Tablets are less personal than smartphones Source:The Nielsen Company The Increasingly Connected Consumer: Connected Devices The iPad trumps the iPhone for “print” and video viewing… • 39% 13% 11% 12% 8% 33% 32% 25% 21% 22% 44% 53% 51% 41% Content Regularly Accessed Book TV show Movie Radio News Music Magazines iPad iPhone Chart 4. Print and video benefit from the iPad’s larger screen size Source:The Nielsen Company
  • 3.
    3 …which leads togreater engagement: • 16% 18% 25% 34% 33% 30% 31% 44% 31% 15% 8% 3% 24% 27% 27% 7% 20% 22% 32% 24% 16% 7% 5% 9%9% 5% 31% 25% 22% 2% Weekday Length of Time per Session by Category - iPad Movies TV Books Music News Magazines Less than 15 minutes 16–30 minutes 31–60 minutes 1–2 hours More than 2 hours Weekday Length of Time per Session by Category - iPhone 40% 22% 10% 25% 19% 49 % 28% 78% 15% 4% 2%1% 37% 18% 14% 3% 29% 40% 32% 16% 10% 3% 7% 9%8% 11% 35% 22% 5% 9% Movies TV Books Music News Magazines Chart 5. iPad owners spend a longer amount of time with their content Source:The Nielsen Company The Increasingly Connected Consumer: Connected Devices Most iPad owners have downloaded an app: • Did not download an app 9% 62% 54% 50% 45% 45% 44% 42% 41% 41% 39% 39% 37% 37% 32% 24% Games Books Music Shopping News & Headlines Celebrity & Entertainment News Location & Direction Movie Schedules, Buying Tickets Magazines Banking Financial Updates Social Networking Productivity Sports Information Travel Planning iPad Download Behavior All iPad Owners Top Paid App Downloads - Apple iPad iPad Paid App Downloaders Downloaded an app 91% Chart 6. 91% of iPad owners have downloaded an app, many of them have already purchased apps Source:The Nielsen Company
  • 4.
    4 Receptivity to Advertising Iam ok with advertising if it means that I can access content for free I do no particularly enjoy viewing ads on my connected devices but I do not mind seeing them either 59% 57% 44% 48% All Connected Devic e Owners iPad Owners Chart 7. Connected device owners are comfortable with mobile advertising Source:The Nielsen Company The Increasingly Connected Consumer: Connected Devices Receptivity to Advertising I am more likely to look at ads if they have an interesting video I enjoy ads that have interactive features I am more likely to click on ads that are simple text ads Ads on my connected device are new and interesting I like to see what ads can do on a connected device 49% 46% 40% 39% 20% 23% 19% 19% 37% 25% 25% 26% 27% 40% 39% Apple iPad Apple iPhone All Connected Device Owners Chart 8. iPad users are far more receptive to advertising Source:The Nielsen Company Connected devices owners as a group are comfortable with • mobile advertising… …but iPad users are much more receptive and are more likely • to make a purchase:
  • 5.
    5 This is thefourth edition ofThe Nielsen Company’s State of the Media, a periodic fact sheet of key statistics and facts about the range of issues we cover. Please feel free to use this information with attribution to The Nielsen Company. Copyright © 2010The Nielsen Company.All rights reserved. Printed in the USA. Nielsen and the Nielsen logo are trademarks or registered trademarks of CZT/ACNTrademarks, LLC. 10/2202 For more information, contact your Nielsen representative at 800-988-4226 or visit www.nielsen.com The Increasingly Connected Consumer: Connected Devices Response to Advertising I made a purchase on the internet via PC I made a purchase at a store I made a purchase over the telephone I made a purchase directly through my connected device I searched for more information I clicked on an ad to view the full advertisement or product offering Used or requested a coupon through an ad Discussed a product or service that I saw advertised with a friend, family 36% 10% 8% 18% 22% 13% 7% 9% 20% 10% 5% 18% 12% 7% 27% 24% Apple iPad All Devices Chart 9. iPad owners more likely to make a purchase after viewing an ad Source:The Nielsen Company Methodology The Connected Devices Playbook surveyed more than 5,000 connected device owners who completed an online, self-administered survey in August 2010. The study tracked 54 different devices.