This document summarizes a study examining the pre-settlement drainage network configuration in the Upper Sangamon River Basin in Illinois. The researchers used historical maps, soil surveys, and LIDAR data to estimate the locations and extent of natural channels before the 1850s. They found that about 40% of the basin lacked incised river channels prior to agricultural conversion. Soil maps and 1800s surveys showed similar channel locations, with 82% of historical channels within 50 meters of alluvial soils. The current drainage network is about three times more extensive than the estimated pre-settlement configuration.
Morphometry and Hydrology relationship in Lidder valleyShakil Romshoo
Morphometric analysis of the Lidder catchment was carried out using geospatial technique.The analysis revealed that the area has uniform lithology and is structurally permeable. The high drainage density of all
subwatersheds indicate more surface runoff.The morphometric analysis also indicates that the area is more prone to weathering due to very-coarse to coarse drainage texture.
This document summarizes a study on the morphometry, hypsometry analysis, and runoff estimation of Aam Talab watershed in Raichur, Karnataka, India. Key findings include:
1) Morphometric analysis of the Aam Talab watershed was conducted using GIS tools to calculate parameters like stream frequency, form factor, shape factor, and drainage density.
2) Hypsometric analysis using the hypsometric integral and curve showed the watershed has a value of 0.52, indicating a mature stage.
3) Rainfall data from 1998-2016 was used to estimate runoff, which was highest in 2009 and lowest in 2012, using the SCS curve number
Tracing of palaeochannels of Bakulahi river system in Uttar Pradesh, IndiaMallikarjun Mishra
The document discusses the tracing of paleochannels of the Bakulahi river system in Uttar Pradesh, India using high-resolution remote sensing data from Google Earth. Approximately 115 paleochannels covering 137 square kilometers were identified and mapped within the Bakulahi river basin, along with around 6000 surface water bodies such as ponds and tanks covering 23 square kilometers and 40 oxbow lakes. The study aims to generate a permanent digital database of the paleochannels and other fluvial landforms to better understand the evolution of the Bakulahi river system and locate potential groundwater resources.
IDENTIFICATION OF GROUNDWATER POTENTIAL ZONES USING REMOTE SENSING AND GEOGRA...IAEME Publication
The document describes a study that used remote sensing and GIS techniques to identify groundwater potential zones in the Konakaluva sub-basin of India. Various thematic maps were generated from satellite imagery and other data sources. These maps were overlaid and assigned weights based on their influence on groundwater occurrence. Soil data was given the highest weight of 40%, while land use/cover and drainage density were also significant at 25% and 10%, respectively. An integrated groundwater potential zones map was produced that classified areas as very good, good, fair, moderate or poor potential zones based on the overlay analysis. The results can help with better planning and management of groundwater resources in the study area.
Identification of Groundwater Potential Zones in Vaippar Basin, Tamil Nadu, I...SagarChougule11
Groundwater is prominent part of the earth’s fresh water as well as main source of drinking water and survival source for many lives on earth. Groundwater potential zone identification can be done using advanced as well as recently developed geospatial technology such as Remote Sensing and GIS. GIS technology is useful for capturing, storing, and analyzing spatial data with the help of computer programming techniques. Here in identification of groundwater potential zone using of spatial elements which are related for infiltration of water into ground. For the groundwater potential zone analysis using of spatial layers like geology, geomorphology, rainfall, lineament, land use/land cover, drainage density, soil texture, soil depth etc.
This document describes methods used to estimate groundwater recharge in Neishaboor Plain, Iran. Three methods were used: the Water Table Fluctuation (WTF) method, the Distributed Hydrological Budget (DHB) method, and the Hydrological Budget (HB) method. The WTF and DHB methods estimated monthly recharge rates for individual areas defined by observation wells, while the HB method estimated annual recharge for the entire study area. The results found average annual recharge rates of 228, 269, and 354 million cubic meters using the WTF, DHB, and HB methods respectively. The WTF and DHB methods were considered to provide more reliable estimates of groundwater recharge.
1. The document analyzes the lateral migration of the Red River near Grand Forks, North Dakota over the past 142 years using historical aerial photographs, elevation models, and maps.
2. Measurement results show the channel has migrated noticeably in some areas, with a maximum distance of 1,455 meters. Migration rates average between 0.01-0.38 meters/year, showing a maximum of 54.4 meters of movement over 142 years.
3. The low rates of channel migration found indicate no potential risk to city infrastructure over the next 100 years from the slow moving, mud-dominated river.
Assesment of groundwater_potential_zones_for_bruhat_bangalore_mahanagara_pali...Mohammed Badiuddin Parvez
Groundwater is an important natural resource in present day, but of limited use due to frequent failures in monsoon, undependable surface water, and rapid urbanization and industrialization have created a major threat to this valuable resource. The present work is an attempt to integrate RS and GIS based analysis and methodology in groundwater potential zone identification in the BBMP study area with an aerial extent of 715.95 km2. By Mohammed Badiuddin Parvez
Artificial Recharge to Alluvial Aquifer, Northeastern Nuba Mountains, Sudan.IJRES Journal
Many engineering geology and structural geology aspects have been used in this study, to point out the suitability of the site for artificial recharge to alluvial aquifer, such as; rocks and soil types, seepage rate, structures and lineaments. The area is under lied by basement rocks with considerable thickness (10 to 15 m) of alluvial deposit. Overall soil type is sandy soil and its seepage rate is 34.56 Liter per hour. The most existing lineaments are trending toward NW direction while rocks foliation dipping toward WWN direction. The site is satisfied to be artificial recharge.
Examining wetland loss and potential restoration opportunities in the Sandusk...James Ashby
This document outlines a methodology for assessing wetland functions in the Sandusky watershed of Ohio using GIS. It discusses modeling historic wetlands, enhancing the National Wetlands Inventory with hydrogeomorphic descriptors, and assigning wetland functions. Historic wetland mapping found over 78% loss since pre-settlement, with forested wetlands declining 90% and scrub-shrub 85%. Functions like floodwater storage and nutrient transformation were assigned significance levels of high, medium, low based on wetland type, location and other criteria. Comparing current to historic conditions provides targets for wetland management.
The document discusses the need for high resolution digital elevation data to identify critical areas for targeting conservation practices in Minnesota. Precision conservation, which focuses practices on disproportionately polluting areas, can better protect water quality and habitat than spreading practices evenly. Lidar data can help identify critical sources of runoff and pollution like upland depressions, eroding stream banks, and ravines. Targeting best management practices to these critical areas identified through terrain analysis of high resolution elevation data can maximize the impact of conservation efforts.
Remote Sensing & GIS based drainage morphometryAkshay Wakode
Remote sensing and Geographical Information Systems (GIS) techniques are increasingly being used for morphometric analysis of drainage basins throughout the world. GIS facilitates the manipulation and analysis of spatial information obtained using remote sensing. Integrating GIS and RS provides an efficient mechanism not only to upgrade and monitor morphometric parameters but also to permit spatial analysis of other associated thematic database. As compared to the conventional morphometric studies, remote sensing provides extant ground reality inputs for assessing changes in drainage patterns, density soil characteristics and land-use/land form changes in real life. Morphometry by and large, affects the hydrological processes rather indirectly through their dependency on several other factors such as soil, geology, vegetation cover and climate (Schmidt et al. 2000). The interrelationship between morphometric parameters varies from basin to basin under diverse topography and climatic condition. Understanding these relationship would enable the identification of the dominant parameters acting on a particular basin. An extensive and detailed analysis accounting for the various morphometric parameters under linear, areal and relief aspects of measurements was performed. The test site is located along the foothills of the Western Ghats, near the city of Pune and comprises of three large scale basins. The three rivers viz. Ghod, Bhima and Mula-Mutha, which are amongst the largest in the state, broadly consist of 23 sub-basins of Ghod, 22 of Bhima and 11 of Mula-Mutha.
This document describes a study that used remote sensing, GIS, and field data to create a groundwater prospectus map for an area in India. Key factors like geology, geomorphology, and recharge conditions that influence groundwater were analyzed. IRS satellite imagery and geophysical survey data were incorporated into a GIS. Different parameters were weighted and integrated to delineate zones of very good to poor groundwater potential. The resulting map was validated against actual borewell yield data, with yields generally matching the predicted potential zones. The study demonstrated the effectiveness of using a GIS and remote sensing to map groundwater potential across a region.
International Journal of Engineering and Science Invention (IJESI) is an international journal intended for professionals and researchers in all fields of computer science and electronics. IJESI publishes research articles and reviews within the whole field Engineering Science and Technology, new teaching methods, assessment, validation and the impact of new technologies and it will continue to provide information on the latest trends and developments in this ever-expanding subject. The publications of papers are selected through double peer reviewed to ensure originality, relevance, and readability. The articles published in our journal can be accessed online.
This document describes the development of a 1-dimensional HEC-RAS sediment transport model for the 357-mile Kansas River. The model was developed to analyze how increased sediment loads from reservoir sediment management strategies may impact the river. It was calibrated using bed change data from 2007-2018 and validated against USGS stage data. The model will be used to simulate future sediment management scenarios and their effects on the river and stakeholders.
1) A hydro-geophysical investigation was conducted at a closed landfill site in southwestern Ontario, Canada to map the distribution of landfill leachate and subsurface geology.
2) Electromagnetic and resistivity surveys revealed an anomalous high-conductivity zone in the western half of the site, indicating the presence of landfill leachate in the upper aquifer and partially in the underlying silt/sand aquitard. No contamination was detected in the lower sand aquifer.
3) Hydrological modeling predicted that the landfill leachate plume will occupy the entire upper aquifer and most of the silt/sand aquitard within 1000 years, but the lower sand aquifer will remain
Quantitative evaluation and analysis of morphometric parameters derived from ...AM Publications
GIS has become a key source to understand the hydrological conditions of watersheds for the last few decades. Arc Hydro tool of ArcGIS has been proven its role in the automated extraction of drainage network and morphometric analysis from DEMs. The delineation of drainage network can be done either manually from topographic sheets or derived from Digital Elevation Model (DEM) data by means of computational methods. In the present work, ASTER DEM has been incurred to extract drainage network with the aid of Arc hydro tool. The Vaishali River basin of Madhya Pradesh has been taken as the study area. This study has been done primarily based on a geo-spatial software ARC GIS in which ARC HYDRO a tool has been used extensively. The quantitative evaluation and analysis of about twenty morphometric parameters has been done based on the linear, areal and relief aspects. The analysis has revealed that the Vaishali River basin is a fifth order basin showing dendritic drainage pattern with drainage density of 0.40 per km and stream frequency of 0.08 per km2. Low drainage density indicates the basin has not been much affected by structural disturbances while drainage frequency and very coarse drainage texture specifies low relief and porous, permeable rocks beneath the ground surface. The form factor, circularity ratio and elongated ratio suggest the basin shape as elongated. The area has low to moderate relief and slopes displays moderate relief ratios. It is concluded that this technique is not only reduces time but also provides valuable results which are very helpful for watershed management studies.
This document summarizes a water budget model created for Lake Lowery in Polk County, Florida. The model was created by the Southwest Florida Water Management District to help set minimum water levels for the lake. The water budget model accounts for water inputs like rainfall and outputs like evapotranspiration. It also considers water moving between the surficial and Floridan aquifers. Model results show that when groundwater pumping lowers the Upper Floridan aquifer by 4 feet, the lake level drops by almost 1 foot.
Estimation of Groundwater Recharge Using WetSpass and MODFLOWPutika Ashfar Khoiri
The document discusses methods for estimating groundwater recharge using the WetSpass and MODFLOW models. WetSpass is a physically based model that uses inputs like land use, soil type, and climate data to calculate spatial patterns of evapotranspiration, surface runoff, and groundwater recharge. The recharge output from WetSpass is then used as input for the MODFLOW groundwater flow model. Together, WetSpass and MODFLOW allow for the simulation of spatially variable recharge and groundwater flow.
Features:
View watershed boundary and drainage network, and contour map layers
Find area of a selected watershed
View ground profile along and across the stream path
View existing water conservation structures along with photo
Manage watershed structures
Add Water Conservation Structure
Change Status of Structure (Proposed, Under Progress, Completed)
Technology
Google Maps API
Google Elevation API
Google Fusion Tables (for polyline and polygon data)
ASP.NET, SQL Server 2008 (for point data)
This document discusses a GIS-based assessment of wetland functions in the Sandusky watershed in Ohio. It outlines modeling historic wetlands, enhancing the National Wetlands Inventory with hydrogeomorphic descriptors, assigning wetland functions, and comparing current and historic conditions. Key steps included mapping potentially restorable historic wetlands, assigning landscape, landform, waterbody and water flow path descriptors to current wetlands, and evaluating wetlands' significance for functions like flood storage and nutrient transformation. The analysis found a 78% reduction in wetland acreage from historic to current conditions.
-Examined features ranging from valley systems in Margaritifer Sinus to inverted topography in Aeolis/Zephyria Plana
-Studied and analyzed MOLA, THEMIS-VIS, OMEGA, MOC, CRISM, HRSC, and CTX imagery
Morphometric analysis of vrishabhavathi watershed using remote sensing and giseSAT Journals
Abstract Vrishabhavathi Watershed is a constituent of the Arkavathi River Basin, Bangalore Urban and Ramanagara District and covers an area of 381.465Km2, representing seasonally dry tropical climate. To achieve the Morphometric analysis, Survey of India (SOI) topomaps in 1:50000 scales are procured and the boundary line is extracted by joining the ridge points. This will serve as study area or area of interest for preparing base map and thematic maps. The recent changes are updated with the help of Remote sensing satellite data. The drainage map is prepared with the help of Geographical Information System tool and morphometric parameters such as linear, aerial and relief aspects of the watershed have been determined. These dimensionless and dimensional parametric values are interpreted to understand the watershed characteristics. From the drainage map of the study area dendritic drainage pattern is identified. Strahler (1964) stream ordering method is used for stream ordering of the watershed. The drainage density of the watershed is 1.697 km/km2. Index Terms: Morphometric analysis, Remote Sensing, GIS, SOI Topomap and Vrishabhavathi Watershed
The Presentation gives the overview of the process necessary for accomplishing the task for the preparation of Ground water movements and identification carried out by Rajiv gandhi national drinking water mission project.
This document discusses methods for estimating groundwater potential and balance. It provides an overview of key concepts like the hydrologic cycle, national water policy regarding groundwater, and the groundwater balance equation. The document also outlines data requirements, methodology, and methods for estimating individual components of the groundwater balance like recharge from rainfall, recharge from canals, and evapotranspiration from groundwater. Empirical formulas and norms from expert committees are presented for calculating various recharge coefficients.
The document analyzes the pre-settlement drainage network of the Upper Sangamon River Basin in Illinois. The researchers used several methods to estimate the pre-settlement configuration, including analyzing early 1800s survey maps, alluvial soil maps, and topography. They found that the current channel network is 2-3 times more extensive than the pre-settlement estimates. However, over 80% of surveyed 1800s channels were within 50 meters of alluvial soils, suggesting the estimates identified similar channel locations. The expanded modern network results from significant human impacts, making the basin's natural evolution more difficult to study. Understanding pre-settlement configurations helps model drainage formation in low-relief glaciated areas.
The document summarizes a bathymetric survey of Cross Lake in Caddo Parish, Louisiana that was conducted from April to June 1996 by the U.S. Geological Survey in cooperation with the City of Shreveport. Cross Lake provides drinking water for the city and is an important recreational resource. The survey mapped over 300,000 data points to define the lake bottom morphology and aid in water quality interpretation. The lake covers 13.4 square miles, has an average depth of 7.7 feet, and maximum depth of 18.3 feet. Key results of the bathymetric survey are presented, including the lake boundaries, depth contours, and physical characteristics.
This study aims to develop methods to increase CO2-enhanced oil recovery in nonconventional oil reservoirs in Illinois, focusing on the thick Cypress Sandstone. CO2 injection could potentially extract bypassed oil while storing the CO2 underground, mitigating climate change. Geological modeling and petrophysical analysis of core and log data from the Cypress Sandstone will be used to assess the CO2-EOR potential. Findings could aid development of otherwise uneconomical oil resources and remove more carbon from the atmosphere than produced during recovery. The results may demonstrate economic incentives for CO2 storage and reuse in oil production from this nonconventional reservoir.
StreamFlow Variability of 21 Watersheds, OregonDonnych Diaz
This study analyzed the relationship between streamflow runoff and physical attributes in 21 Oregon watersheds. Monthly streamflow data from 1958-2008 was collected and watershed characteristics like elevation, slope, aspect and land cover were determined. A multiple regression model found land cover, elevation and aspect significantly correlated with winter streamflow, but not summer flow. This suggests precipitation is important and the model needs additional variables like soil and snowpack to better predict streamflow runoff.
Delineation of potential groundwater recharge zones plays a vital role in sustainable management of groundwater resources. The present study is carried out to identify the groundwater potential recharge zones in Multan, Pakistan by using Remote Sensing (RS) & Geographical Information System (GIS) for augmenting groundwater resources. In Multan district (Punjab, Pakistan), the increasing population and expansion of land use for agriculture have severely exploited the regional ground water resources. Land Use Land Cover (LULC) change is an accelerating phenomenon on the surface of earth driven by anthropogenic activities including urban expansion, deforestation, and climatic variations. Intensive pumping has resulted in a rapid decline in the level of water table as well as its quality. Better management practices and artificial recharge are needed for the development of sustainable groundwater resources. In order to address these issues Geographic information system (GIS) and Remote sensing (RS) are the most efficient methods for the identification and detection of Land Use patterns. All of these techniques are used for mapping and identification of groundwater potential analysis. This groundwater potential information will be useful for the effective identification of appropriate locations for extraction of water. This study should be done to delineate groundwater potential recharge zones by using different thematic layers that were overlaid in ArcGIS. In the overlay analysis, the weights (for various thematic layers) are allocated based on a review of published literature or by expert opinion. The assigned weights are then normalized and modified using the analytical hierarchical process (AHP). The potential recharge map thus obtained and divided into four zones (poor, moderate, good, and very good) based on their influence to groundwater recharge.
Spatial variation in surface runoff at catchment scale, the case study of adi...Alexander Decker
This document summarizes a study on spatial variation in surface runoff within the Adigela catchment in Tigray, Ethiopia. Four sub-catchments were monitored for runoff. Runoff was found to vary significantly between sub-catchments due to differences in shape, vegetation cover, slope, soil type, land use, and rainfall amounts. Peak discharges ranged from 0.47 to 2.14 m3/sec across the sub-catchments. Infiltration rates also varied spatially based on soil texture. The SCS-CN method was found to adequately predict runoff patterns in the catchment. The study provides insight into key factors controlling runoff generation and hydrograph response at the catchment
Rate of sediment yield in the conveyance canals of kano river irrigation proj...Alexander Decker
This document summarizes a study that examined the rate of sedimentation in the conveyance canals of the Kano River Irrigation Project in northwestern Nigeria. Five canals were sampled to analyze sediment texture, suspended sediment concentration, canal discharge rates, and the impact of sediment accumulation. Testing found the sediment deposits mainly consisted of fine sand with some clay and silt. Suspended sediment concentration averaged 8,474 tons per year. Canal discharge rates had reduced by 47% on average, affecting irrigated land area. Factors like poor farming practices, tractor movement in canals, and lack of maintenance were found to contribute to increased sedimentation, highlighting the need for regular dissilting and cleaning of canals.
Rate of sediment yield in the conveyance canals of kano river irrigation proj...Alexander Decker
This document summarizes a study that examined the rate of sedimentation in conveyance canals of the Kano River Irrigation Project in Nigeria. Five canals were sampled and tested for sediment texture, suspended sediments, and changes in water discharge over time. Testing found that the canal sediments consisted mostly of fine sand with some clay and silt. Suspended sediment concentration averaged 8,474 tons per year. While statistical tests found no significant difference in design discharge versus current discharge, discharge had actually reduced by 47% on average, affecting irrigated land area. High sedimentation is thought to be due to factors like farm vehicle traffic in canals, poor irrigation practices, and lack of maintenance. Regular dissilting and cleaning of
Paper - Landscape Change Over 60 Years Surrounding Cedarburg BogJason Schroeder
This article describes my project to classify historical land use of the Cedarburg Bog. I worked on this as a student at the University of Wisconsin-Milwaukee.
This presentation was given as part of the EPA-funded Catchment Science and Management Course focusing on Integrated Catchment Management, held in June 2015. This course was delivered by RPS Consultants. If you have any queries or comments, or wish to use the material in this presentation, please contact catchments@epa.ie
It is increasingly being recognised internationally that integrated catchment management (ICM) is a useful organising framework for tackling the ongoing challenge of balancing sustainable use and development of our natural resource, against achieving environmental goals. The basic principles of ICM (Williams, 2012) are to:
• Take a holistic and integrated approach to the management of land, biodiversity, water and community resources at the water catchment scale;
• Involve communities in planning and managing their landscapes; and
• Find a balance between resource use and resource conservation
ICM is now well established in Australia, New Zealand, and the United States. In Europe the ICM approach has been proposed as being required to achieve effective water and catchment management, and is the approach being promoted by DEFRA for the UK, where it is called the “Catchment Based Approach” (CaBA). The principles and methodologies behind ICM sit well within the context of the Water Framework Directive with its aims and objectives for good water quality, sustainable development and public participation in water resource management. In Ireland it is proposed that the ICM approach will underlie the work and philosophy in developing and implementing future River Basin Management Plans.
- The document analyzes average annual soil loss in the Sevenmile Creek watershed located in southern Iowa using the modified soil loss equation (RUSLE).
- Key factors that influence soil loss according to the RUSLE include rainfall/runoff (R factor), soil erodibility (K factor), slope length and steepness (LS factor), land cover/management practices (C factor), and conservation practices (P factor).
- GIS data on rainfall, soil properties, elevation, land cover, and watershed boundaries were compiled and analyzed spatially using RUSLE to estimate average annual soil loss per acre for the Sevenmile Creek watershed.
The document summarizes a study that used LIDAR data from 2005 and 2009 to analyze changes in elevation of gravel bars and the migration of channels in a section of the North Fork of the Nooksack River in Washington. Bare earth layers were generated from the LIDAR data and analyzed in ArcGIS to detect changes. Results showed gravel bars gained up to 4 meters and lost up to 3 meters in elevation over the 4 year period, indicating significant river migration. While LIDAR only measures surface elevations, the analysis demonstrated it can effectively monitor short-term stream changes and the method has various applications for research and conservation efforts.
This document presents a morphometric analysis of a semi-urban watershed located in Allahabad, India using Cartosat DEM data and GIS. Key findings include:
1) The watershed has an area of 289.41 km2 and exhibits a dendritic drainage pattern. Strahler stream ordering identified the watershed as having first to fifth order streams.
2) Morphometric parameters related to the linear and aerial aspects of the watershed were calculated using GIS, including stream length, bifurcation ratio, drainage density, and others.
3) The analysis revealed information on the watershed characteristics and drainage network. For example, first order streams had the highest total length and number, which decreased with
Morphometric analysis of a Semi Urban Watershed, trans Yamuna, draining at Al...theijes
The International Journal of Engineering & Science is aimed at providing a platform for researchers, engineers, scientists, or educators to publish their original research results, to exchange new ideas, to disseminate information in innovative designs, engineering experiences and technological skills. It is also the Journal's objective to promote engineering and technology education. All papers submitted to the Journal will be blind peer-reviewed. Only original articles will be published.
The papers for publication in The International Journal of Engineering& Science are selected through rigorous peer reviews to ensure originality, timeliness, relevance, and readability.
Theoretical work submitted to the Journal should be original in its motivation or modeling structure. Empirical analysis should be based on a theoretical framework and should be capable of replication. It is expected that all materials required for replication (including computer programs and data sets) should be available upon request to the authors.
The International Journal of Engineering & Science would take much care in making your article published without much delay with your kind cooperation
Novel Analysis of Mono Basin using ArcGISSachin Mehta
The document summarizes geological investigations of the Mono Basin and surrounding area using ArcGIS. It describes three main tasks: 1) investigating correlations between faults and springs; 2) charting shoreline development over time; and 3) using hyperspectral imaging to study the Mono Craters. ArcGIS was used to map faults, springs, and shorelines to analyze their relationships and identify potential geothermal sites. Hyperspectral data from the AVIRIS sensor was analyzed to identify mineral compositions and study the Mono Craters.
This study analyzed changes in thermokarst lakes near Chersky, Russia between 1965 and 2011 using historical photographs and satellite imagery. The total lake area increased by 2,801,400 square meters over this period. Specifically, the number of small lakes increased while the number of large lakes decreased. Additionally, small lakes made up a greater percentage of the total lake area in 2011 compared to 1965. This suggests climate change is contributing to the drainage of larger lakes and expansion of smaller, more numerous water bodies in the region.
This document summarizes a study on the biogeochemistry of dissolved nitrogen, phosphorus, and organic carbon along terrestrial-aquatic flowpaths in a montane headwater catchment in the Peruvian Amazon. The study investigated spatial and temporal variations in nutrient concentrations from upland soils to streams under baseflow and stormflow conditions. Key findings include: 1) During baseflow, strong terrestrial controls maintained relatively constant nitrate levels in streams compared to more variable upland soils; 2) Dissolved organic nitrogen dominated stream nitrogen despite decreasing concentrations from uplands; 3) Phosphorus concentrations showed the inverse pattern, with higher levels in streams than uplands. 4) Stoichiometric ratios contrasted between uplands and streams
Scale-dependency and Sensitivity of Hydrological Estimations to Land Use and ...Beniamino Murgante
Scale-dependency and Sensitivity of Hydrological Estimations to Land Use and Topography for a Coastal Watershed in Mississippi - Vladimir J. Alarcon and Charles G. O’Hara
The document discusses morphometric analysis of drainage basins. It describes how drainage basins can be analyzed based on their linear, aerial, and relief aspects. Linear aspects include stream order, length, and bifurcation ratio. Aerial aspects include basin area, shape, and drainage density. Relief aspects examine the relationship between area, altitude, and slope. Morphometric analysis of drainage basin parameters provides insight into the physical characteristics and evolution of the landforms.
This document discusses a case study of sites along the Merri Creek in Australia before it meets the Yarra River. Due to geological processes over time, there is an extensive valley landscape with escarpments, gullies, cliffs and spurs of varying steepness governed by water movement. The area was historically important to Aboriginal people and then used for pastoralism and agriculture. It now serves recreational and transportation purposes and shows signs of human impact like litter.
1. 1
Pre-Settlement Drainage Network Configuration in the
Upper Sangamon River Basin
Jacob Henden and Alison Anders, University of Illinois Urbana-Champaign, Urbana, Illinois
Abstract
Prior to European settlement in the1850s, the recently glaciated landscape of the Upper
Sangamon River Basin (USRB) was evolving toward a well-developed fluvial landscape via the
headward expansion of river channels. After settlement, the landscape was converted from tall
grass prairie to corn and soy agriculture. This intensive agriculture, typical in the U.S. Midwest,
requires significant modification of drainage networks. Drainage ditches and tile drainage were
added to the basin, and the modern channel network is now significantly more expansive than it
was in the early 1800s. The pre-settlement drainage network provides information about how
the landscape was evolving since the last episode of glaciation and before significant human
impacts. We estimate the physical locations of incised channels within the USRB prior to
European settlement using General Land Office (GLO) surveys from the early 1800s, USDA
Natural Resources Conservation Service soil maps, and LIDAR-based digital elevation models.
Early maps and soil surveys support the hypothesis that these regions lacked a complete fluvial
drainage network, and LIDAR topography suggests about 40% of the USRB lacked incised river
channels prior to the conversion to agriculture. The soil maps and the 1800s GLO maps place the
channels in roughly the same locations with 82% of the mapped 1800s channels existing within
50 meters of alluvial soils. All data sets used show similar patterns for the configuration of the
pre-settlement drainage network.
Introduction
The transportation of water and sediments across a landscape is largely controlled by channels
and lakes within a drainage basin, collectively these features are called drainage networks.
Drainage networks are largely determined by the elevation and slope of the land. Various factors,
such as climate, geologic structure, and lithology, influence topography and erosion rates of
landscapes and, by extension, the formation of drainage networks (Nag and Chakraborty, 2003).
Glaciation, the movement of glaciers over a landscape, effects topography and can completely
alter the location of drainage networks. When this occurs it is known as drainage reversal. In
some circumstances, tributaries can be blocked making landscapes less connected by channels
(Coffey, 1961). After an episode of glaciation, an area can change from a glacial to a fluvial
landscape, through the expansion of drainage networks. In a glacial landscape the land is shaped
by the previous episode of glaciation, while in a fluvial landscape the land is shaped by stream
erosion.
Humans have direct and indirect impacts on drainage networks, often on a more rapid time scale
compared to other factors (Gregory 2006). Human influence on drainage networks is
particularly pronounced in certain regions of the U.S. Midwest, where high intensity agriculture
on wet, flat terrain promotes the use of tile draining and extensive drainage ditches (Urban and
Rhodes 2003). Rhodes et al., (2015) examined how the drainage network of the Upper
Sangamon River Basin (USRB), a previously glaciated region in Illinois, has changed since the
introduction of agriculture. They compared the current channels to mapped historical channels,
2. 2
and estimated the current channel network to be almost three times as extensive compared to
before the 1850s (Rhodes et al., 2015).
The intent of this paper is to produce an estimate for the configuration of the pre-settlement
drainage network of the USRB in order to gain a better understanding of the network’s natural
evolution. General Land Office (GLO) surveys from the early 1800s, USDA Natural Resources
Conservation Service soil maps, and LIDAR-based digital elevation models were used to derive
estimates for physical locations of historic channels, and to determine what extent of the basin
contains natural channels. The results of this research are intended to help produce a model for
how drainage networks evolve in previously glaciated low-relief areas.
Study Area
The Upper Sangamon River Basin is a 2300 km2
basin in East Central Illinois. The geologic
features of the basin are flat uplands, moraines, and incised valleys. The limited expanse of
incised valleys includes the Sangamon River and major tributaries (Illinois Department of
Natural Resources, 1999a). A greater percentage of the incised valleys exist in the southern half
of the USRB, and a greater area covered by moraines exists in the northern half of the USRB.
The flat uplands cover the most area throughout both the northern and southern halves of the
basin (Figure 1). The relatively flat topography (average slope less than 2%) of the landscape is
largely a result of the Wisconsin episode of glaciation approximately 25,000 years ago (Stiff and
Hansel, 2004). Prior to European settlement, vegetation cover of the basin was primarily tall
grass prairie, now the region is dominated by corn and soy agriculture. (Illinois Department of
Natural Resources, 1999c)
The basin is a Critical Zone Observatory for Intensively Managed Landscapes (CZO-IML) as
designated by the National Science Foundation. The Critical Zone is defined as the area ranging
from upper vegetation canopies to the bottom of the active aquifers, the name critical referring to
its critical role in maintaining life. Critical Zone Observatories are intended to integrate
interdisciplinary studies up to the watershed scale (Anderson, et al., 2008). Reconstruction of the
pre-settlement channel network in the USRB is necessary to evaluate the transport of water and
sediment prior to the advent of intensive agriculture.
Data and Methods
Historic channel locations based on General Land Office (GLO) surveys from before 1850 were
obtained as digital georeferenced shapefiles. The Prairie Research Institute at the University of
Illinois produced these shapefiles using original plat maps from the Illinois State Archives. The
modern channel shapefiles were produced from georeferenced digital line files from the U.S.
Geological Survey that were cross-referenced with 2012 Aerial Photography from the U.S.
Department of Agriculture (USDA) to include only well-defined channels (Rhoads et al., 2015).
We make an independent estimate of natural channel locations using soil survey data. The
dominant parent materials for soils in the USRB include loess, till, outwash and alluvium
(Illinois Department of Natural Resources, 1999a). Alluvial soils are deposited by running water,
and the presence of alluvial soils can indicate historic presence of channels and floodplains.
3. 3
Locations of alluvial soils were obtained using soil maps from the USDA Natural Resource
Conservation Service (NRCS) soil surveys. Soil maps from the USRB were downloaded from
the NRCS web soil survey. Soils that had alluvium named as a parent material on their official
soil series descriptions were selected to create a shapefile of alluvial soils within the USRB. The
proximity of the channels mapped in the early 1800 GLO surveys and the channel estimates
derived from the NRCS soil surveys were evaluated using analysis tools in ArcMap.
Topography of the study area was examined using LIDAR data, obtained from the Illinois
Height Modernization Program (ILHMP). LIDAR (Light Detection and Ranging) data was used
to produce 1 meter contour lines in ArcMap. The LIDAR raster and contour lines were used to
estimate areas with and without natural channels. Areas with natural channels have contour lines
with characteristic V-shaped patterns, while in areas without natural channels this pattern is not
seen. In areas with natural channels, there appears to also be wide sloping valleys that lead to the
channels. In areas without natural channels, but with drainage ditches, these natural valleys are
not seen. A natural channel appears to be influenced by surrounding topography, while drainage
ditches largely do not appear to be influenced by surrounding topography.
Two different methods were used to estimate the extent of unchannelized area within the USRB.
One method produced a maximum estimate that had a higher estimate for what percent of the
USRB was unchannelized. The other method produced a minimum estimate that had a lower
estimate for what percent of the USRB was unchannelized. The methods are somewhat
subjective, because the classifications were made visually. For each estimate the LIDAR raster
and contour lines were referenced to select places without the characteristic V-shaped patterns
and wide sloping valleys. In the minimum estimate, there are no V-shaped patterns or wide
sloping valleys. In the maximum estimate, areas are included where it is unclear whether there
are V-shaped patterns and wide sloping valleys, and subsequently, whether there are natural
channels. Examples of a clearly channelized, a clearly unchannelized, and an area that would fall
between the classifications can be seen in (Figure 2). The estimates were averaged together to
derive an estimate for what percent of the basin had natural channels. Elevation and slope for
various estimates were derived using analysis tools in ArcMap. For slope and elevation
estimates, a 30 meter DEM was used instead of the LIDAR raster for the advantage of faster
processing.
Results
Alluvial soils as mapped by the NRCS occur in approximately 4.3% of the USRB. The soil
maps and the 1800s GLO maps place the channels in roughly the same locations with 82% of the
mapped 1800s channels existing within 50 meters of alluvial soils. In comparison only 57% of
modern channels exist within 50 meters of alluvial soils (Figure 3). The modem channel
network is approximately three times more extensive than the estimates based on the 1800s GLO
maps and approximately twice as extensive as the estimates based on the mapped alluvial soils
The minimum estimate for the fraction of the area of the USRB that lacked natural channels was 36.6%
and the maximum estimate was 44.3%, producing an average estimate of 40.45% (Figure 4). The mean
elevation for the Upper Sangamon River Basin is 220.16 meters and the mean slope is 1.52%. In
areas without natural channels the mean elevation is 222.98 meters and the mean slope is 0.82%.
In channelized areas the mean elevation is 219.156 meters and the mean slope is 1.83%. The
4. 4
channelized areas have lower elevations and greater slopes than the non-channelized areas.
Additionally less than 3% of both the alluvial and 1800s channel estimates occur within non
channelized areas. In comparison, 13% of modern channels occur within non channelized areas.
Discussion
The various data sets used present different challenges in producing estimates for the pre-
settlement drainage network. It is uncertain precisely what size of streams surveyors in the
1800s would record, although previous work with these GLO maps place the minimum recorded
width at 1-1.5 meters. It is also difficult to know if there was consistency between multiple
surveyors, for example some surveyors might have recorded a channel that didn’t have water
flowing through it, while others might not have (Rhode et al., 2015). NRCS soils classified as
alluvium might show areas with wetlands as opposed to just areas with floodplains containing
natural channels, as the soil samples for these areas would look very similar. The LIDAR
elevation represents the topography that the USRB has today and contains artificial features
including ditches and overpasses not present prior to the 1850s. However, the fact that various
data sets used show similar patterns for the configuration of the pre-settlement drainage network
suggests that they can be used to distinguish natural channels from drainage ditches. In order to
increase the accuracy and precision of these estimates, soil cores could be taken at various sub-
watersheds within the USRB. Areas of particular interest may include locations where the
various estimates place the pre-settlement channels in different places.
Prior to European settlement, we estimate that the channel network of the USRB would have
looked like the 1800s GLO survey and alluvial soil estimates (Figure 3). The channel network
was most likely expanding and covered about 60% of the basin (Figure 4). The significant
human modification to the drainage network of the USRB makes the configuration of the pre-
settlement channels necessary to study the natural evolution of the network, and the transition of
the basin from a glacial to fluvial landscape. In particular the locations of the natural channel
heads are an important component to understanding the hydrology of the landscape
(Montgomery and Dietrich, 1989). We would expect to find the natural channel heads in areas
near 1800s surveyed streams, alluvial soils, and in areas with relatively low elevation and high
slope.
5. 5
Figures
Figure 1. The Upper Sangamon River Basin (USRB) located in east central Illinois.
Shown with approximate locations of incised valleys, flat uplands, and moraines.
Figure 2. 1 meter contour lines made from a LIDAR digital elevation model, and the modern channel
network shown in three areas within the USRB. A clearly unchannelized area shown in A. An area that is
unclear whether it may have natural channels shown in B. An area with natural channels shown in C.
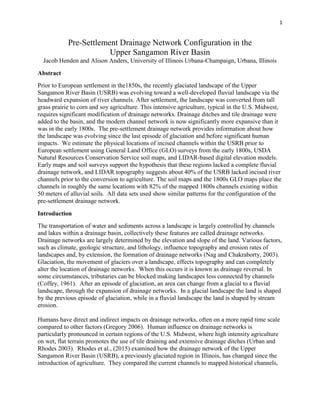
6. 6
Figure 3. Modern channel network of the Upper Sangamon River Basin (USRB) derived from U.S. Geological
Survey topographic maps cross referenced with 2011 aerial imagery shown in A, 1800s General Land Office surveyed
channels shown in B, and alluvial soils from USDA National Resource Conservation Soil maps shown in C.
7. 7
Acknowledgments
We thank the National Great Rivers Research and Education Center for providing funding for
this project, Rodger Windhorn and Dave Grimely for advice in interpreting NRCS soil maps, and
Quinn Lewis for providing shapefiles of the mapped 1800s and modern channel networks used
for analysis.
Figure 4. Areas in the Upper Sangamon River Basin (USRB) with no natural channels based on
estimates derived from LIDAR topography shown in comparison to locations of 1800s General Land
Office Surveyed Channels shown in A, in comparison to alluvial soils from USDA National Resource
Conservation Soil Maps shown in B, and in comparison to the modern channel network derived from
U.S. Geological Survey topographic maps cross referenced with 2011 aerial imagery shown in C.
8. 8
Literature Cited
Anderson, S. P., Bales, R. C., & Duffy, C. J. (2008). Critical zone observatories: building a
network to advance interdisciplinary study of Earth surface processes. Mineralogical
Magazine, 72(1), 7-10.
Coffey, G. N. (1961). Major preglacial, Nebraskan and Kansan glacial drainages in Ohio,
Indiana, and Illinois. Ohio J. Sci, 61(5), 295-313.
Gregory, K. J. (2006). The human role in changing river channels. Geomorphology, 79(3), 172-
191.
Hooke, R. (1999). Spatial distribution of human geomorphic activity in the United States:
comparison with rivers. Earth Surface Processes and Landforms, 24(8), 687-692.
Illinois Department of Natural Resources, 1999a. Upper Sangamon River Area Assessment,
Volume 1: Geology, Champaign, IL
Illnois Department of Natural Resources, 1999c. Upper Sangamon River Assessment, Volume 3,
Living Resources. , Champaign, IL
Montgomery, D. R., & Dietrich, W. E. (1989). Source areas, drainage density, and channel
initiation. Water Resources Research, 25(8), 1907-1918.
Nag, S. K., & Chakraborty, S. (2003). Influence of rock types and structures in the development
of drainage network in hard rock area. Journal of the Indian Society of Remote Sensing,
31(1), 25-35.
Rhoads, B. L., Lewis, Q. W., & Andresen, W. (2015). Historical changes in channel network
extent and channel planform in an intensively managed landscape: Natural versus
human-induced effects. Geomorphology.
Stiff, B. J., & Hansel, A. K. (2004). Quaternary glaciations in Illinois. Quaternary glaciations:
extent and chronology, 2, 71-82.
Urban, M. A., & Rhoads, B. L. (2003). Catastrophic human-induced change in stream-channel
planform and geometry in an agricultural watershed, Illinois, USA. Annals of the
Association of American Geographers, 93(4), 783-796.