Concept note on Client Oriented Provider's Efficiency (COPE) 4_eu_05.2008Deepak TIMSINA
The first proposal ever drafted, to Delegation of the European Commission to Nepal, during my professional career; scored 82% in technical evaluation, and was rejected. It led to encouragement for number of successful proposals/concept notes.
This document discusses how traditional and new media can be used to promote health literacy among school-aged children in Singapore. It outlines various health campaigns conducted through television, websites, podcasts and other channels. Evaluation found these multi-channel efforts were effective at increasing awareness of issues like childhood injuries, nutrition and myopia. Both direct and subtle messaging through consistent reinforcement across different media can influence children's health behaviors and thinking.
The document provides an overview of the National Digital Health Mission (NDHM) in India. It discusses the global perspective on digital health, the conceptualization and vision of NDHM in India. The objectives of NDHM are to establish digital health infrastructure and standards to create a unified national digital health ecosystem. This is expected to provide benefits like digital health records, continuum of care, easier access to healthcare services, and better evidence-based policymaking. The key components or "building blocks" of NDHM include the Health ID, Healthcare Professionals Registry, Health Facility Registry, and Personal Health Record system.
Essential Package of Health Services Country Snapshot: BangladeshHFG Project
Resource Type: Brief
Authors: Jenna Wright
Published: July 2015
Resource Description:
An Essential Package of Health Services (EPHS) can be defined as the package of services that the government is providing or is aspiring to provide to its citizens in an equitable manner. Essential packages are often expected to achieve multiple goals: improved efficiency, equity, political empowerment, accountability, and altogether more effective care. There is no universal essential package of health services that applies to every country in the world.
This country snapshot is one in a series of 24 snapshots as part of an activity looking at the Governance Dimensions of Essential Packages of Health Services in the Ending Preventable Child and Maternal Death priority countries. The snapshot explores several important dimensions of the EPHS in the country, such as how government policies contribute to the service coverage, population coverage, and financial coverage of the package. Each country snapshot includes annexes that contain further information about the EPHS.
The government of Bangladesh first defined an “Essential Service Package” in 1998, then updated it in 2003 and renamed it the “Essential Service Delivery” Package. This package is defined at a high level, and includes: child health care, safe motherhood, family planning, menstrual regulation, post-abortion care, and management of sexually transmitted infections; communicable diseases (including tuberculosis, malaria, others); emerging noncommunicable diseases (diabetes, mental health conditions, cardiovascular diseases); limited curative care and behavior change communication; and nutrition.
- India has experienced rapid population growth and is now the second most populous country in the world with over 1.3 billion people.
- India implemented various population policies and programs over time to try to control its population growth rate, starting with voluntary family planning programs and eventually introducing some coercive policies during the Emergency period from 1975-1977.
- Population policies in India have aimed to reduce fertility rates and encourage family planning through various means like education programs, expanding access to contraceptives, manipulating incentives, and at times coercive policies like compulsory sterilization, though coercion is no longer used after the Emergency period.
Schools play a critical role in supporting student health and wellness. They can provide learning opportunities to reinforce healthy behaviors through wellness policies, practices, and effective health education curricula. The Whole School, Whole Community, Whole Child model promotes positive health behaviors and lessens negative ones by accounting for individual, family, school, and community influences on student health and learning. Schools can assess their programs using CDC tools to identify strengths and areas for improvement.
The National Health Policy 2017 sets ambitious targets for reducing infant and maternal mortality rates, and eliminating diseases. However, many of these targets are the same as those set in 2002 which were not achieved. The 2017 policy has now pushed the deadlines to 2019 or later. It aims to achieve universal health coverage through increasing access, quality and lowering costs. A key focus is preventive healthcare and increasing public health spending to 2.5% of GDP. Fact-checking found the 2017 policy recycled many 2002 targets that were already missed.
The document summarizes key findings from the District Level Household and Facility Survey (DLHS-3) conducted in India in 2007-2008. Some key points:
1) DLHS-3 was the third in a series of surveys aimed at providing district-level data on reproductive and child health indicators. It covered over 7 lakh households across India.
2) The survey found that institutional deliveries increased to 47% nationally from 41% in the previous survey, though home deliveries remained the majority. Antenatal care coverage also increased but remained below targets.
3) The document provides comparisons of indicators between rural and urban areas as well as between India overall and the state of Haryana
India has had mixed success in achieving the Millennium Development Goals. Infant and under-five mortality have sharply declined putting India on track to meet those targets. However, hunger remains a major challenge. Maternal mortality also remains high despite increased access to healthcare. While programs have helped reduce malaria and tuberculosis, childhood immunization rates remain low. Overall progress has been slowed by high dropout rates in primary education and low female participation in the economy and government. With 168 days remaining, India must learn from past challenges to make progress on the remaining unmet goals.
The document summarizes India's POSHAN Abhiyaan nutrition program. It outlines the program's goals of reducing stunting, undernutrition, and anemia among children and women. It details the program's large scale, with coverage of over 100 million beneficiaries across India. It also describes the program's key pillars which include convergence of sectors, behavior change communication, capacity building, and use of technology for monitoring.
National digital health mission- Dr. GurmeetYogesh Arora
The National Digital Health Blueprint outlines India's vision for a digital health ecosystem to support universal health coverage through digital systems and infrastructure. Key objectives include establishing digital health records for citizens, national health registries, and adopting open standards. The federated architecture separates data storage across national, state, and local levels while citizens maintain control over their health data. Building blocks like the Unique Health ID, electronic health records, and health directories will enable sharing of health information based on citizen consent for improved healthcare access, delivery and outcomes.
The document discusses India's growing burden of non-communicable diseases like cardiovascular diseases, cancer, diabetes, and stroke. It outlines the National Program for Prevention and Control of Cancer, Diabetes, Cardiovascular Diseases and Stroke (NPCDCS) which aims to integrate NCD interventions into primary healthcare and provide prevention, early diagnosis, management and capacity building services. The strategies proposed include prevention through behavior change, early diagnosis, treatment, capacity building, and monitoring and evaluation. Services will be provided at sub-centers, community health centers and district hospitals, including health promotion, screening, management, home-based care and referrals.
The document outlines a social and behavioral change communication strategy to improve nutrition in Ethiopia. The goal is to improve nutrition for women, children, and adolescent girls. Key objectives include improving dietary and feeding practices, increasing demand for nutrition services, and fostering gender-equitable behaviors. The strategy involves qualitative research, stakeholder input, and focuses on behavior change at the household and community levels through a "whole household" approach and clustering behaviors into pathways. Priority behaviors targeted include maternal nutrition practices like antenatal care and supplementation as well as infant and young child feeding.
this ppt show about the national rural health mission and about the benefit of health program run by the govt. of India to improve the health facilities among the people to get the maximum benefit from the health policies.
The document discusses the evolution of reproductive, maternal, newborn, child and adolescent health (RMNCH+A) programs in India from the 1950s to present. It outlines the key historical programs and approaches, including the shift from a family planning focus to a more integrated reproductive health approach. The current RMNCH+A strategy aims to reduce maternal and child mortality by emphasizing continuum of care across the lifecycle through high impact interventions at various levels of the health system.
Chronic non-communicable diseases (NCDs) such as cardiovascular disease, cancer, and diabetes now account for over half of deaths in India and place a large economic burden. The National Programme for Prevention and Control of Cancer, Diabetes, CVD and Strokes (NPCDCS) aims to address NCDs through health promotion, screening, diagnosis, management, and capacity building integrated into primary healthcare. Current programs have had limited implementation; a comprehensive and widespread approach is still needed to reduce the growing NCD burden in India.
This document discusses social marketing and its applications to family welfare and influencing voluntary behavior. Social marketing applies commercial marketing techniques to analyze, plan, execute, and evaluate programs to promote products and services. It ensures consumer consultation to understand needs, likes/dislikes, and satisfaction. The key goals of social marketing for family welfare are to increase outlets for condoms, pills, ORS, etc.; improve quality; and enhance public-private partnerships. Social marketing addresses the marketing mix - product, price, place, promotion, and policy environment. The focus is learning what people want in terms of behavior and services. Examples are provided of how social marketing has increased condom and pill use in India and helped lower fertility rates.
The document provides information on the National Family Health Survey (NFHS-3) conducted in India in 2005-2006. Some key points:
- NFHS-3 was conducted to provide estimates on family welfare, maternal and child health, and nutrition indicators. It also covered new topics like HIV prevalence.
- Over 124,000 women and 74,000 men were interviewed across India. In Haryana, over 2,700 women and 1,000 men were interviewed.
- The survey found that literacy rates, access to healthcare, and use of family planning methods had increased since the previous surveys, though gaps remained between urban and rural areas.
- Maternal and child health indicators like anten
Sexual and reproductive health and rights Shikha Basnet
1) Sexual and reproductive health services are essential in humanitarian and fragile settings to reduce unintended pregnancies, unsafe abortions, and maternal deaths. However, these services often face barriers to access during crises.
2) The Minimum Initial Service Package (MISP) for sexual and reproductive health aims to immediately implement lifesaving services at the onset of emergencies. It includes preventing sexual violence, reducing HIV transmission, and providing contraceptives and maternal/newborn healthcare.
3) Following the 2015 Nepal earthquake, the MISP was activated and services like clean delivery kits, medical camps, and outreach clinics helped address the sexual and reproductive health needs of those affected. Challenges to implementation included
The report provides an overview of the global burden of noncommunicable diseases (NCDs) such as cardiovascular diseases, cancers, diabetes, and chronic respiratory diseases. It finds that NCDs killed 36 million people in 2008, with nearly 80% of NCD deaths occurring in low- and middle-income countries. Risk factors like tobacco use, unhealthy diet, physical inactivity, and harmful alcohol use are major contributors to the NCD burden. The report analyzes population-wide and individual interventions that can effectively reduce NCD mortality and morbidity, and calls for urgent action to address the growing NCD epidemic globally.
This document provides an overview of the Affordable Care Act (ACA) for Navigators and in-person assisters. It discusses the history and goals of health care reform in the United States. Key points of the ACA include expanding coverage to 32 million Americans, creating health insurance exchanges, offering premium subsidies, and expanding Medicaid eligibility. The presentation reviews eligibility and enrollment processes, plan options, and the individual mandate to have coverage. It aims to help assisters understand and explain the ACA to consumers.
Social marketing applies commercial marketing strategies to promote public health behaviors. It uses a wide range of health communication strategies based on mass media, audience segmentation, and tailored messaging. Key trends in social marketing include using digital media, adapting commercial marketing techniques, and messaging across a continuum from prevention to promotion. Social marketing can change health behaviors but the effects are often small. Effective social marketing considers the problem, target audience, desired behavior change, and strategies for change. Challenges include message clutter, complex health topics, and counter-marketing difficulties.
This document provides key health indicators for the state of Madhya Pradesh from the National Family Health Survey (NFHS-4) conducted in 2015-16. Some key findings include:
- Literacy rates and institutional delivery have increased but remain lower in rural areas.
- Child immunization coverage has improved but is still not universal.
- Stunting, wasting and underweight in children under 5 remain major issues, especially in rural areas.
- Unmet need for family planning and modern contraceptive use have declined slightly but are still prevalent.
Taiwan has achieved universal health coverage with a service coverage index of 85, on par with other high coverage countries like Canada, South Korea, and Japan. Key health indicators for Taiwan include a 97.7% antenatal care coverage rate, 70% tuberculosis treatment effectiveness, and 97.8% coverage for childhood immunizations. Taiwan also has strong programs for non-communicable diseases like diabetes, with quality targets met by over 90% of patients and extensive primary and secondary prevention programs for cancer.
This document analyzes global maternal mortality rates from 1980-2008 using improved statistical methods. It finds that the global maternal mortality ratio declined from 380 maternal deaths per 100,000 live births in 1980 to 342,900 deaths in 2008. However, progress was uneven, with over 50% of maternal deaths occurring in just 6 countries. Improving measurement of maternal mortality through better vital registration systems and repeated collection of household survey data could help accelerate progress towards reducing maternal mortality.
National Health Profile 2018 ; Guiding Information to accomplish UHC and tho...Rama shankar
- National Health Profile 2018 provides guiding information to accomplish Universal Health Coverage and Sustainable Development Goals in India.
- It presents demographic indicators such as population growth, density and distribution. Health status indicators show communicable diseases account for majority of morbidity and mortality. Maternal and child health indicators point to gaps in service coverage and outcomes.
- Health financing is low at 1.1% of GDP with two-thirds of expenditure being incurred by states. Out-of-pocket expenditure remains high indicating lack of financial risk protection.
The Big Picture: Trends In Protective Behaviour Among Young WomenIDS
1) The document analyzes trends in protective sexual behavior among young women in Africa based on Demographic and Health Survey data from 18 countries.
2) It finds that condom use among single, sexually active young women has increased substantially over time, with the median rising from 18.5% in 1997 to 31.2% in 2003.
3) Dual use of condoms for pregnancy and HIV prevention is around 58.5% on average, while consistent use among those using condoms is 81.3%, with some differences between urban/rural and education levels.
Working multisectorally to improve maternal and child nutrition in India: Odi...POSHAN-IFPRI
The document summarizes Odisha's strategies for improving maternal and child nutrition through multisectoral collaboration. Key strategies include strengthening delivery systems like ICDS, collaborating across sectors like health and agriculture, decentralizing nutrition programs through self-help groups, and targeting vulnerable groups in high burden districts through district-specific planning. Mechanisms for convergence include nutrition councils, joint monitoring committees, and engaging communities through mothers' committees and growth monitoring. The impact of these efforts is seen in improved indicators for infant and young child feeding practices, immunization coverage, and reduced malnutrition according to survey data.
SM2015 is an ambitious project with the Ministry of Health and local support. This presentation outlines the design and activities around the data collection and analysis of the evaluation, as well as the results, conclusions, and future activities.
Quality of care in obstetric services in rural South India-evidence from two ...IPHIndia
Over a decade between two studies in Ramnagaram District, utilization and quality of obstetric care improved in some areas but gaps remain. The percentage of women receiving at least 4 antenatal visits and giving birth in institutions increased from 6% to 64% and 35% to 82%, respectively. However, planning for emergencies remained low and women still lacked companionship during delivery and felt uncomfortable asking questions of providers. The document recommends further steps like improving 24/7 primary health centers, communication between providers and women, and routine postpartum care for mothers.
The document provides an overview of contraceptive methods in India. It discusses the history of contraception from ancient times to modern advances. Key facts about the contraceptive scenario in India are presented from surveys conducted in 2005-2006. The document then classifies and describes various contraceptive methods including barrier methods like male and female condoms, as well as intrauterine devices, hormonal methods, and permanent sterilization methods. Advanced methods still in development are also briefly mentioned.
This document summarizes the results of a clinical audit and confidential inquiry of caesarean section indications at a tertiary health care center in Maharashtra, India. The caesarean section rate was found to be 36.8%, higher than WHO standards. According to NICE guidelines, 60% of caesarean sections were emergency or urgent cases, while the rest were elective. Fetal bradycardia was the most common indication for emergency caesarean sections. Previous caesarean sections with inadequate pelvis was a common reason for elective caesarean sections. The confidential inquiry found that 79.02% of caesarean section indications were genuine, while 20.98%
This document summarizes the results of a vaccination coverage survey conducted after a measles mass vaccination campaign in rural DRC in 2015. The survey found that 64% of children were vaccinated for measles based on vaccination cards, and 85% based on cards or oral reports. Reasons for non-vaccination included lack of information, absence during vaccination, and financial barriers. Higher vaccination coverage was associated with guardians over age 25, transportation access, and social mobilization promotion of the campaign. The mass vaccination campaign did not achieve 95% coverage in the region due to population mobility. Supplementary vaccination efforts are recommended when populations return from seasonal displacement.
Low 3-dose completion and missed opportunities for the HPV vaccine in Utahdylanturner22
This document summarizes research on HPV vaccine uptake in Utah. It finds that while HPV vaccination rates have increased in Utah, the 3-dose completion rate remains below the national average at 24.1%. Focus groups with providers and parents in Utah identified some factors contributing to this, including missed opportunities to vaccinate, the need for multiple doses making completion challenging, and a lack of parent education. Interventions like improved provider recommendation and reminder systems may help increase completion rates in Utah. The research aims to better understand factors influencing HPV vaccination to guide future initiatives to reduce cervical cancer burden.
FedCASIC 2017: Childhood Immunization Attitudes and Behavior: National Survey...Lew Berman
The document summarizes key findings from the Childhood Immunization Attitudes and Behavior Survey (ChIMPS) conducted in 2016 using a national mobile panel. Some key findings include:
- Over 95% of respondents across racial/ethnic groups reported their child received all recommended vaccines.
- 61.8% of Caucasian respondents reported their child received the flu vaccine since July 2016, compared to over 75% of other racial/ethnic groups.
- 20-25% of respondents across racial/ethnic groups reported ever delaying a recommended vaccine, while 3.6-14.3% decided not to give their child a vaccine.
- Over 90% of respondents across racial/eth
This document summarizes information about stillbirths globally and in Australia. Some key points:
- There are over 2.6 million stillbirths globally each year, with 10 countries accounting for two-thirds of stillbirths in 2015.
- In Australia, the stillbirth rate after 28 weeks is 2.7/1000, ranked 16th internationally, and the reduction in stillbirth rate is only 1.4%, ranked 35th.
- Major risk factors for stillbirth include maternal obesity, age over 35, smoking, and decreased fetal movements. Guidelines have been introduced in Australia to address monitoring of fetal movements but their impact requires further evaluation.
- Many stillbirths remain unexplained, indicating gaps
RESULTS ON UTILIZATION OF INSECTICIDE TREATED MOSQUITO NETS IN KISAUNI MOMBASAStanford Kapere
This document outlines a research project on the utilization of insecticide-treated nets among families with children under five years old in Kisauni, Kenya. The study aims to determine the level of knowledge, attitudes, and factors affecting the use of insecticide-treated nets. A cross-sectional study using questionnaires and observations will collect data on net ownership, use, and related knowledge from a sample of households. Preliminary results show over half of households own at least one net, but net use among young children is still low, especially in rural areas. The study recommends improving distribution to vulnerable groups and education programs to increase proper net use.
The document provides key findings from Vietnam's 2014 Multiple Indicator Cluster Survey (MICS). It includes summaries of 10 topics: child mortality, nutrition, child health, water and sanitation, reproductive health, child development, literacy and education, child protection, HIV/AIDS, and access to media/ICT. For each topic, it highlights 2-6 relevant indicators and provides data on national averages as well as breakdowns by region, wealth, and ethnicity. The objective is to disseminate timely findings on Millennium Development Goal and MICS indicators to evaluate Vietnam's progress.
South Africa Demographic and Health Survey 2016: Key Indicators Report, 2016Statistics South Africa
The South African Demographic and Health Survey is a sample survey that was conducted by Statistics South Africa (Stats SA) and the South African Medical Research Council on behalf of the National Department of Health. The survey collected data from sampled households in the country between June and November 2016, with variables measuring health, fertility, nutrition and family planning, among others. The results of the survey will be used to measure the health status of South Africans as well as the coverage and quality of selected health programmes. The survey will also provide estimates on child and maternal mortality, fertility rates, and the prevalence of conditions such as diabetes and hypertension, among others.
Download the full report here: www.statssa.gov.za
Day 2 - PCI - Strengthening Nutrition-related ActionsPOSHAN
The document discusses strategies to strengthen nutrition actions in India. It outlines interventions implemented by JEEViKA in Bihar to improve complementary feeding practices, including behavior change communication sessions, feeding demonstrations, home visits, and community events. Evaluation found the interventions improved minimum dietary diversity and minimum acceptable diet indicators. Concurrent measurement confirmed scale-up was also effective. Additionally, an independent survey showed significant improvements in these complementary feeding indicators in blocks where JEEViKA implemented the package of interventions.
This document summarizes a study on rural health care in Thoubal District, Manipur, India. It finds that while India's constitution recognizes health as a primary duty, rural populations still lack adequate access to health care due to factors like poverty, lack of infrastructure, and social/psychological barriers. The study aims to evaluate health care facilities and services in Thoubal District, examine factors influencing access to primary health care, and assess the quality of services provided by health care workers to rural communities. It analyzes key health indicators for Manipur from the National Family Health Survey and finds that while material well-being is low, Manipur has relatively good public health outcomes, such as low infant mortality.
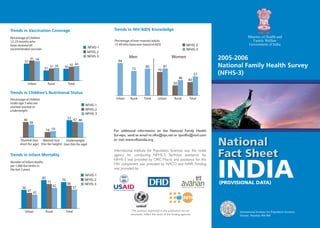
1. 2005-2006
National Family Health Survey
(NFHS-3)
NFHS-1
NFHS-2
Percentage of children
12-23 months who
have received all
recommended vaccines
Urban Rural Total
NFHS-3
36
44
58
39
61
37
51
31
42
NFHS-2
Percentage of children
under age 3 who are
stunted,wasted,or
underweight
Stunted (too
short for age)
Underweight
(too thin for age)
NFHS-3
Wasted (too
thin for height)
46
16
52
NFHS-1
19
38
47 46
NFHS-1
NFHS-2
Number of infant deaths
per 1,000 live births in
the last 5 years
Urban Rural Total
NFHS-3
57
68
79
62
73
4247
56
85
NFHS-2
Percentage of ever-married adults
15-49 who have ever heard of AIDS
Urban Rural Total
NFHS-3
Urban Rural Total
Men Women
94
73
80 81
46
57
40
70
30
Trends in Vaccination Coverage Trends in HIV/AIDS Knowledge
The opinions expressed in this publication do not
necessarily reflect the views of the funding agencies.
Trends in Children’s Nutritional Status
Trends in Infant Mortality
For additional information on the National Family Health
Surveys, send an email to nfhs@iips.net or iipsnfhs@vsnl.com
or visit www.nfhsindia.org
International Institute for Population Sciences was the nodal
agency for conducting NFHS-3. Technical assistance for
NFHS-3 was provided by ORC Macro and assistance for the
HIV component was provided by NACO and NARI. Funding
was provided by:
National
Fact Sheet
International Institute for Population Sciences
Deonar, Mumbai 400 088
Ministry of Health and
Family Welfare
Government of India
INDIA(PROVISIONAL DATA)
2. KEY FINDINGS FROM NFHS-3: INDIA
The 2005-2006 National Family Health Survey (NFHS-3),
the third in the NFHS series of surveys, provides infor-
mation on population, health and nutrition in India and
each of its 29 states. The survey is based on a sample of
households which is representative at the national and
state levels. NFHS-3 provides trend data on key indi-
cators and includes information on several new topics,
such as HIV/AIDS-related behaviour and the health of
slum populations. For the first time, NFHS-3 also pro-
vides information on men and unmarried women. In ad-
dition, HIV prevalence is measured at the national level
and for selected states. This fact sheet presents provi-
sional information on key indicators and trends at the
national level. The NFHS-3 fieldwork was conducted by
18 Research Organizations between December 2005
and August 2006.
Households 109,041 97.7
Women (age 15-49) 124,385 94.5
Men (age 15-54) 74,369 87.1
Population and Household Profile
Total Urban Rural
Population age 6+ that is literate (%) 67.6 81.0 61.3
Households by residence (%) 100.0 32.6 67.4
Mean household size 4.8 4.6 4.9
Percentage of households that:
Have electricity 67.9 93.1 55.7
Use piped drinking water 42.0 71.0 27.9
Have access to a toilet facility 44.5 83.1 25.9
Live in a pucca house 41.4 74.1 25.5
Have a motorized vehicle 18.6 31.9 12.1
Have a television 44.2 73.2 30.1
Own agricultural land 45.6 19.0 58.5
Number
interviewed
Response
rate
Percent distribution of respondents 15-49 by highest
level of education
Women
Men
No
education
< 8 years
complete
8-9 years
complete
10 years
complete
and above
142341
212718 35
22
Women 15-49 Men 15-49
Percentage with
regular exposure
to media (TV,
radio,or newspaper
atleast once a
week)
Urban Rural Total
87
93
54
73
65
80
NFHS-1
NFHS-2
Urban Rural Total
NFHS-364
56
48
41
51
37
58
45
53
NFHS-1
NFHS-2
Urban Rural Total
NFHS-3
91
72
77
66
86
60
84
59
65
NFHS-1
NFHS-2
Urban Rural Total
NFHS-369
31 26
34
41
58
17
65
25
Education
Media Exposure
Trends in Fertility
Trends in Contraceptive Use (%)
[Currently married women 15-49]
Trends in Any Antenatal Care (%)
[Births in the last 3 years]
Trends in Institutional Deliveries (%)
[Births in the last 3 years]
Total
fertility
rate
NFHS-1 NFHS-2 NFHS-3
3.4
2.9 2.7
3. NFHS-3
(2005-06) Urban Rural
No
education2
< 8 years
complete2
8-9 years
complete2
10 years
complete
and above2
NFHS-2
(1998-99)
NFHS-1
(1992-93)
Marriage and Fertility
1. Women age 20-24 married by age 18 (%) 44.5 28.1 52.5 71.6 55.1 35.8 12.8 50.0 54.2
2. Men age 25-29 married by age 21 (%) 29.3 16.7 36.5 50.5 37.1 28.8 15.0 na na
3. Total fertility rate (children per woman) 2.68 2.07 2.98 3.55 2.49 2.23 1.91 2.85 3.39
4. Women age 15-19 who were already mothers or pregnant at the time of the survey (%) 16.0 8.7 19.1 32.6 20.1 8.5 5.2 na na
5. Median age at first birth for women age 25-49 19.8 20.9 19.3 18.7 19.4 20.8 23.6 19.3 19.4
6. Married women with 2 living children wanting no more children (%) 83.2 88.9 79.9 73.3 85.1 87.1 91.4 72.4 59.7
6a. Two sons 89.9 92.1 88.6 83.5 91.8 93.0 95.0 82.7 71.5
6b. One son, one daughter 88.1 92.8 85.3 79.0 90.3 91.2 94.7 76.4 66.0
6c. Two daughters 62.1 74.7 54.4 48.0 61.4 66.2 77.5 47.0 36.9
Family Planning (currently married women, age 15–49)
Current use
7. Any method (%) 56.3 64.0 53.0 52.1 60.3 58.5 61.1 48.2 40.7
8. Any modern method (%) 48.5 55.8 45.3 45.7 53.1 48.1 50.3 42.8 36.5
8a. Female sterilization (%) 37.3 37.8 37.1 39.7 43.1 33.5 26.0 34.1 27.4
8b. Male sterilization (%) 1.0 1.1 1.0 1.2 1.0 0.7 0.9 1.9 3.5
8c. IUD (%) 1.8 3.4 1.1 0.6 1.2 2.5 5.2 1.6 1.9
8d. Pill (%) 3.1 3.9 2.8 1.9 4.0 5.1 4.0 2.1 1.2
8e. Condom (%) 5.3 10.0 3.3 2.3 3.9 6.4 14.7 3.1 2.4
Unmet need for family planning
9. Total unmet need (%) 13.2 10.0 14.6 14.0 12.2 13.9 11.7 15.8 19.5
9a. For spacing (%) 6.3 4.6 7.1 5.6 6.7 8.0 6.6 8.3 11.0
9b. For limiting (%) 6.8 5.3 7.5 8.4 5.5 6.0 5.0 7.5 8.5
Maternal and Child Health
Maternity care (for births in the last 3 years)
10. Mothers who had at least 3 antenatal care visits for their last birth (%) 50.7 73.8 42.8 29.8 59.1 67.3 85.3 44.2 43.9
11. Mothers who consumed IFA for 90 days or more when they were pregnant with their
last child (%) 22.3 34.5 18.1 9.5 23.7 30.3 49.4 na na
12. Births assisted by a doctor/nurse/LHV/ANM/other health personnel (%)1 48.3 75.2 39.1 27.2 53.9 66.7 86.6 42.4 33.0
13. Institutional births (%)1 40.7 69.4 31.1 19.8 45.7 57.8 80.6 33.6 26.1
14. Mothers who received postnatal care from a doctor/nurse/LHV/ANM/other health
personnel within 2 days of delivery for their last birth (%)1 36.4 60.7 28.1 17.6 40.3 49.7 73.3 na na
Child immunization and vitamin A supplementation1
15a. Children 12-23 months fully immunized (BCG, measles, and 3 doses each of polio/DPT) (%) 43.5 57.5 38.6 26.1 50.1 59.6 71.0 42.0 35.5
15b. Children 12-23 months who have received BCG (%) 78.2 86.9 75.1 64.7 85.3 90.9 96.5 71.6 62.2
15c. Children 12-23 months who have received 3 doses of polio vaccine (%) 78.2 83.1 76.5 74.1 77.7 82.4 87.0 62.8 53.6
15d. Children 12-23 months who have received 3 doses of DPT vaccine (%) 55.3 69.1 50.4 36.9 62.4 73.0 83.5 55.1 51.7
15e. Children 12-23 months who have received measles vaccine (%) 58.8 71.7 54.2 41.0 66.1 74.9 86.1 50.7 42.2
16. Children age 12-35 months who received a vitamin A dose in last 6 months (%) 21.0 22.7 20.4 15.5 23.4 27.2 28.6 na na
Treatment of childhood diseases (children under 3 years)1
17. Children with diarrhoea in the last 2 weeks who received ORS (%) 26.2 32.7 24.0 18.2 26.3 30.6 43.4 26.9 17.8
18. Children with diarrhoea in the last 2 weeks taken to a health facility (%) 58.0 65.3 55.6 51.3 59.2 64.5 69.1 65.3 61.9
19. Children with acute respiratory infection or fever in the last 2 weeks taken to a health
facility (%) 64.2 78.1 59.9 57.5 65.1 72.0 75.8 na na
Child Feeding Practices and Nutritional Status of Children1
20. Children under 3 years breastfed within one hour of birth (%) 23.4 28.9 21.5 15.9 27.2 31.7 33.0 16.0 9.5
21. Children age 0-5 months exclusively breastfed (%) 46.3 40.3 48.3 48.1 46.7 46.6 40.8 na na
22. Children age 6-9 months receiving solid or semi-solid food and breastmilk (%) 55.8 62.1 53.8 49.1 54.7 61.2 69.6 na na
23. Children under 3 years who are stunted (%) 38.4 31.1 40.7 46.7 38.0 31.7 20.8 45.5 na
24. Children under 3 years who are wasted (%) 19.1 16.9 19.8 21.7 19.1 16.7 13.8 15.5 na
25. Children under 3 years who are underweight (%) 45.9 36.4 49.0 55.2 44.6 40.1 26.3 47.0 51.5
Nutritional Status of Ever-Married Adults (age 15-49)
26. Women whose Body Mass Index is below normal (%) 33.0 19.8 38.8 40.9 31.8 27.1 16.2 36.2 na
27. Men whose Body Mass Index is below normal (%) 28.1 17.5 33.1 38.7 32.3 27.1 15.6 na na
28. Women who are overweight or obese (%) 14.8 28.9 8.6 7.6 15.5 20.3 30.7 10.6 na
29. Men who are overweight or obese (%) 12.1 22.2 7.3 3.9 7.8 11.5 23.6 na na
Anaemia among Children and Adults
30. Children age 6-35 months who are anaemic (%) 79.2 72.7 81.2 84.1 78.8 74.5 69.4 74.2 na
31. Ever-married women age 15-49 who are anaemic (%) 56.2 51.5 58.2 60.2 56.7 52.6 46.6 51.8 na
32. Pregnant women age 15-49 who are anaemic (%) 57.9 54.6 59.0 63.0 57.3 55.6 47.4 49.7 na
33. Ever-marrried men age 15-49 who are anaemic (%) 24.3 17.2 27.7 33.4 25.5 22.3 16.9 na na
Knowledge of HIV/AIDS among Ever-Married Adults (age 15-49)
34. Women who have heard of AIDS (%) 57.0 80.7 46.4 30.7 67.5 85.6 96.7 40.3 na
35. Men who have heard of AIDS (%) 80.0 94.2 73.0 50.7 78.2 92.6 98.3 na na
36. Women who know that consistent condom use can reduce the chances of getting
HIV/AIDS (%) 34.7 56.3 25.1 12.5 34.9 57.6 81.0 na na
37. Men who know that consistent condom use can reduce the chances of getting
HIV/AIDS (%) 68.1 85.6 59.5 33.9 62.8 82.0 93.2 na na
Women’s Empowerment
38. Currently married women who usually participate in household decisions (%) 52.5 61.4 48.5 51.3 50.9 50.6 58.9 na na
39. Ever-married women who have ever experienced spousal violence (%) 37.2 30.4 40.2 46.5 37.7 28.8 16.3 na na
na: not available
1. Based on the last 2 births in the 3 years before the survey; 2. For children, the education refers to the mother’s education. Children with missing information on the mother’s education are not included in the education columns.
Key Indicators from NFHS-3
INDIA EducationResidence
![KEY FINDINGS FROM NFHS-3: INDIA
The 2005-2006 National Family Health Survey (NFHS-3),
the third in the NFHS series of surveys, provides infor-
mation on population, health and nutrition in India and
each of its 29 states. The survey is based on a sample of
households which is representative at the national and
state levels. NFHS-3 provides trend data on key indi-
cators and includes information on several new topics,
such as HIV/AIDS-related behaviour and the health of
slum populations. For the first time, NFHS-3 also pro-
vides information on men and unmarried women. In ad-
dition, HIV prevalence is measured at the national level
and for selected states. This fact sheet presents provi-
sional information on key indicators and trends at the
national level. The NFHS-3 fieldwork was conducted by
18 Research Organizations between December 2005
and August 2006.
Households 109,041 97.7
Women (age 15-49) 124,385 94.5
Men (age 15-54) 74,369 87.1
Population and Household Profile
Total Urban Rural
Population age 6+ that is literate (%) 67.6 81.0 61.3
Households by residence (%) 100.0 32.6 67.4
Mean household size 4.8 4.6 4.9
Percentage of households that:
Have electricity 67.9 93.1 55.7
Use piped drinking water 42.0 71.0 27.9
Have access to a toilet facility 44.5 83.1 25.9
Live in a pucca house 41.4 74.1 25.5
Have a motorized vehicle 18.6 31.9 12.1
Have a television 44.2 73.2 30.1
Own agricultural land 45.6 19.0 58.5
Number
interviewed
Response
rate
Percent distribution of respondents 15-49 by highest
level of education
Women
Men
No
education
< 8 years
complete
8-9 years
complete
10 years
complete
and above
142341
212718 35
22
Women 15-49 Men 15-49
Percentage with
regular exposure
to media (TV,
radio,or newspaper
atleast once a
week)
Urban Rural Total
87
93
54
73
65
80
NFHS-1
NFHS-2
Urban Rural Total
NFHS-364
56
48
41
51
37
58
45
53
NFHS-1
NFHS-2
Urban Rural Total
NFHS-3
91
72
77
66
86
60
84
59
65
NFHS-1
NFHS-2
Urban Rural Total
NFHS-369
31 26
34
41
58
17
65
25
Education
Media Exposure
Trends in Fertility
Trends in Contraceptive Use (%)
[Currently married women 15-49]
Trends in Any Antenatal Care (%)
[Births in the last 3 years]
Trends in Institutional Deliveries (%)
[Births in the last 3 years]
Total
fertility
rate
NFHS-1 NFHS-2 NFHS-3
3.4
2.9 2.7](data:image/gif;base64,R0lGODlhAQABAIAAAAAAAP///yH5BAEAAAAALAAAAAABAAEAAAIBRAA7)