Download to read offline
![3D Imaging of MRI Enterography Data:
Turning My Body into an Interactive Video Game
• Videos of Me Giving Tours of My Organs:
– http://www.youtube.com/watch?v=9c4DtJ_L_Ps [3D video]
– www.theatlantic.com/magazine/archive/2012/07/the-measured-man/309018/
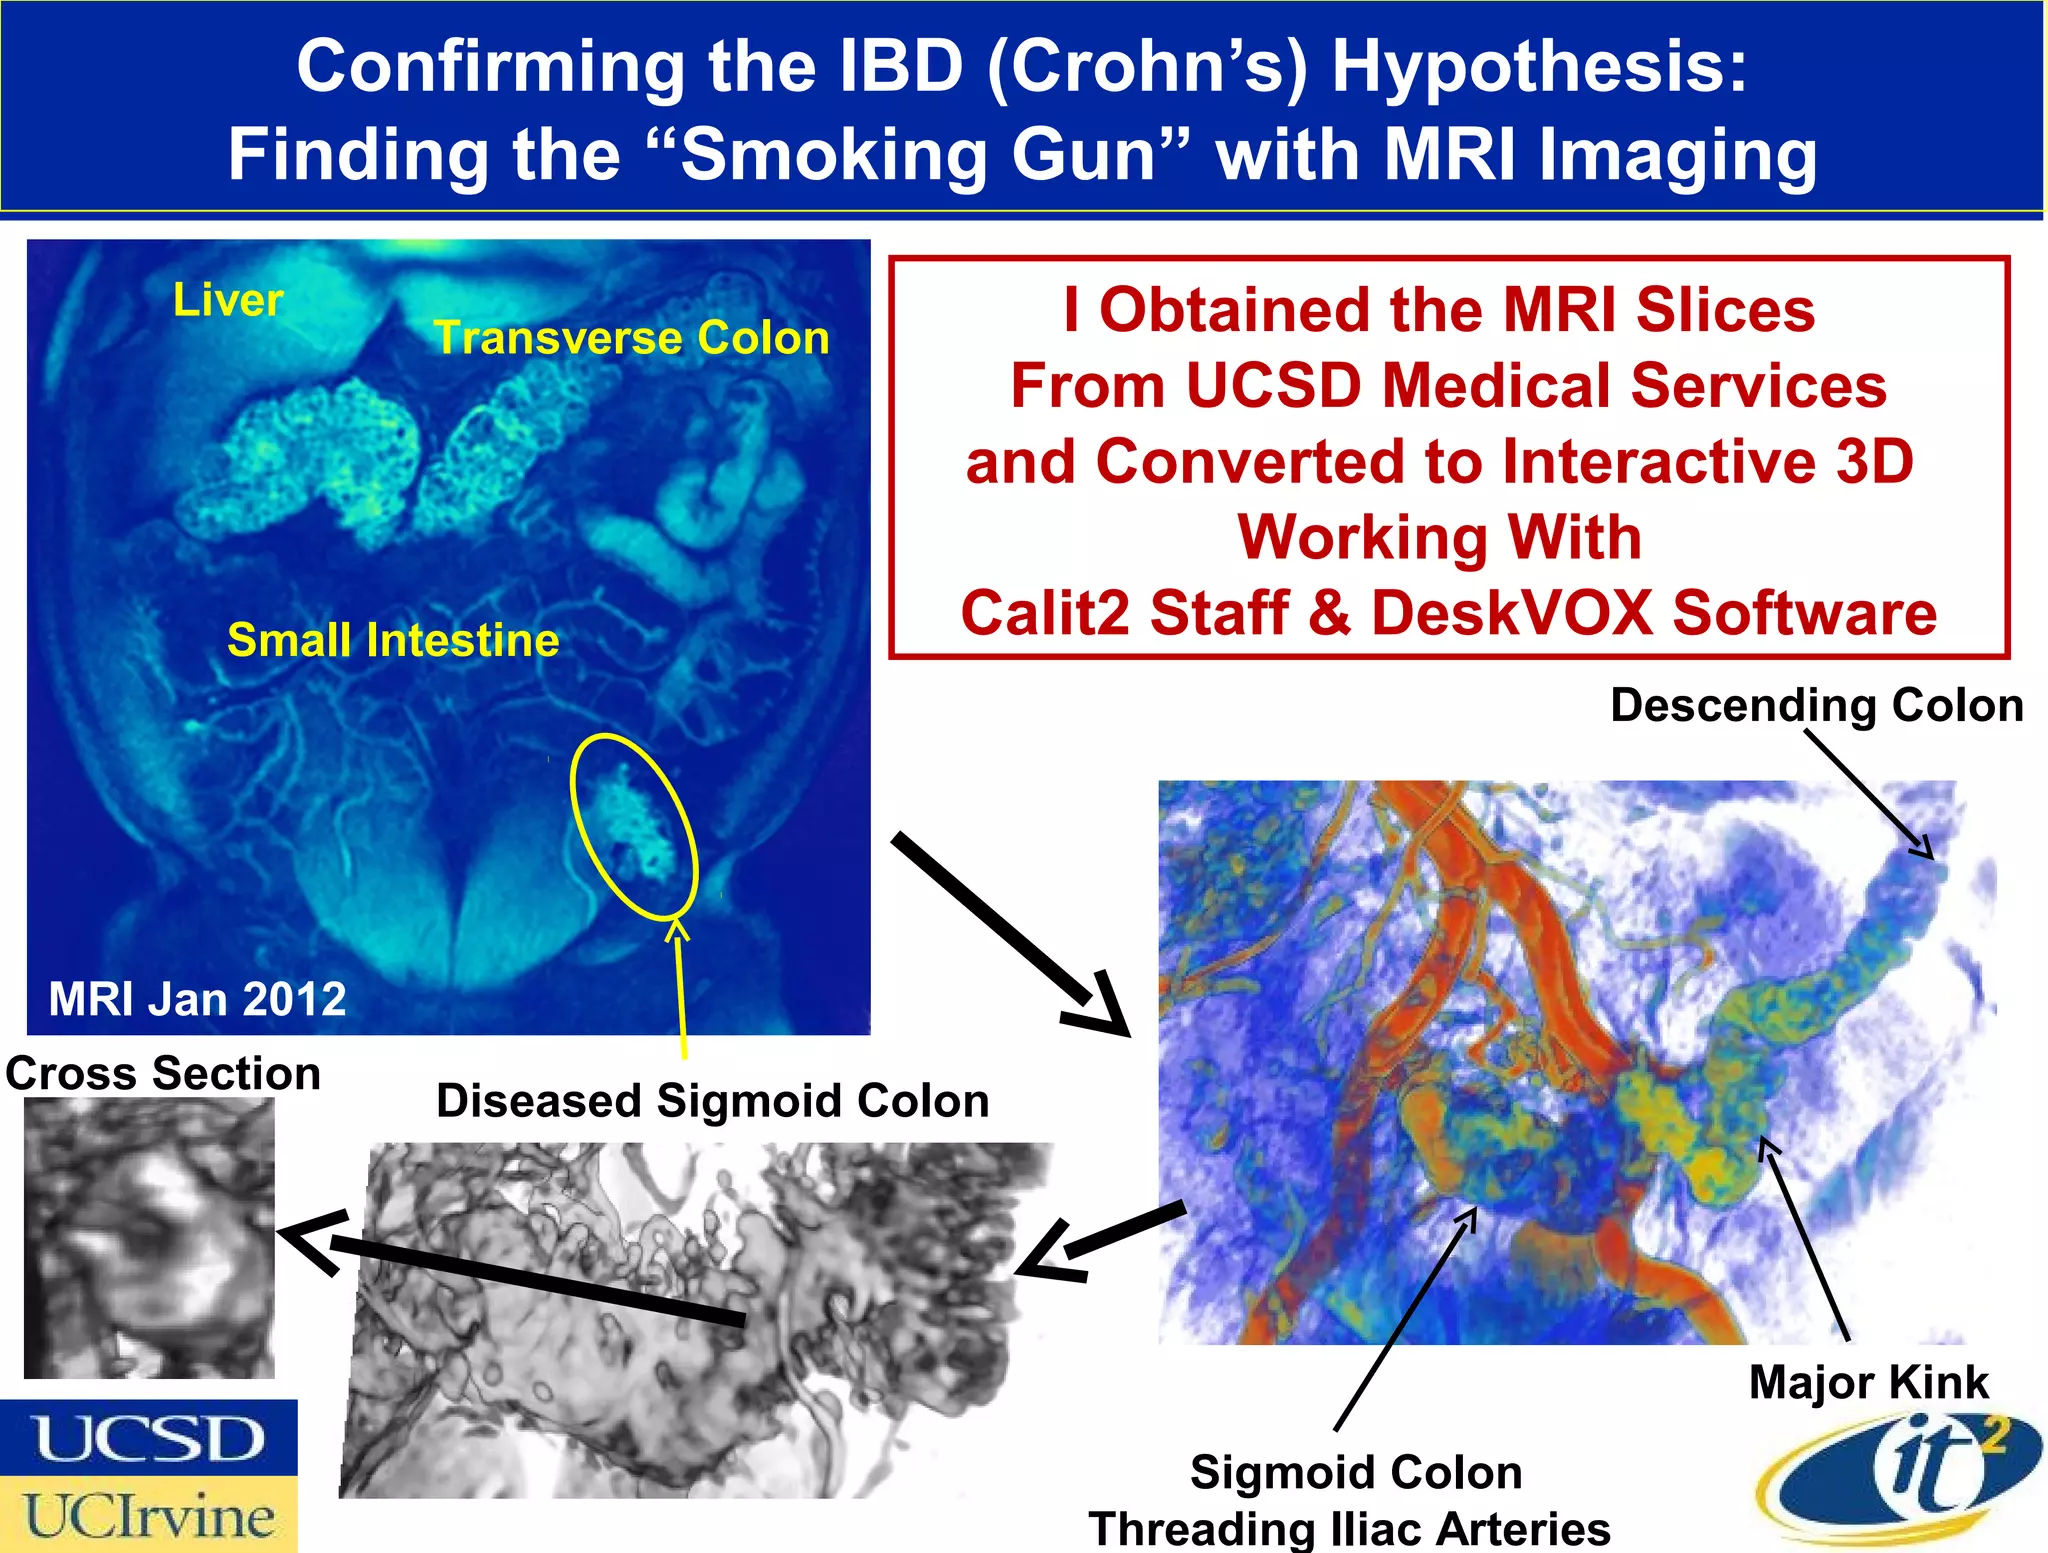
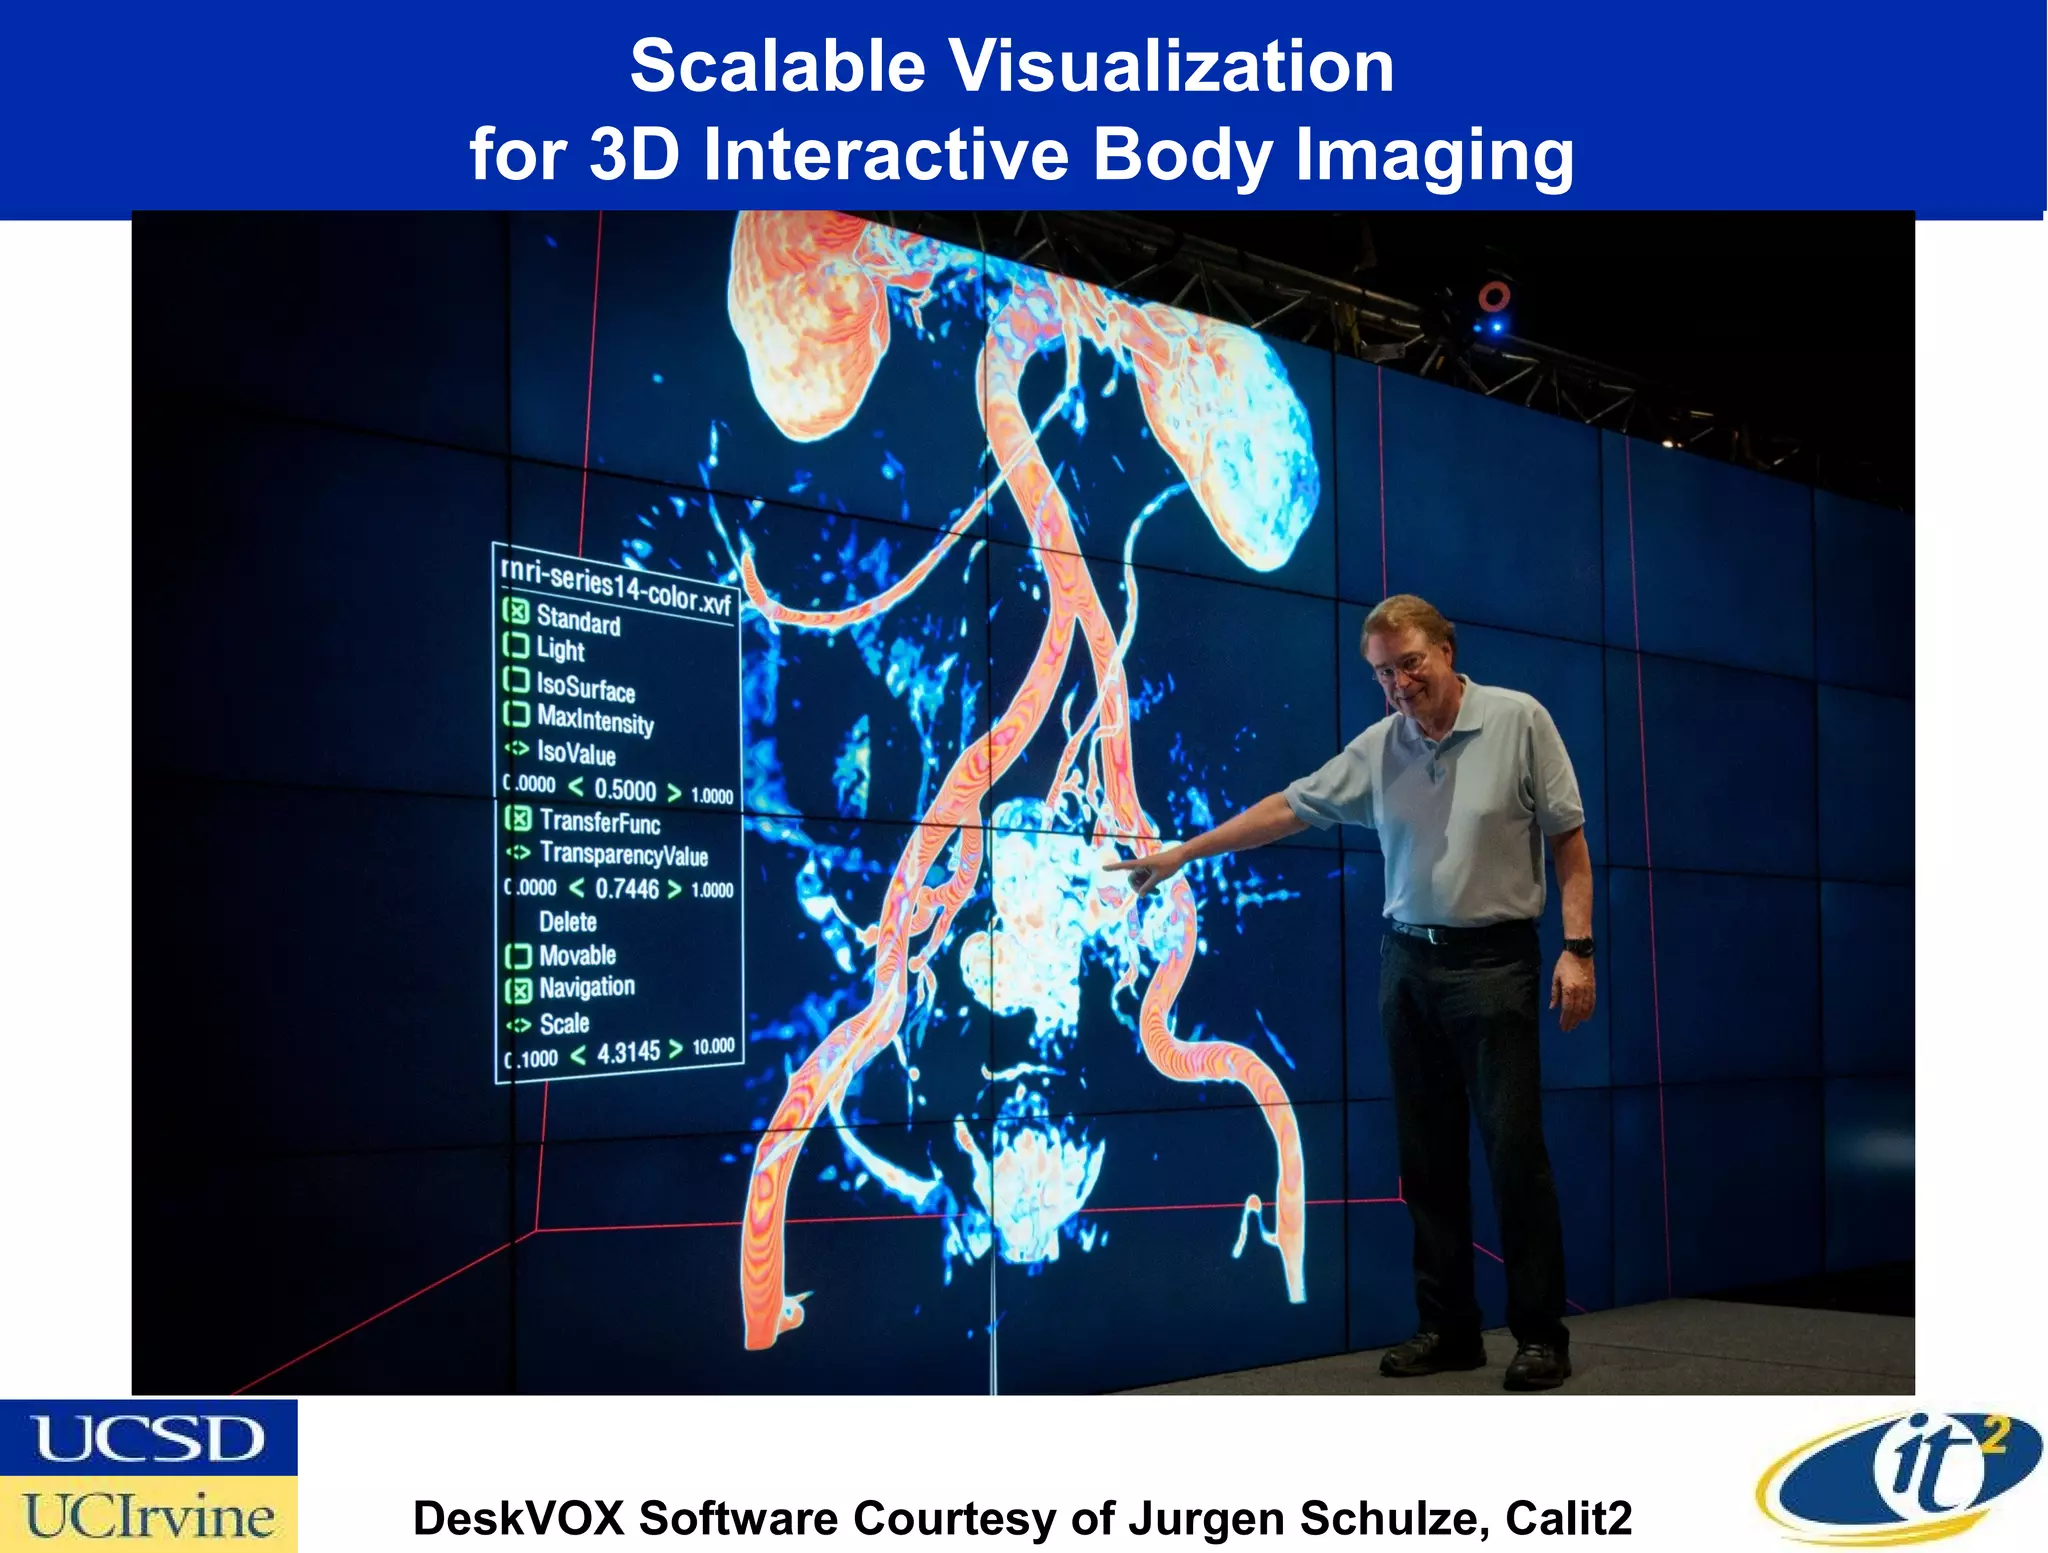
Virtual Reality Exploration Hard Copy of Sigmoid Colon
Photo & DeskVOX Software Courtesy of Jurgen Schulze, Calit2](https://image.slidesharecdn.com/topcoder100212-121001182943-phpapp01/75/Quantifying-and-Visualizing-the-State-of-Your-Body-16-2048.jpg)


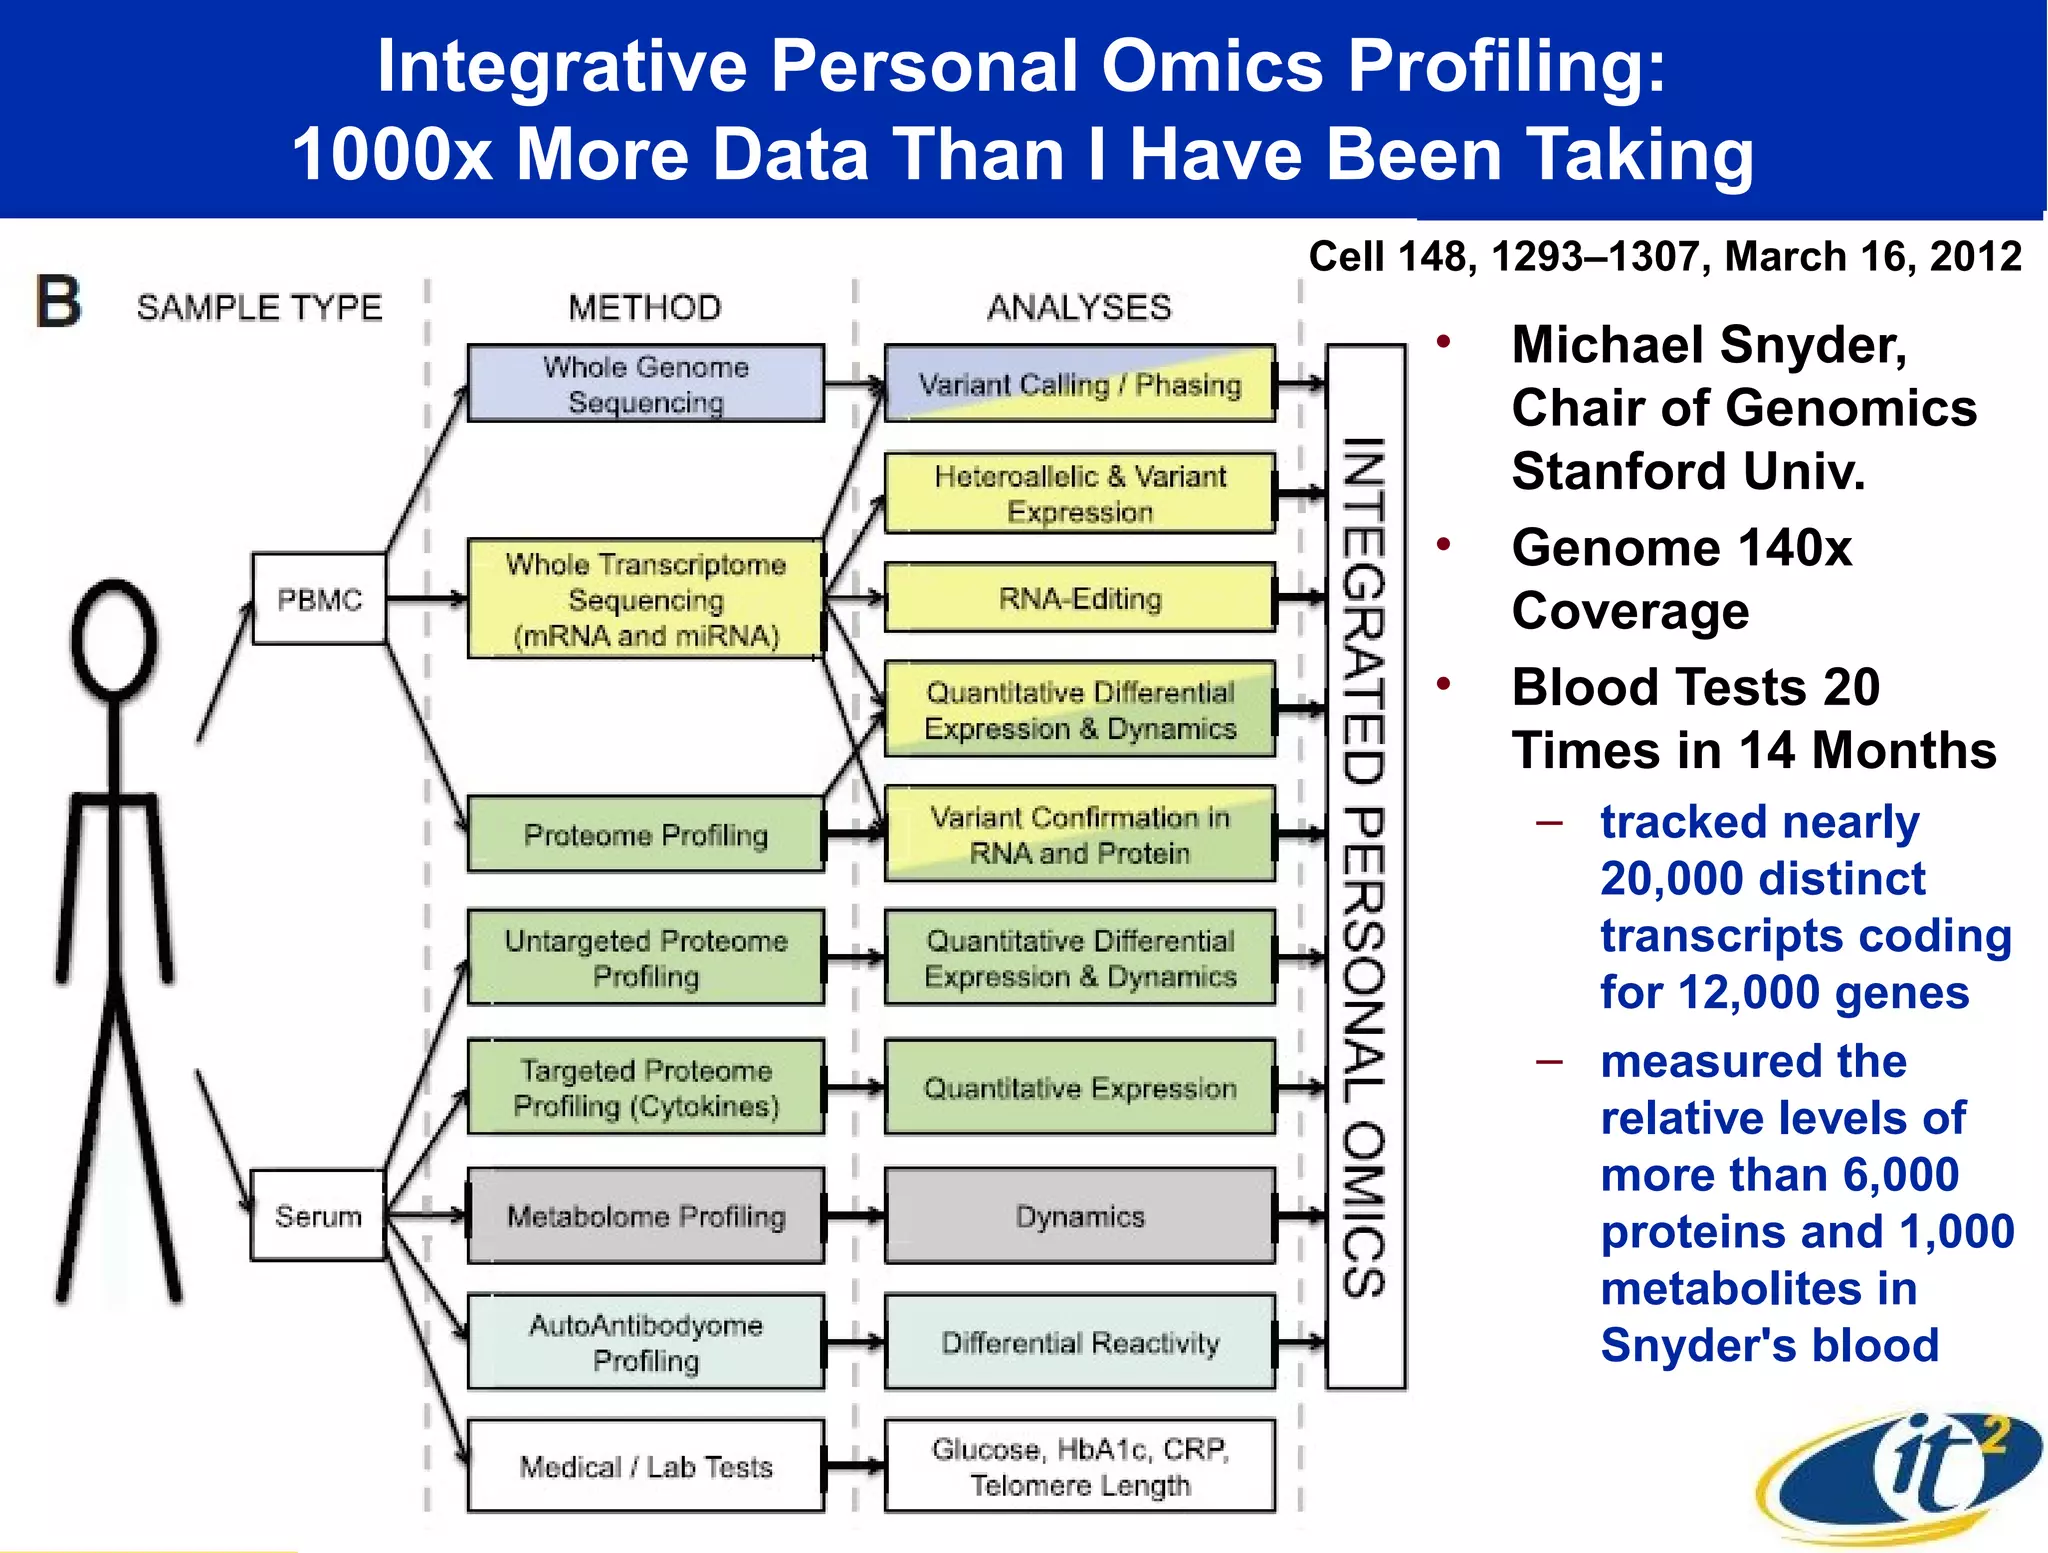

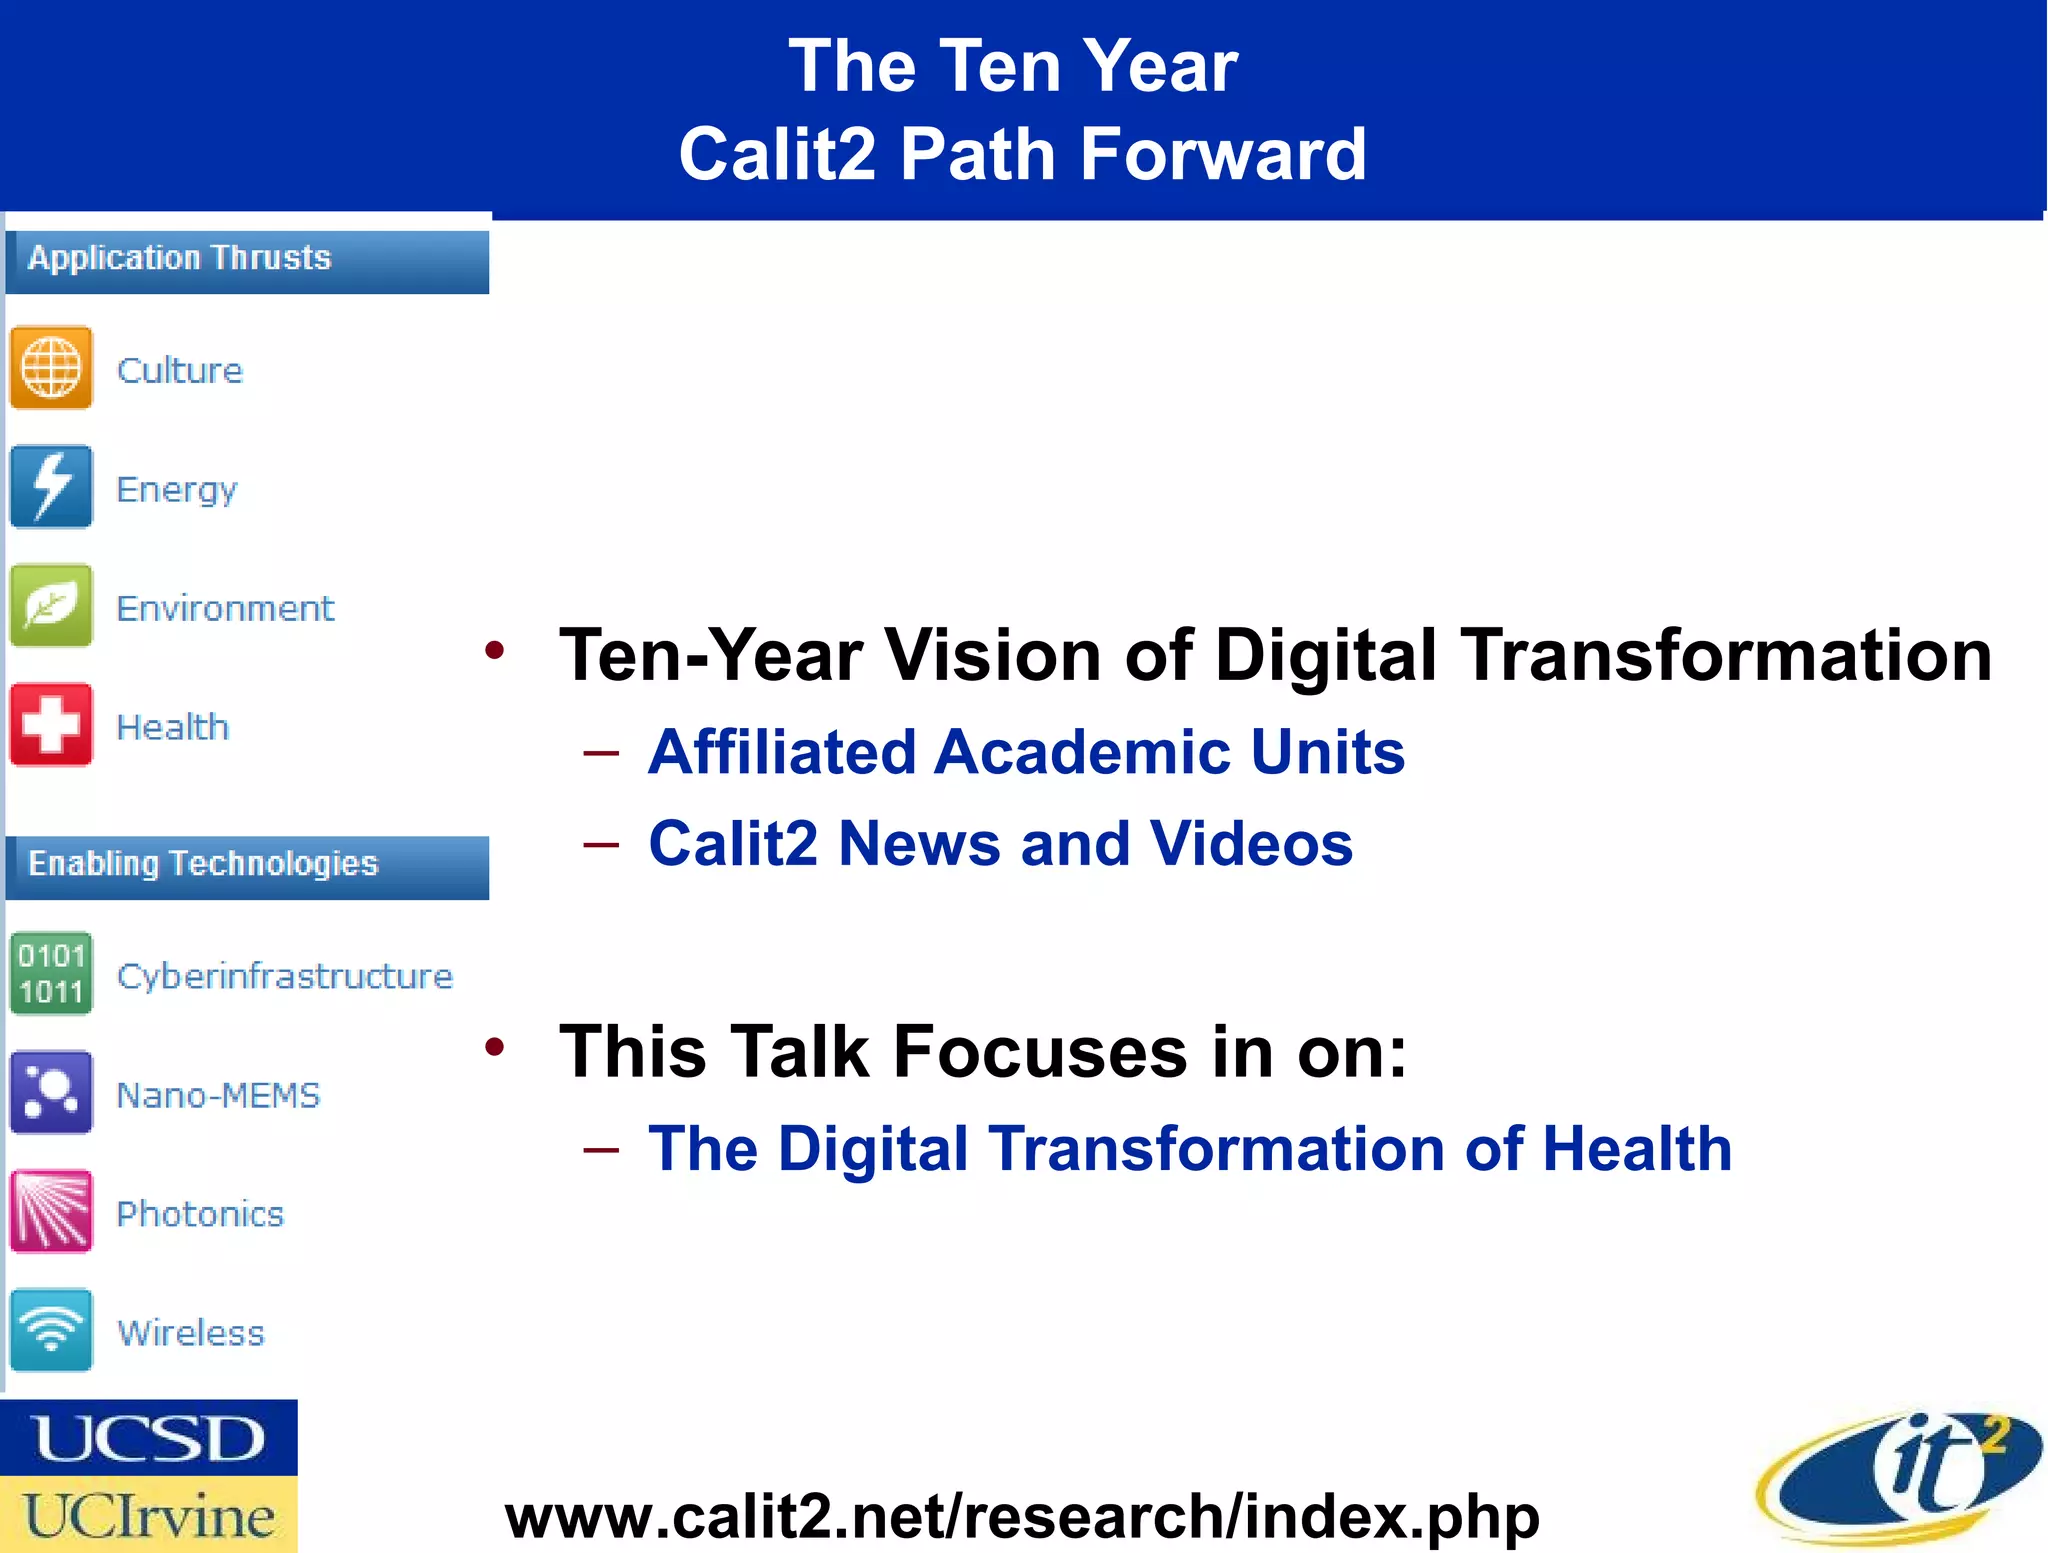
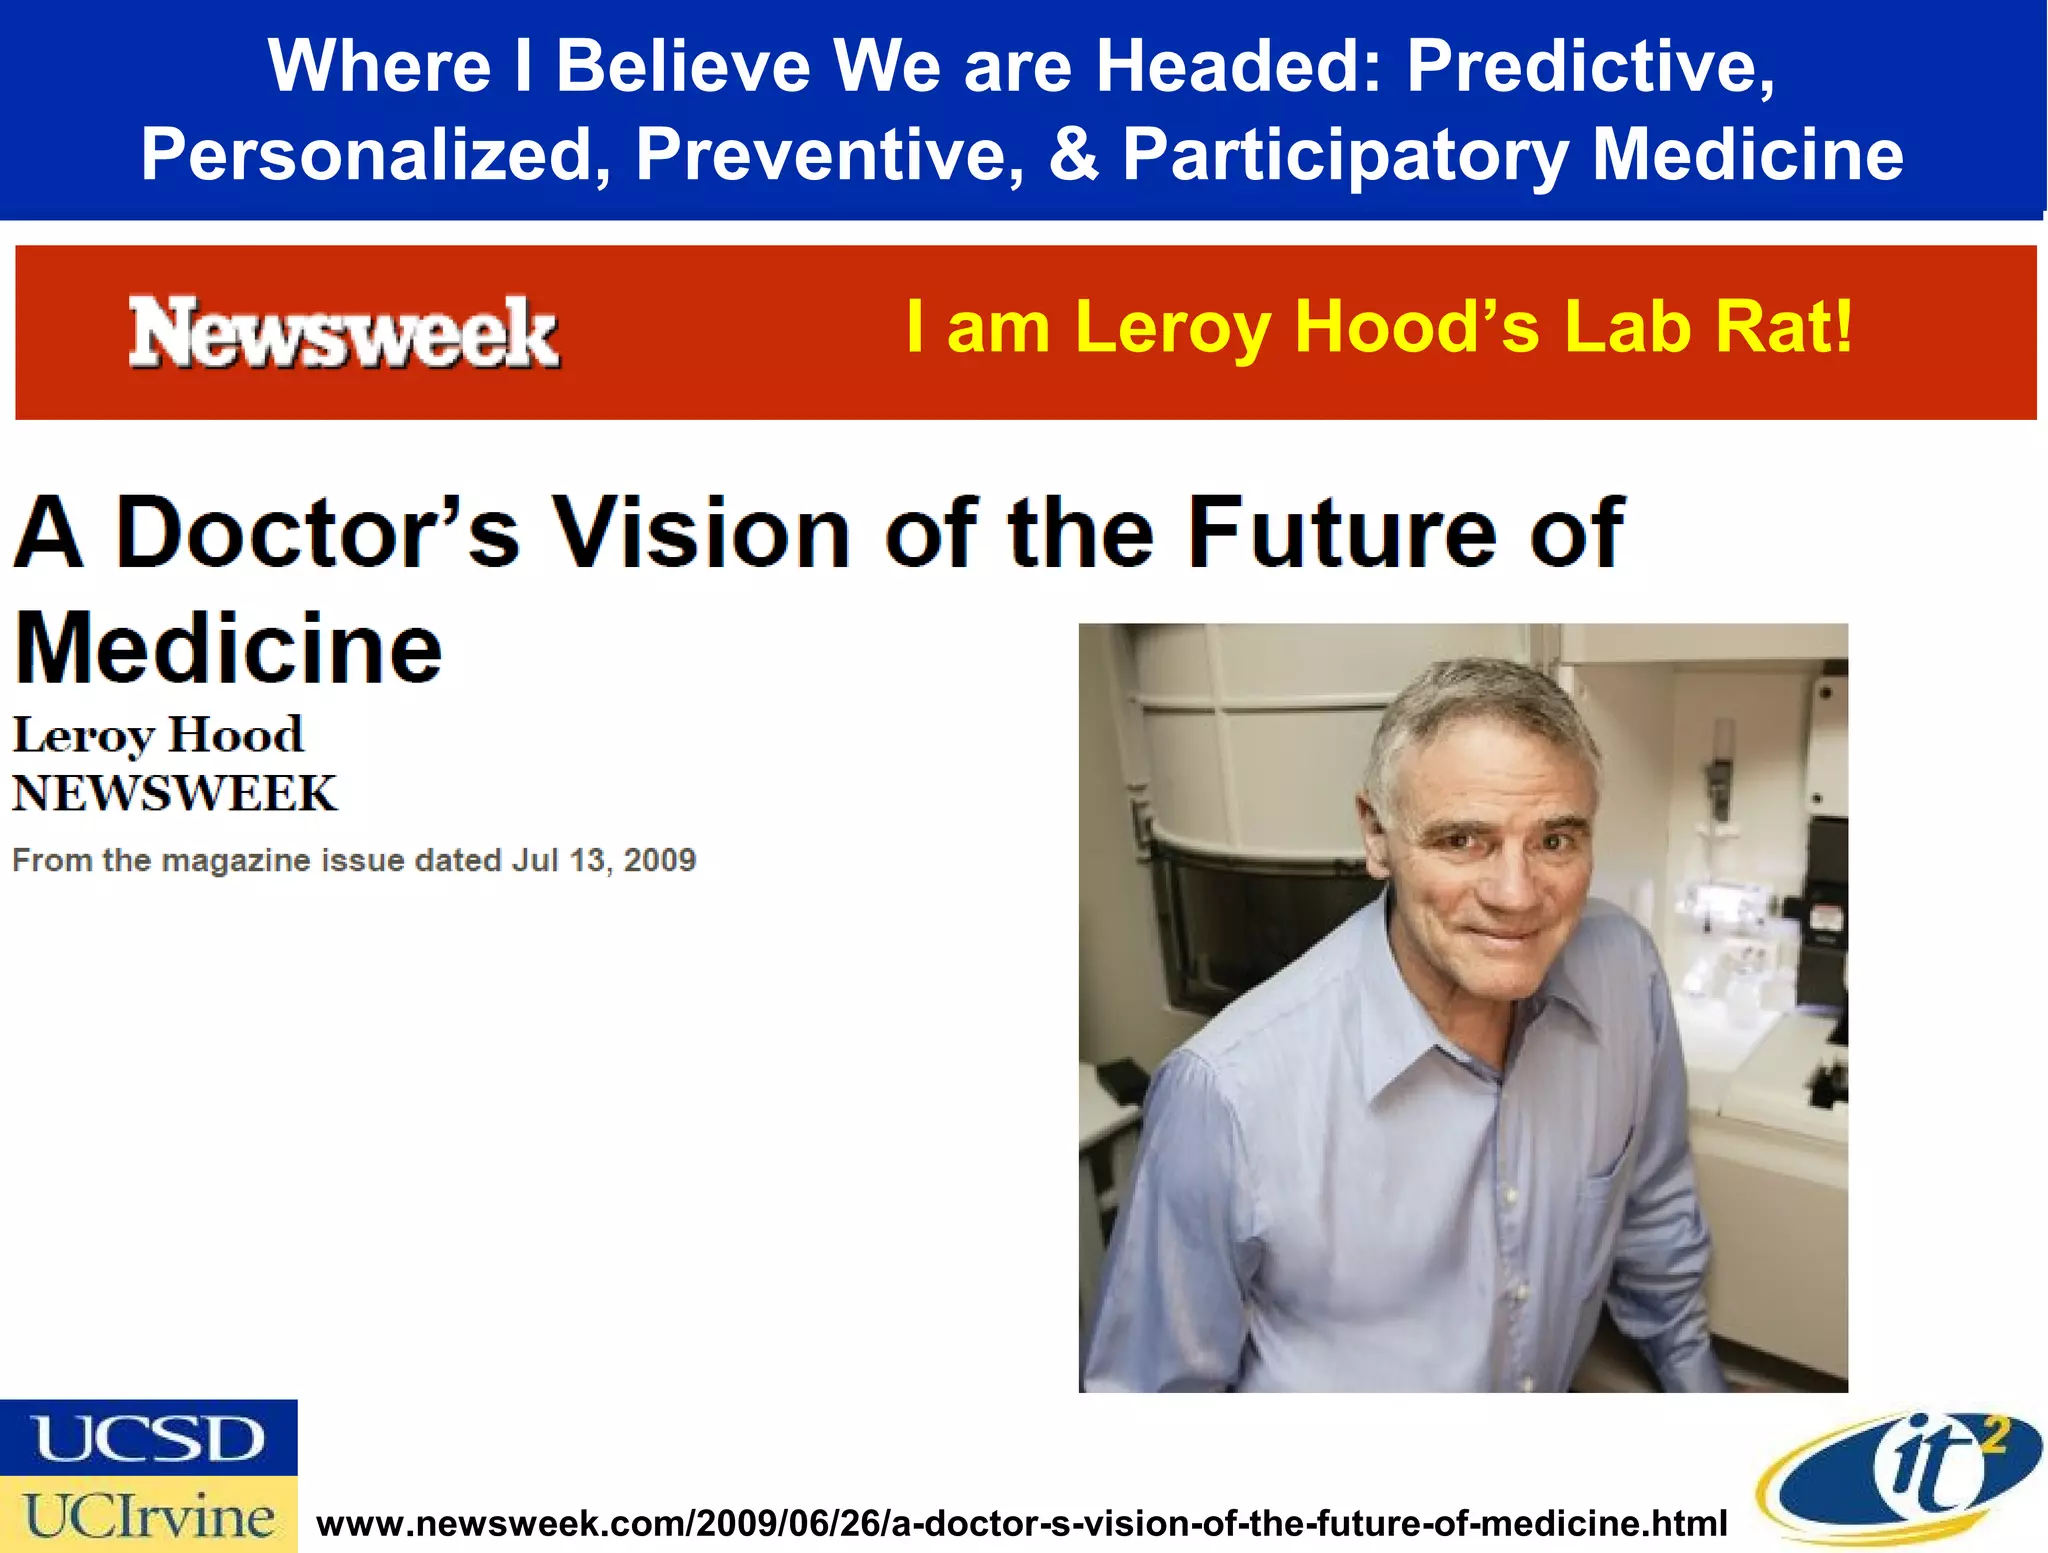
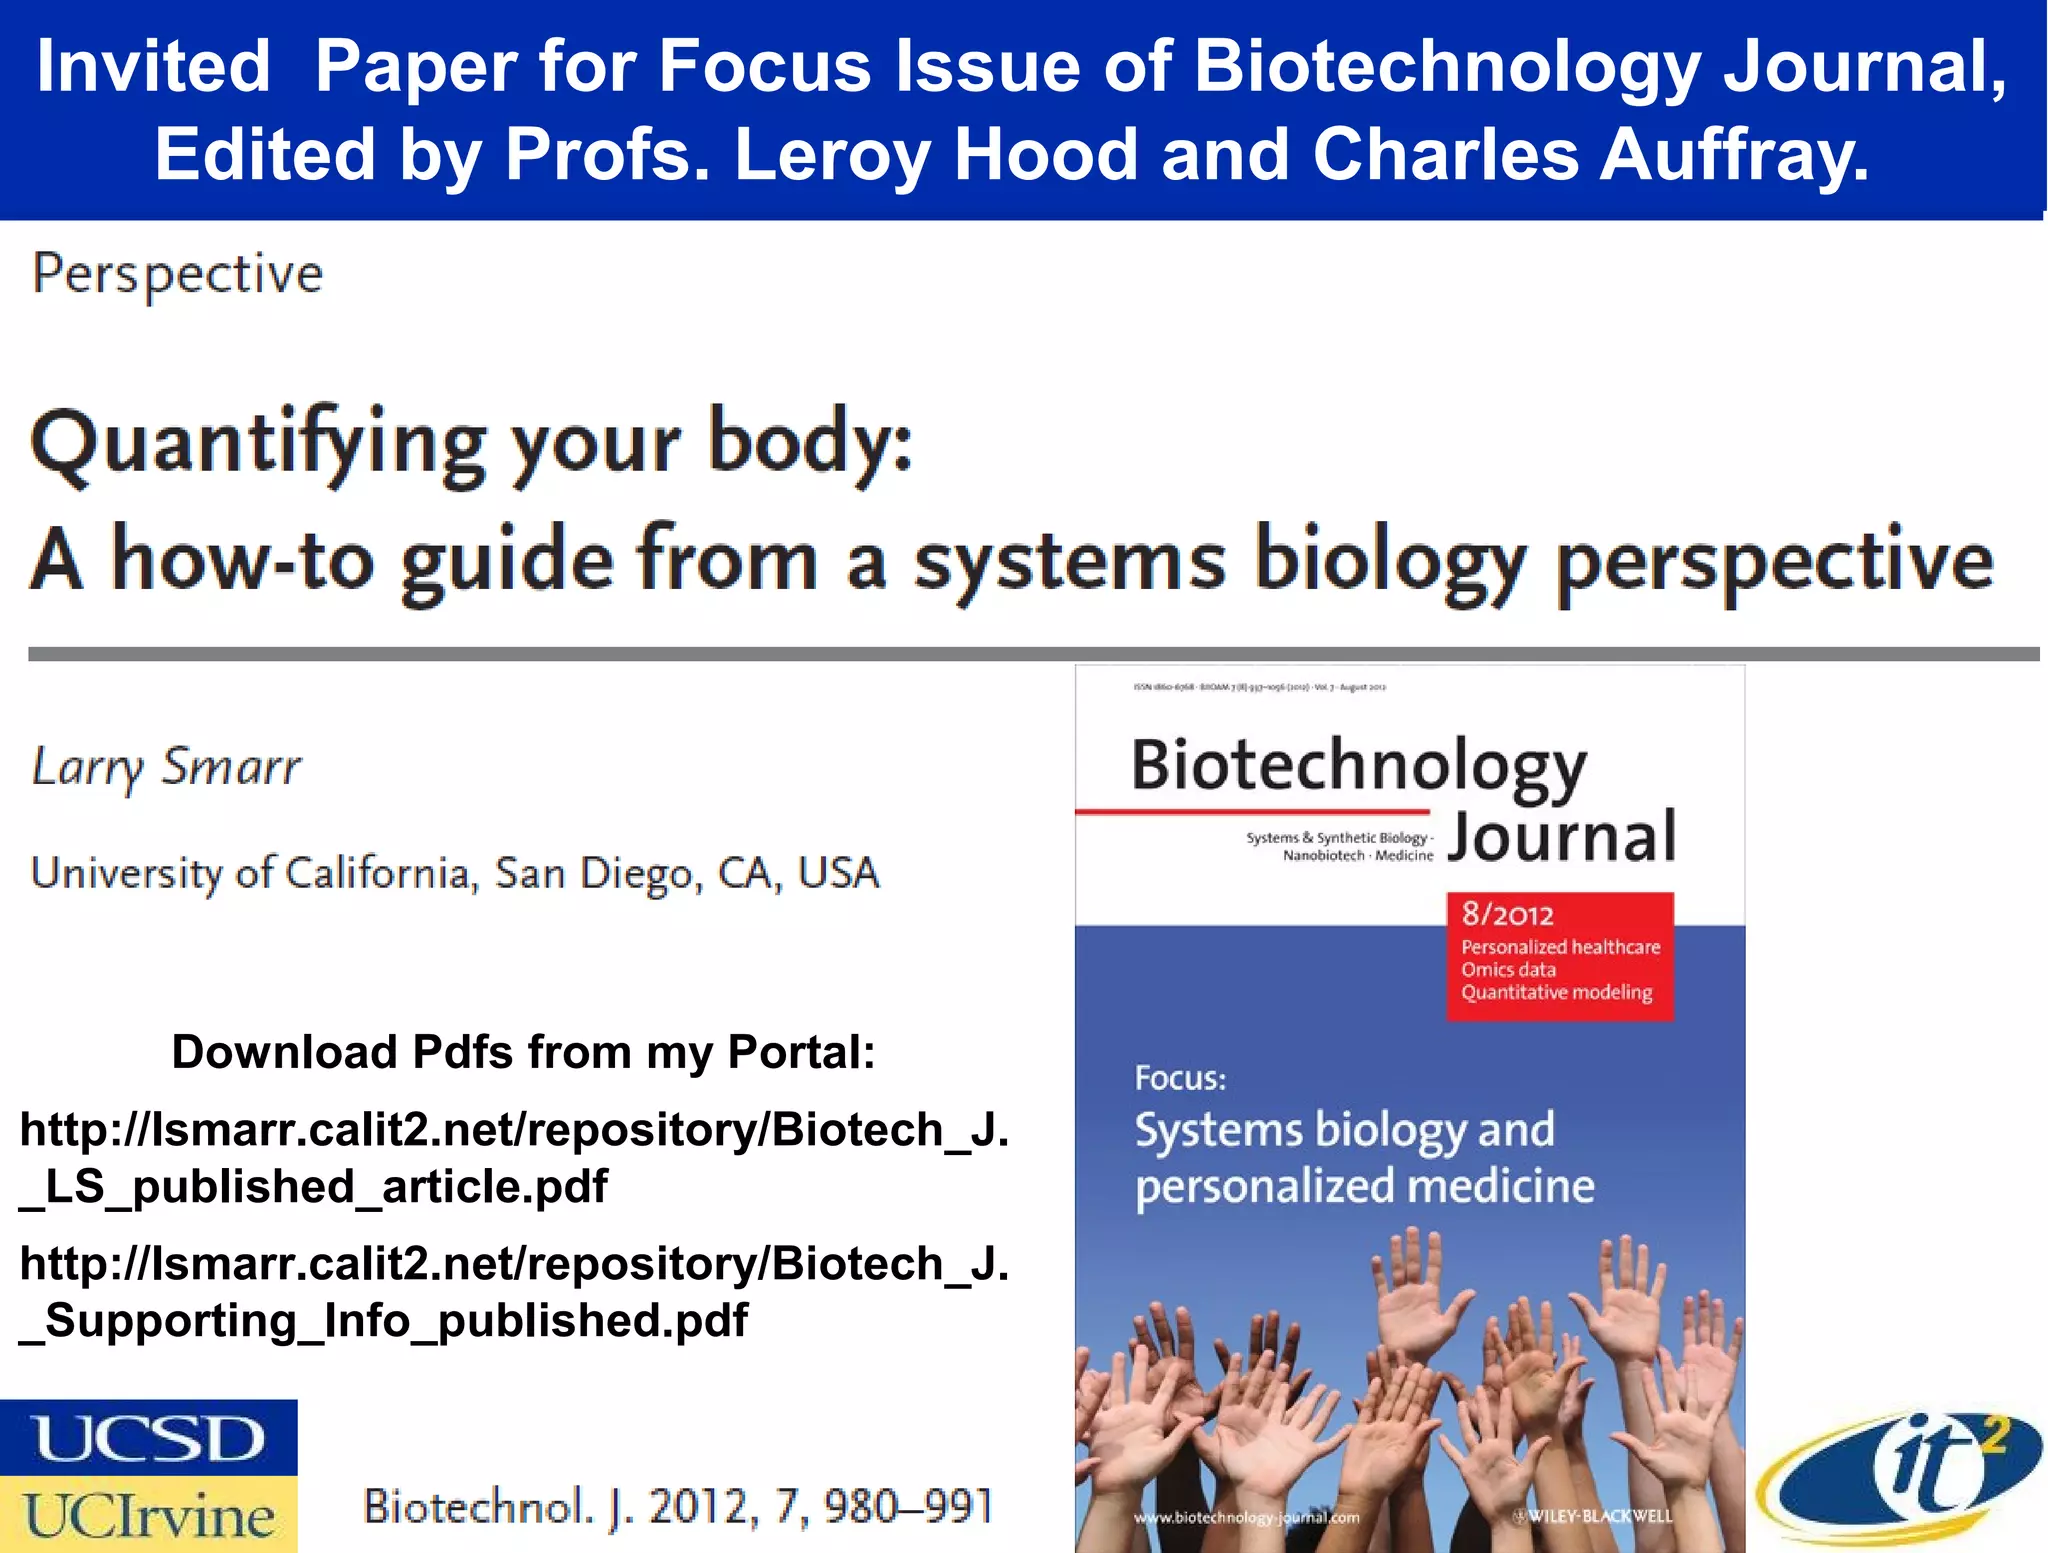
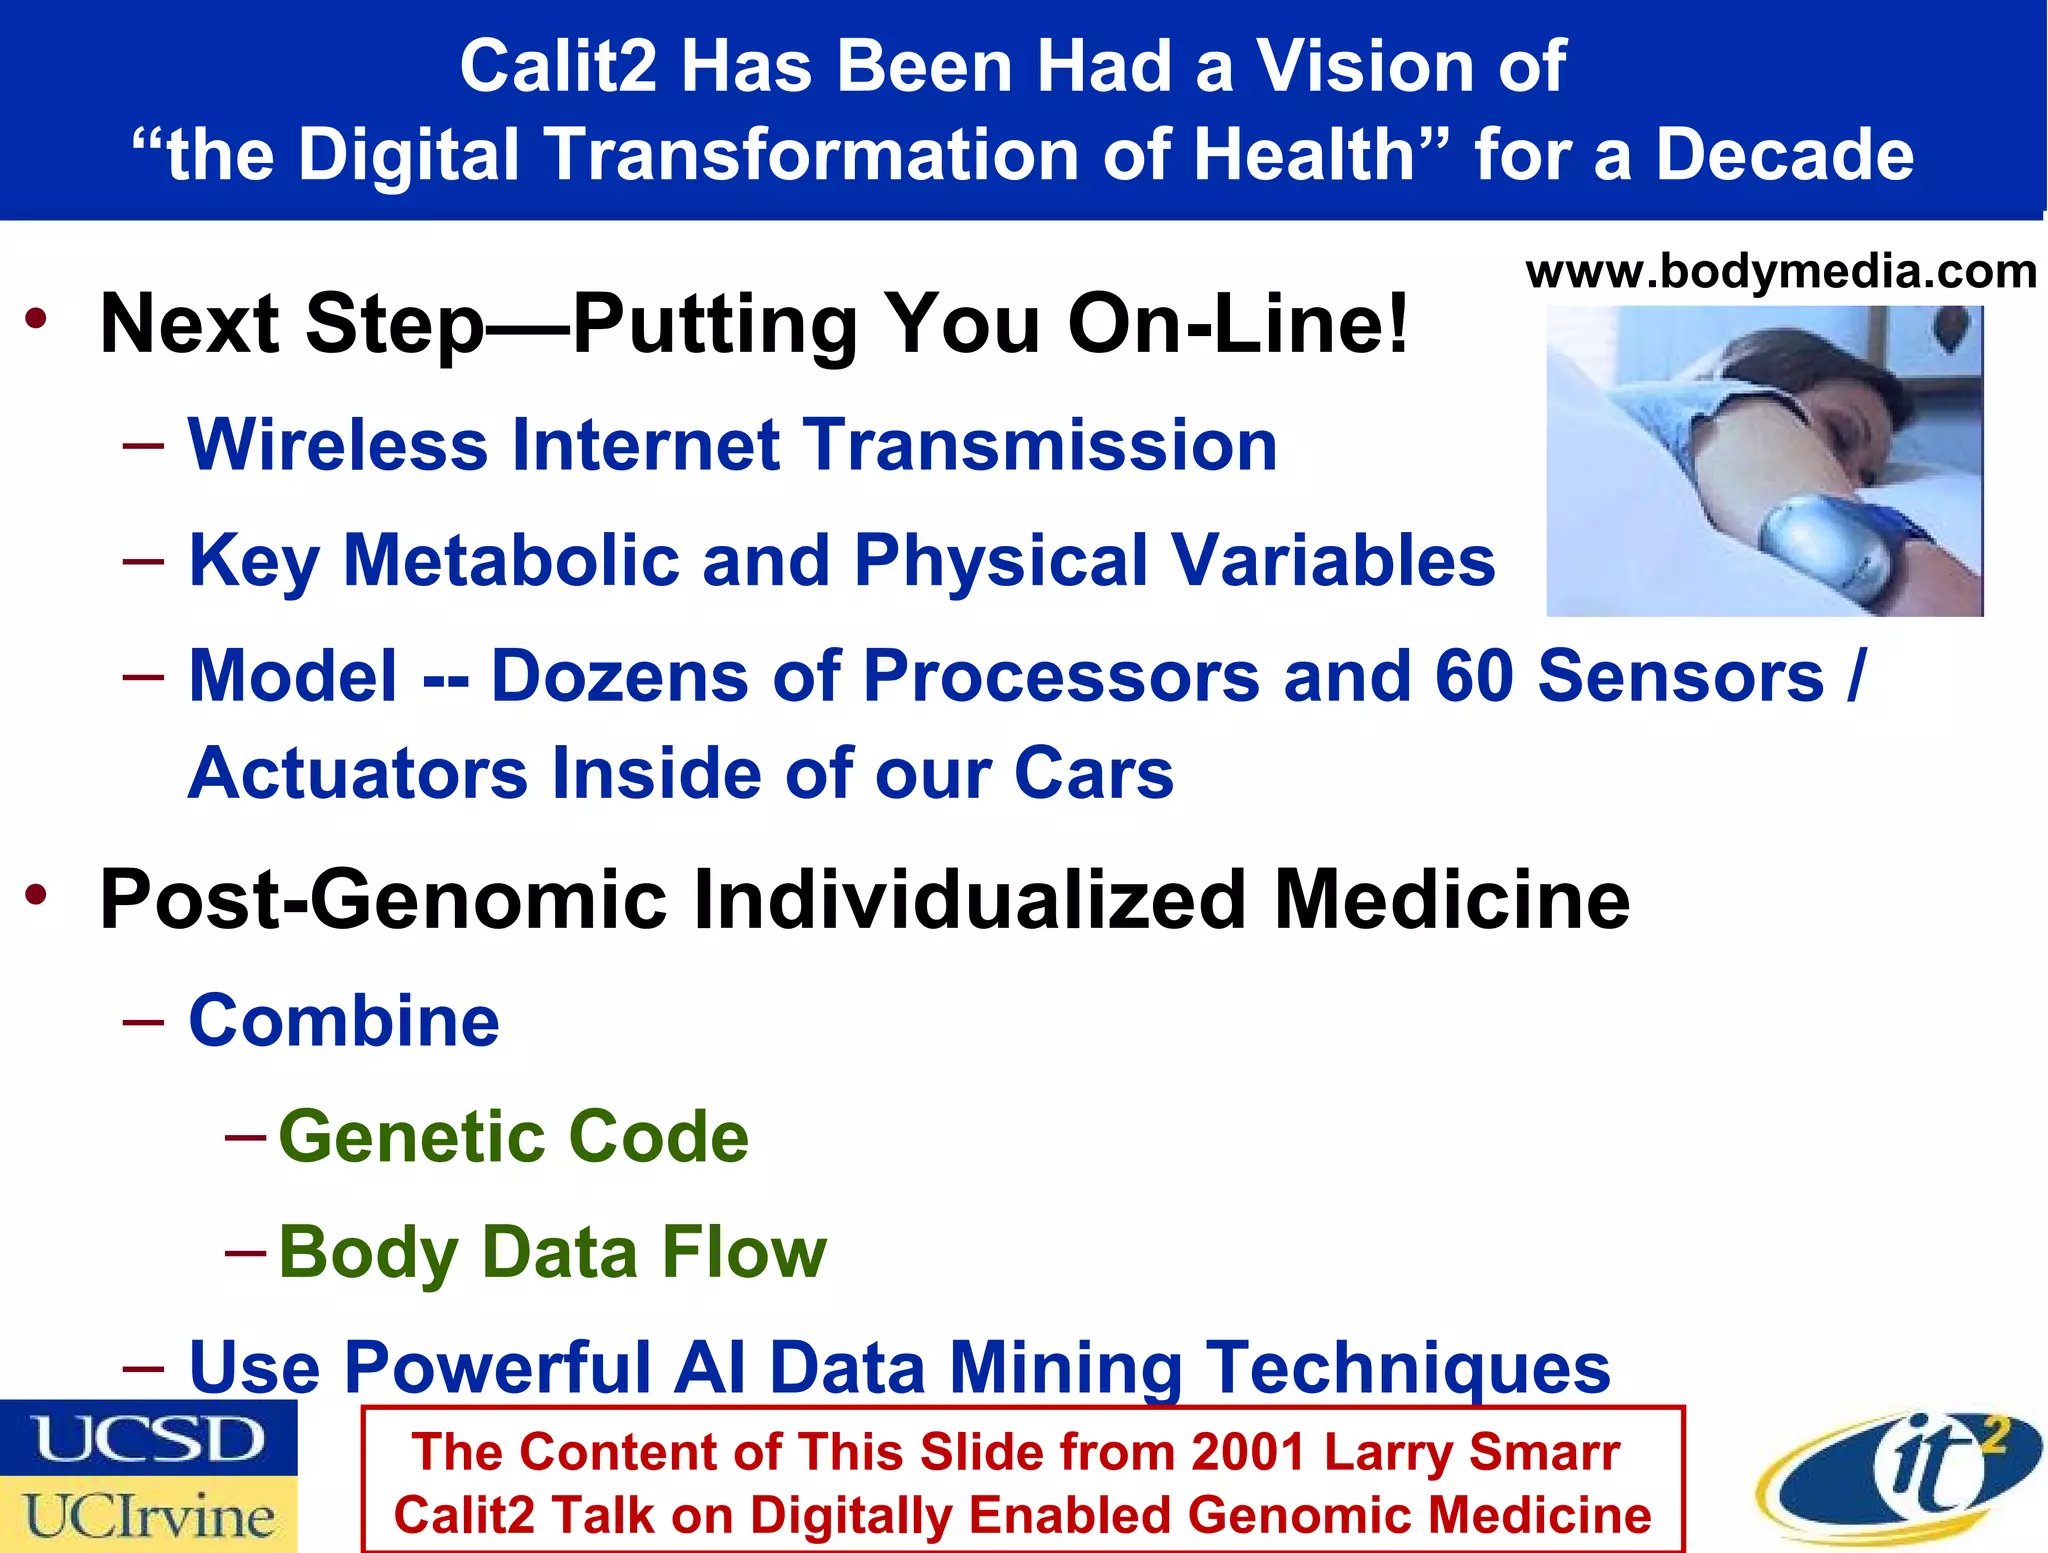
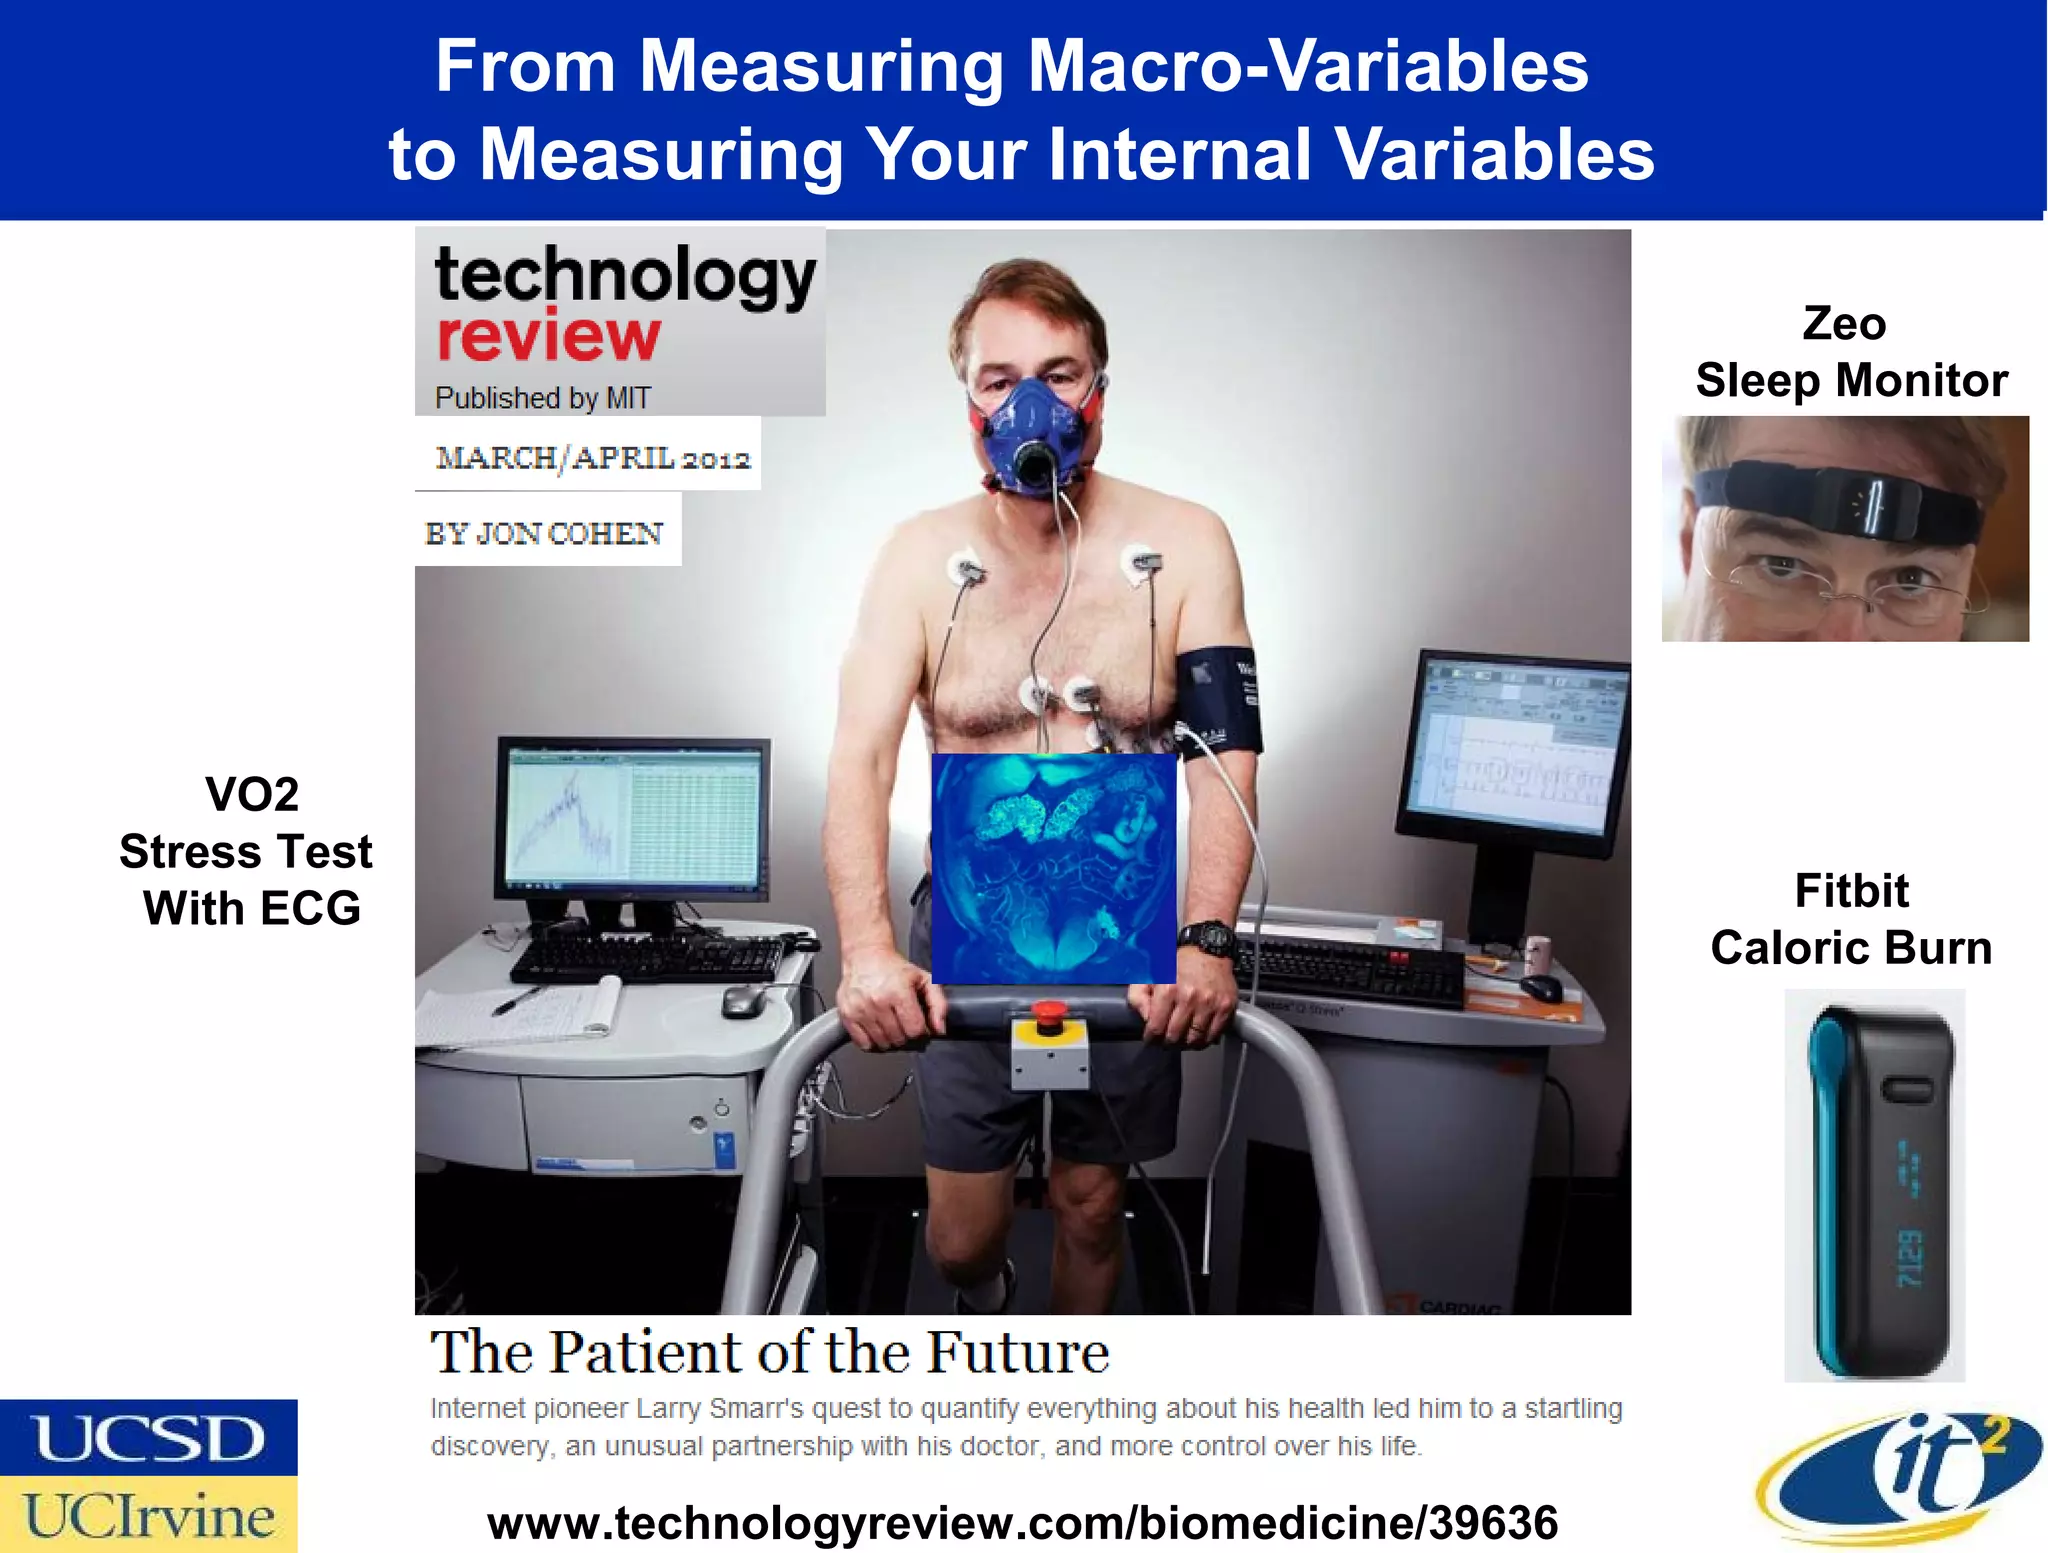
Dr. Larry Smarr's talk outlines the digital transformation of health through personalized medicine, emphasizing the use of data to improve health outcomes. He discusses the monitoring of numerous health variables and the impact of metabolic data on individual health, citing his experience with inflammatory bowel disease. The presentation highlights advancements in technology enabling the quantification of body data to facilitate predictive and preventive medicine.


