Download to read offline
![International Journal of Data Mining & Knowledge Management Process (IJDKP) Vol.3, No.5, September 2013
92
dataset is inefficient and time-consuming. Thus most of the conventional clustering algorithms
are not suitable for incremental databases due to lack of capability to modify the clustering results
in accordance with recent updates.
In this paper, the author proposes a new incremental clustering algorithm called CFICA (Cluster
Feature-Based Incremental Clustering Approach for numerical data) to handle numerical data. It
is an incremental approach to partitional clustering. CFICA uses the concept of Cluster Feature
(CF) for abstracting out the details of data points maintained in the hard disk. At the same time
Cluster Feature provides all essential information required for incremental update of a cluster.
Most of the conventional clustering algorithms make use of Euclidean distance ( ED ) between the
cluster representatives ( mean / mode / medoid ) and the data point to estimate the acceptability of
the data point into the cluster.
In the context of incremental clustering while adopting the existing patterns or clusters to the
enhanced data upon the arrival of a significant chunk of data points, it is often required to
elongate the existing cluster boundaries in order to accept new data points if there is no loss of
cluster cohesion. The author has observed that the Euclidean distance (ED) between the single
point cluster representative and the data point will not suffice for deciding the membership of the
data point into the cluster except for uniformly distributed clusters. Instead, the set of farthest
points of a cluster can represent the data spread within a cluster and hence has to be considered
for formation of natural clusters. The authors suggest a new proximity metric called Inverse
Proximity Estimate (IPE) which considers the proximity of a data point to a cluster representative
as well as its proximity to a farthest point in its vicinity. CFICA makes use of the proposed
proximity metric to determine the membership of a data point into a cluster.
2. RELATED WORK
Incremental clustering has attracted the attention of the research community with Hartigan’s
Leader clustering algorithm [1] which uses a threshold to determine if an instance can be placed
in an existing cluster or it should form a new cluster by itself. COBWEB [2] is an unsupervised
conceptual clustering algorithm that produces a hierarchy of classes. Its incremental nature allows
clustering of new data to be made without having to repeat the clustering already made. It has
been successfully used in engineering applications [3]. CLASSIT [4] is an alternative version of
COBWEB. It handles continuous or real valued data and organizes them into a hierarchy of
concepts. It assumes that the attribute values of the data records belonging to a cluster are
normally distributed. As a result, its application is limited. Another such algorithm was developed
by Fazil Can to cluster documents [5]. Charikar et al. defined the incremental clustering problem
and proposed a incremental clustering model which preserves all the desirable properties of HAC
(hierarchical agglomerative clustering) while providing a extension to the dynamic case. [6].
BIRCH (Balanced Iterative Reducing and Clustering using Hierarchies) is especially suitable for
large number of data items [7]. Incremental DBSCAN was presented by Ester et al., which is
suitable for mining in a data warehousing environment where the databases have frequent updates
[8]. The GRIN algorithm, [9] is an incremental hierarchical clustering algorithm for numerical
data sets based on gravity theory in physics. Serban and Campan have presented an incremental
algorithm known as Core Based Incremental Clustering (CBIC), based on the k-means clustering
method which is capable of re-partitioning the object set when the attribute set changes [10]. The
new demand points that arrive one at a time have been assigned either to an existing cluster or a](https://image.slidesharecdn.com/newproximityestimateforincrementalupdateofnonuniformlydistributedclusters-131008031155-phpapp02/75/New-proximity-estimate-for-incremental-update-of-non-uniformly-distributed-clusters-2-2048.jpg)
![International Journal of Data Mining & Knowledge Management Process (IJDKP) Vol.3, No.5, September 2013
93
newly created one by the algorithm in the incremental versions of Facility Location and k-median
to maintain a good solution [11].
3. FUNCTIONALITY OF CFICA
An incremental clustering algorithm has to perform the primary tasks namely, initial cluster
formation and their summaries, acceptance of new data items into either existing clusters or new
clusters followed by merging of clusters to maintain compaction and cohesion. CFICA also takes
care of concept-drift and appropriately refreshes the cluster solution upon significant deviation
from the original concept.
It may be observed that once the initial cluster formation is done and summaries are represented
as Cluster Features, all the basic tasks of the incremental clustering algorithm CFICA can be
performed without requiring to read the actual data points ( probably maintained in hard disk )
constituting the clusters. The data points need to be refreshed only when the cluster solution has
to be refreshed due to concept-drift.
3.1 Initial clustering of the static database
The proposed algorithm CFICA is capable of clustering incremental databases starting from
scratch. However, during the initial stages refreshing the cluster solution happens very often as
the size of the initial clusters is very small. Hence for efficiency reasons the author suggests to
apply a partitional clustering algorithm to form clusters on the initial collection of data points
( DS ). The author used the k-means clustering algorithm for initial clustering to obtain k number
of clusters as it is the simplest and most commonly used partitional clustering algorithm. Also k-
means is relatively scalable and efficient in processing large datasets because the computational
complexity is O(nkt) where n is the total number of objects, k is the number of clusters and t
represents the number of iterations. Normally, k<<n and t<<n and hence O(n) is taken as its time
complexity [12].
3.2 Computation of Cluster Feature (CF)
CFICA uses cluster features for accommodating the essential information required for
incremental maintenance of clusters. The basic concept of cluster feature has been adopted from
BIRCH as it supports incremental and dynamic clustering of incoming objects. As CFICA
handles partitional clusters as against hierarchical clusters handled by BIRCH, the original
structure of cluster feature went through appropriate modifications to make it suitable for
partitional clustering.
The Cluster Feature (CF ) is computed for every cluster ic obtained from the k-means algorithm.
In CFICA, the Cluster Feature is denoted as,
CFi = {ni , mi , ݉
′
, ܳ ,ݏݏ}
where ni → number of data points,](https://image.slidesharecdn.com/newproximityestimateforincrementalupdateofnonuniformlydistributedclusters-131008031155-phpapp02/75/New-proximity-estimate-for-incremental-update-of-non-uniformly-distributed-clusters-3-2048.jpg)
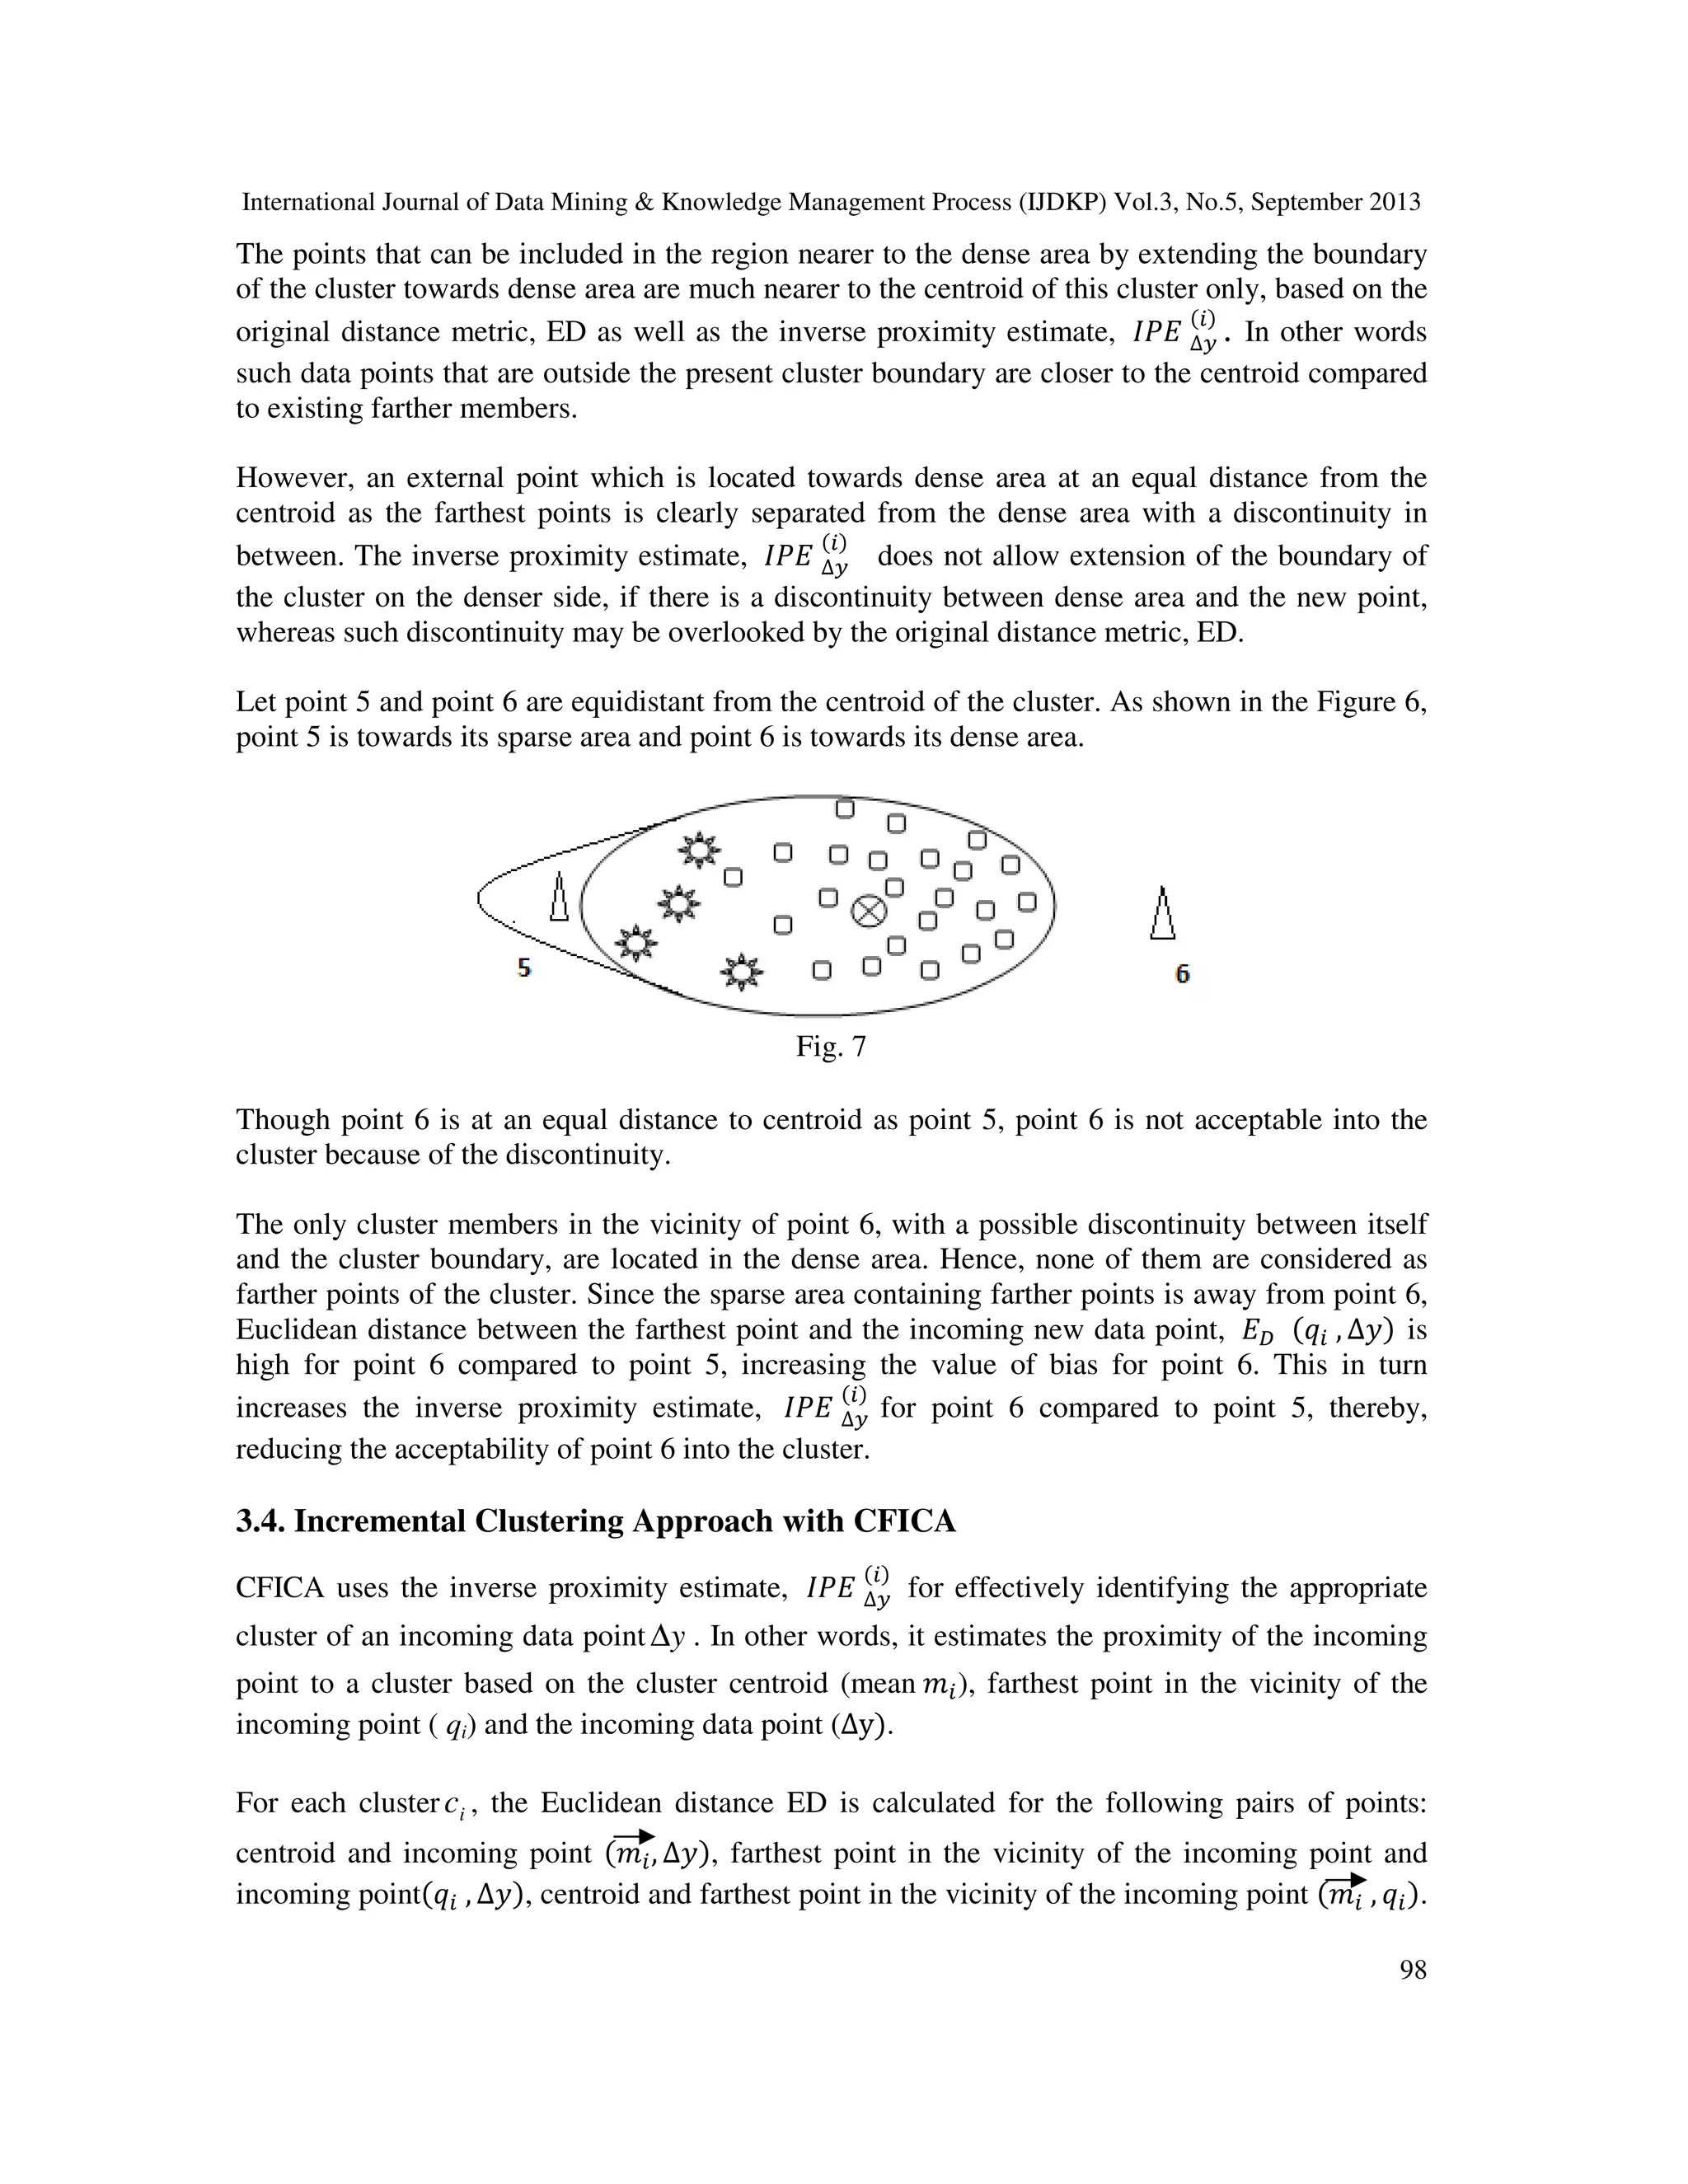
![International Journal of Data Mining & Knowledge Management Process (IJDKP) Vol.3, No.5, September 2013
97
Fig.5
In the Figure 5, point 1 is in the vicinity of C and Point 3 is in the vicinity of A while both A and
C are farthest points. In this context point 3 is more acceptable than point 1 into the cluster as C is
farther than A to the centroid. The bias increases with the distance of a particular farthest point to
its centroid. Therefore, bias is proportional to the Euclidean distance, ED between the centroid
( ݉పሬሬሬሬԦ ) and the farthest point in the vicinity of the incoming data point ( ∆ݕ ).
∴ ܤ ߙ ܦܧ (݉ , ݍ)
Hence, bias is estimated as a product of ED (ݍ , ∆)ݕ , ܦܧ (݉ , ݍ) mathematically from the
above equations. Therefore bias is expressed as,
ܤ = [ ܦܧ (ݍ , ∆)ݕ ∗ ܦܧ ( ݉ , ݍ) ]
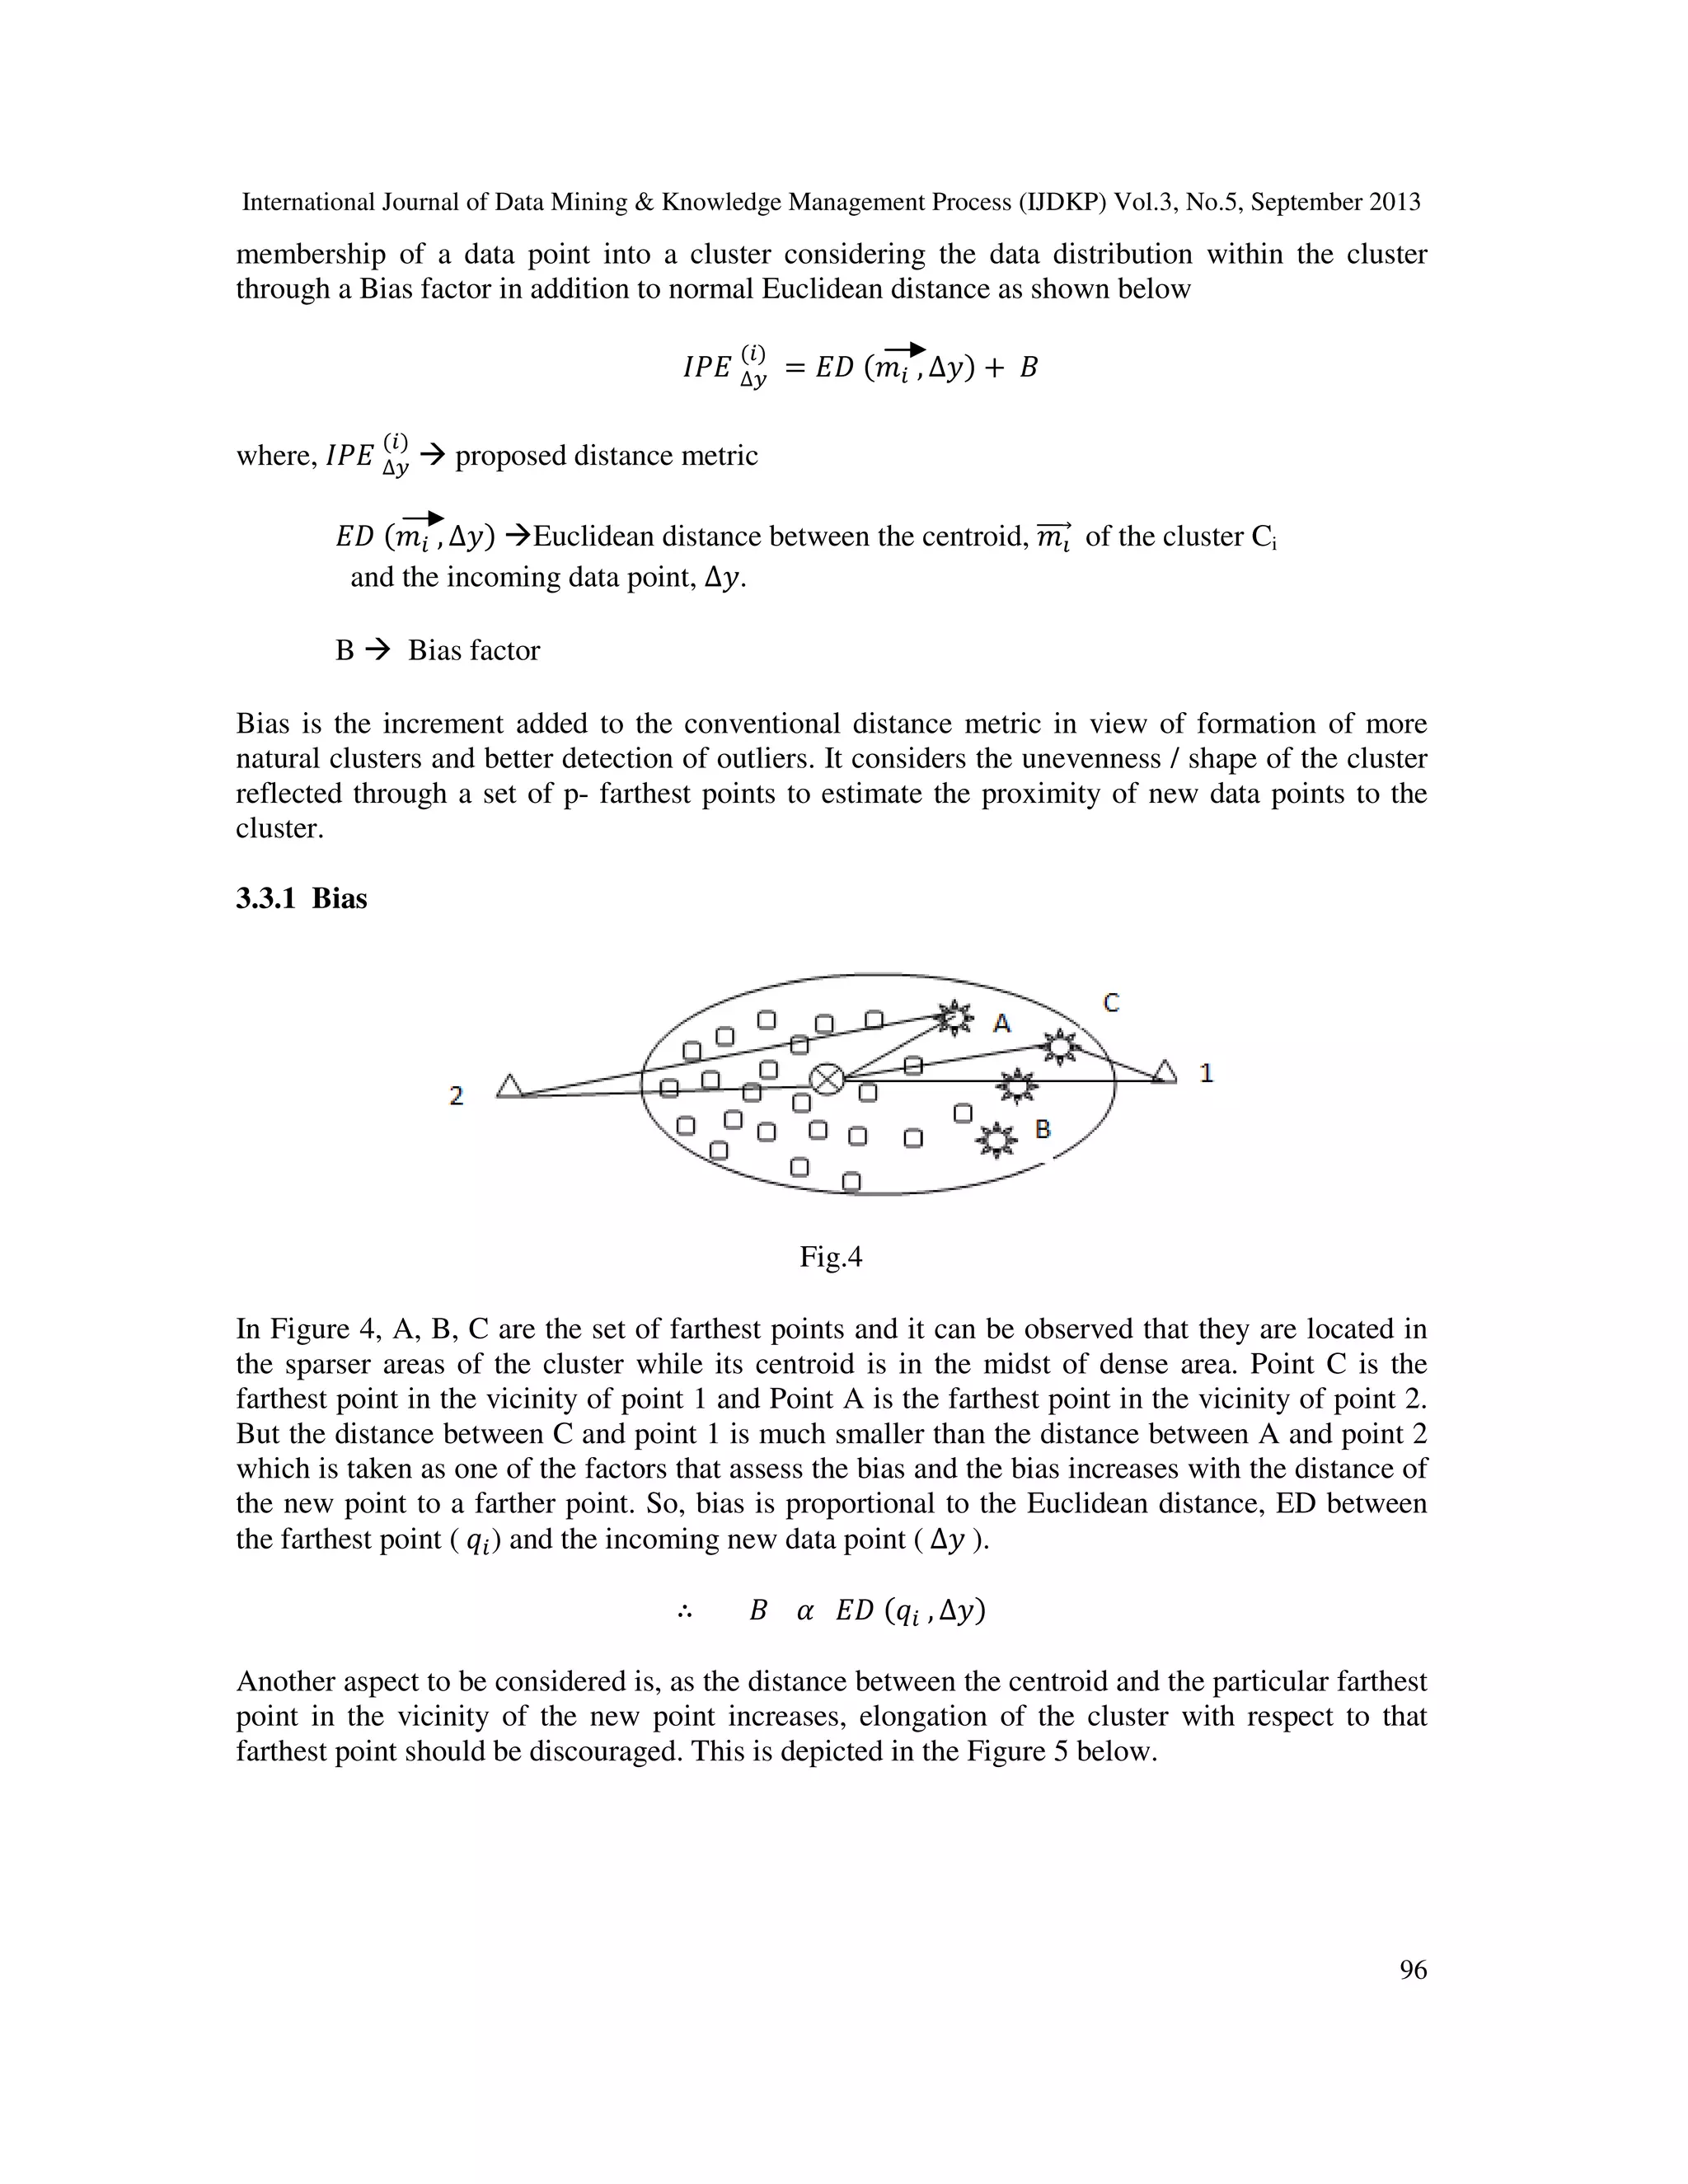
3.3.2 Proposed Proximity Metric – Inverse Proximity Estimate (IPE)
The authors have devised a new proximity estimate ܧܲܫ ∆௬
()
to determine the acceptability of an
incoming data point ∆ݕ into a possibly non-uniformly distributed cluster represented by its mean
݉ which is calculated as follows
ܧܲܫ ∆௬
()
= ܦܧ (݉ , ∆)ݕ + ܤ
Substituting B from the above, now (ܧܲܫ ∆௬
()
) is estimated as
ܧܲܫ ∆௬
()
= ܦܧ (݉ , ∆)ݕ + [ ܦܧ (ݍ , ∆)ݕ ∗ ED (݉ , ݍ)]
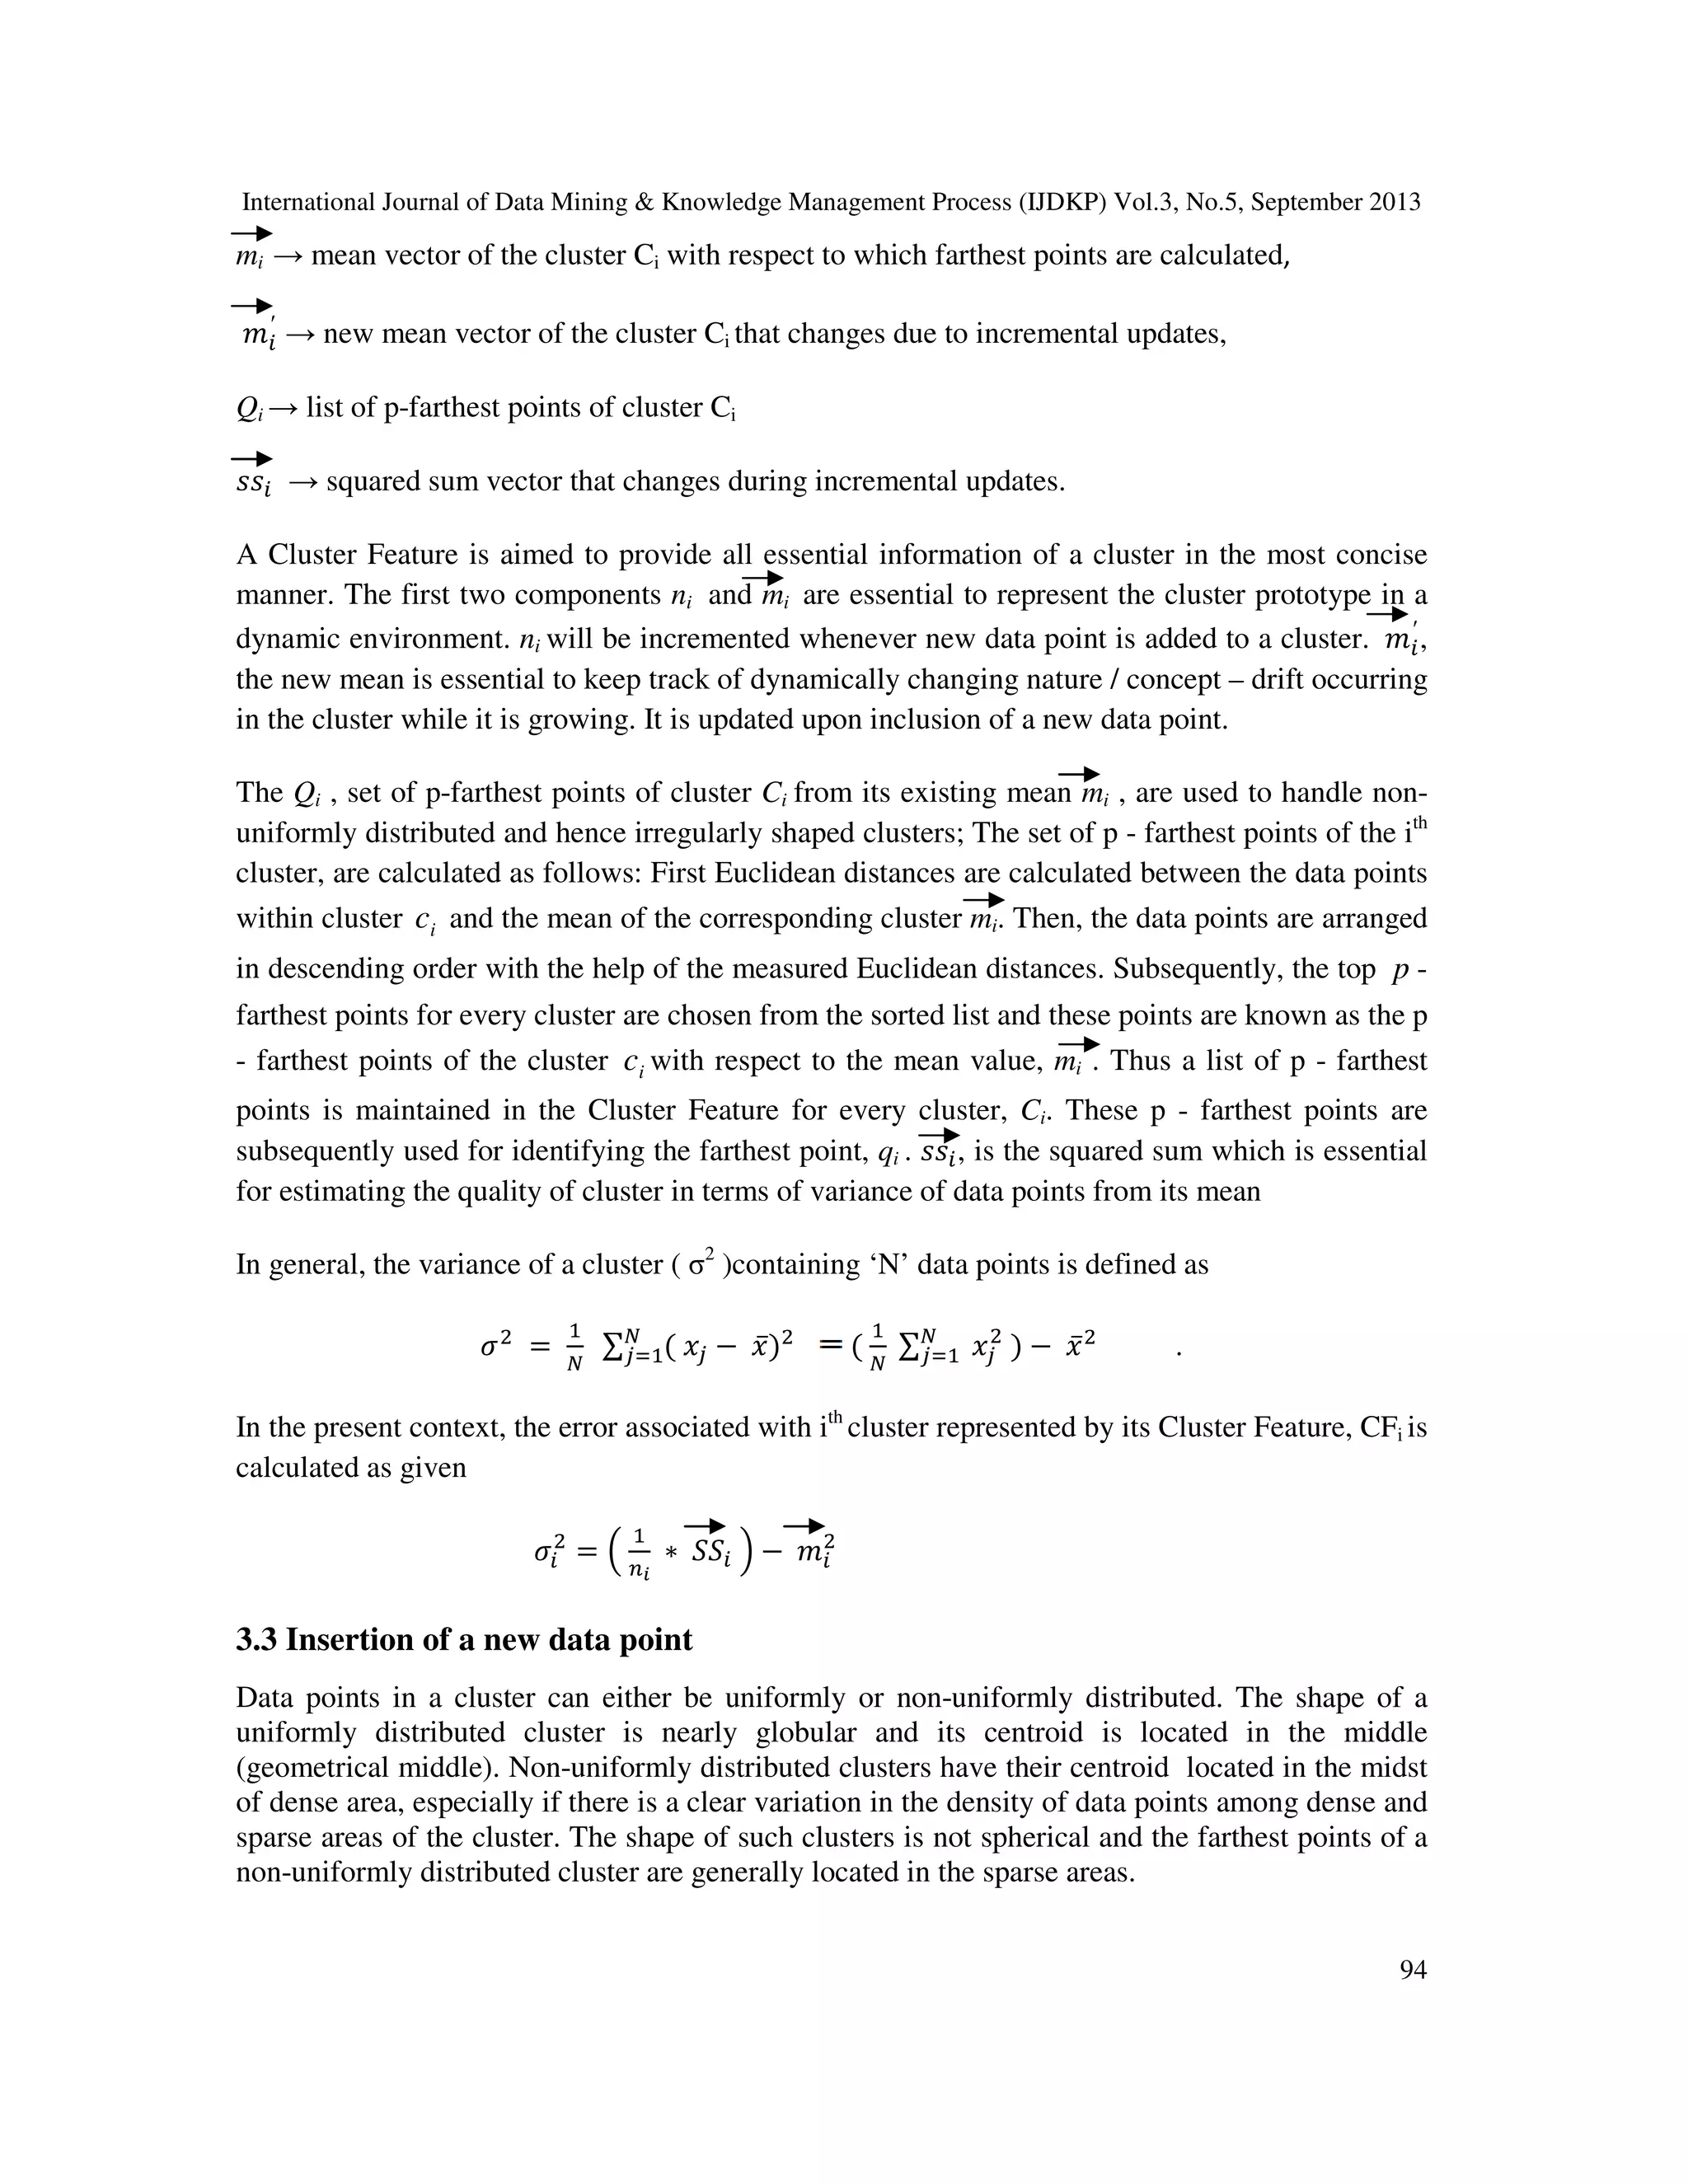
For clusters with uniformly distributed points, the usual distance measures like Euclidean
distance hold good for deciding the membership of a data point into a cluster. But there exist
applications where clusters have non-uniform distribution of data points. In such cases, the new
distance metric proposed above will be useful. The inverse proximity estimate, ܧܲܫ ∆௬
()
better
recognizes the discontinuities in data space while extending the cluster boundaries as explained
below.
3.3.3 Extendibility of the cluster boundary towards Sparse area Vs Dense area
Extendibility of a cluster to include a new point towards sparse area is based on a set of farthest
points defining its boundary around the sparse area.](https://image.slidesharecdn.com/newproximityestimateforincrementalupdateofnonuniformlydistributedclusters-131008031155-phpapp02/75/New-proximity-estimate-for-incremental-update-of-non-uniformly-distributed-clusters-7-2048.jpg)
![International Journal of Data Mining & Knowledge Management Process (IJDKP) Vol.3, No.5, September 2013
99
Upon the arrival of a new data point y∆ to the existing database DS which is already clustered
into C = {C1, C2, …….., Ck} clusters, its distance, ܧܲܫ ∆௬
()
to ith
cluster for all i = 1 to k is
calculated using the Equation specified in section 2.3.2
ܧܲܫ ∆௬
()
= ܦܧ (݉ , ∆)ݕ + [ ܦܧ (ݍ , ∆)ݕ ∗ ED (݉ , ݍ)]
where, ܦܧ (݉ , ∆)ݕ Euclidean distance between the points im and y∆
ܦܧ (ݍ , ∆)ݕ Euclidean distance between the points iQ and y∆
ED (݉ , ݍ) Euclidean distance between the points im and iQ
3.5 Finding the farthest point in the vicinity of incoming data point y∆
In order to find the farthest point qi ( data point in Qi ) which is in the vicinity of the incoming
data point y∆ , the Euclidean distance is calculated for that data point y∆ to each of the p -
farthest points of that cluster and the data point with minimum distance is designated as qi
thereby, for each cluster, the point having minimum distance is taken as the farthest point qi..
3.6 Finding the appropriate cluster
The proximity metric, IPE is used to find the appropriate cluster for the new data point, y∆ . The
new data point, y∆ is assigned to the closest cluster only if the calculated proximity, ܧܲܫ ∆௬
()
is
less than the predefined threshold value, λ. Otherwise, the data point y∆ is not included in any of
the existing clusters, but it separately forms a new singleton cluster. In such a case, the number of
clusters is incremented by one.
3.7 Updating of Cluster Feature
From the above section, it can be seen that, whenever a new data point, ∆ݕ is added to the
existing database, that new data point may be included into any of the existing clusters or it may
form a new cluster. So after the new point gets inserted, updating of CF is important for further
processing.
Case 1: Inclusion of new data point into any of the existing clusters
Whenever a new data point, ∆ݕ is included into an already existing cluster Ci its cluster feature
(CFi) is updated without requiring the original data points of Ci and hence supports incremental
update of the clustering solution.
In particular, the ni, ݉ప
′ ,ሬሬሬሬሬሬሬԦ and ݏݏ fields of CFi are updated upon the arrival of a new data point ∆ݕ
into the cluster Ci as given below:](https://image.slidesharecdn.com/newproximityestimateforincrementalupdateofnonuniformlydistributedclusters-131008031155-phpapp02/75/New-proximity-estimate-for-incremental-update-of-non-uniformly-distributed-clusters-9-2048.jpg)

![International Journal of Data Mining & Knowledge Management Process (IJDKP) Vol.3, No.5, September 2013
For pragmatic reasons, it was suggested to refresh the
from its original value indicating concept drift [Chen H.L et al. 2009]. After processing a new
chunk of data points from ∆SD the deviation in mean is calculated
Those clusters with deviation in mean greater than
clusters with significant concept
refresh involves finding a new set of p
clusters, the same set of p-farthest points along with the old mean value, m
be noted that mi in the CFi always represents the centro
identified. Hence needs to be changed whenever new set of p
above process of cluster refresh is applicable only to the incremented cluster C
of additional data points
4. EXPERIMENTAL ANALYSIS
CFICA has been implemented using the Iris [13], wine [14] and yeast [15] datasets from the UCI
machine learning repository. All the datasets were preprocessed. Iris and Wine datasets do not
have any missing values but Yeast dataset has some missing attribute values and such instances
were ignored. After preprocessing, yeast dataset had 1419 instances. Normally datasets used for
the purpose of analysis may contain too many attributes, which may or may not be relevant.
Therefore dimensionality reduction has been done on Wine and Yeast datasets as they contain a
considerable number of attributes. So the number of attributes came down from 13 to 3 for wine,
from 8 to 5 attributes for yeast datasets.
Fig 1. Purity of Wine dataset before and after dimensionality reduction
0
0.1
0.2
0.3
0.4
0.5
0.6
0.7
0.8
0.9
4
of Data Mining & Knowledge Management Process (IJDKP) Vol.3, No.5, September 2013
ragmatic reasons, it was suggested to refresh the CFi, only in case it deviates significantly
from its original value indicating concept drift [Chen H.L et al. 2009]. After processing a new
the deviation in mean is calculated as follows
Deviation in mean =
′
ି
Those clusters with deviation in mean greater than δ, based on a threshold are identified as
clusters with significant concept – drift and hence needs to be refreshed. The process of c
refresh involves finding a new set of p-farthest points for such clusters. For the remaining
farthest points along with the old mean value, mi is maintained. It may
always represents the centroid based on which the p-farthest points are
identified. Hence needs to be changed whenever new set of p-farthest points are identified. The
above process of cluster refresh is applicable only to the incremented cluster Ci
’
due to inclusion
NALYSIS
CFICA has been implemented using the Iris [13], wine [14] and yeast [15] datasets from the UCI
machine learning repository. All the datasets were preprocessed. Iris and Wine datasets do not
Yeast dataset has some missing attribute values and such instances
were ignored. After preprocessing, yeast dataset had 1419 instances. Normally datasets used for
the purpose of analysis may contain too many attributes, which may or may not be relevant.
erefore dimensionality reduction has been done on Wine and Yeast datasets as they contain a
considerable number of attributes. So the number of attributes came down from 13 to 3 for wine,
from 8 to 5 attributes for yeast datasets.
Fig 1. Purity of Wine dataset before and after dimensionality reduction
8
12
16
20
Before
After
of Data Mining & Knowledge Management Process (IJDKP) Vol.3, No.5, September 2013
102
, only in case it deviates significantly
from its original value indicating concept drift [Chen H.L et al. 2009]. After processing a new
, based on a threshold are identified as
drift and hence needs to be refreshed. The process of cluster
farthest points for such clusters. For the remaining
is maintained. It may
farthest points are
farthest points are identified. The
due to inclusion
CFICA has been implemented using the Iris [13], wine [14] and yeast [15] datasets from the UCI
machine learning repository. All the datasets were preprocessed. Iris and Wine datasets do not
Yeast dataset has some missing attribute values and such instances
were ignored. After preprocessing, yeast dataset had 1419 instances. Normally datasets used for
the purpose of analysis may contain too many attributes, which may or may not be relevant.
erefore dimensionality reduction has been done on Wine and Yeast datasets as they contain a
considerable number of attributes. So the number of attributes came down from 13 to 3 for wine,
Before
After](https://image.slidesharecdn.com/newproximityestimateforincrementalupdateofnonuniformlydistributedclusters-131008031155-phpapp02/75/New-proximity-estimate-for-incremental-update-of-non-uniformly-distributed-clusters-12-2048.jpg)
![International Journal of Data Mining & Knowledge Management Process (IJDKP) Vol.3, No.5, September 2013
Fig 2. Purity of Yeast dataset before and after dimensionality reduction
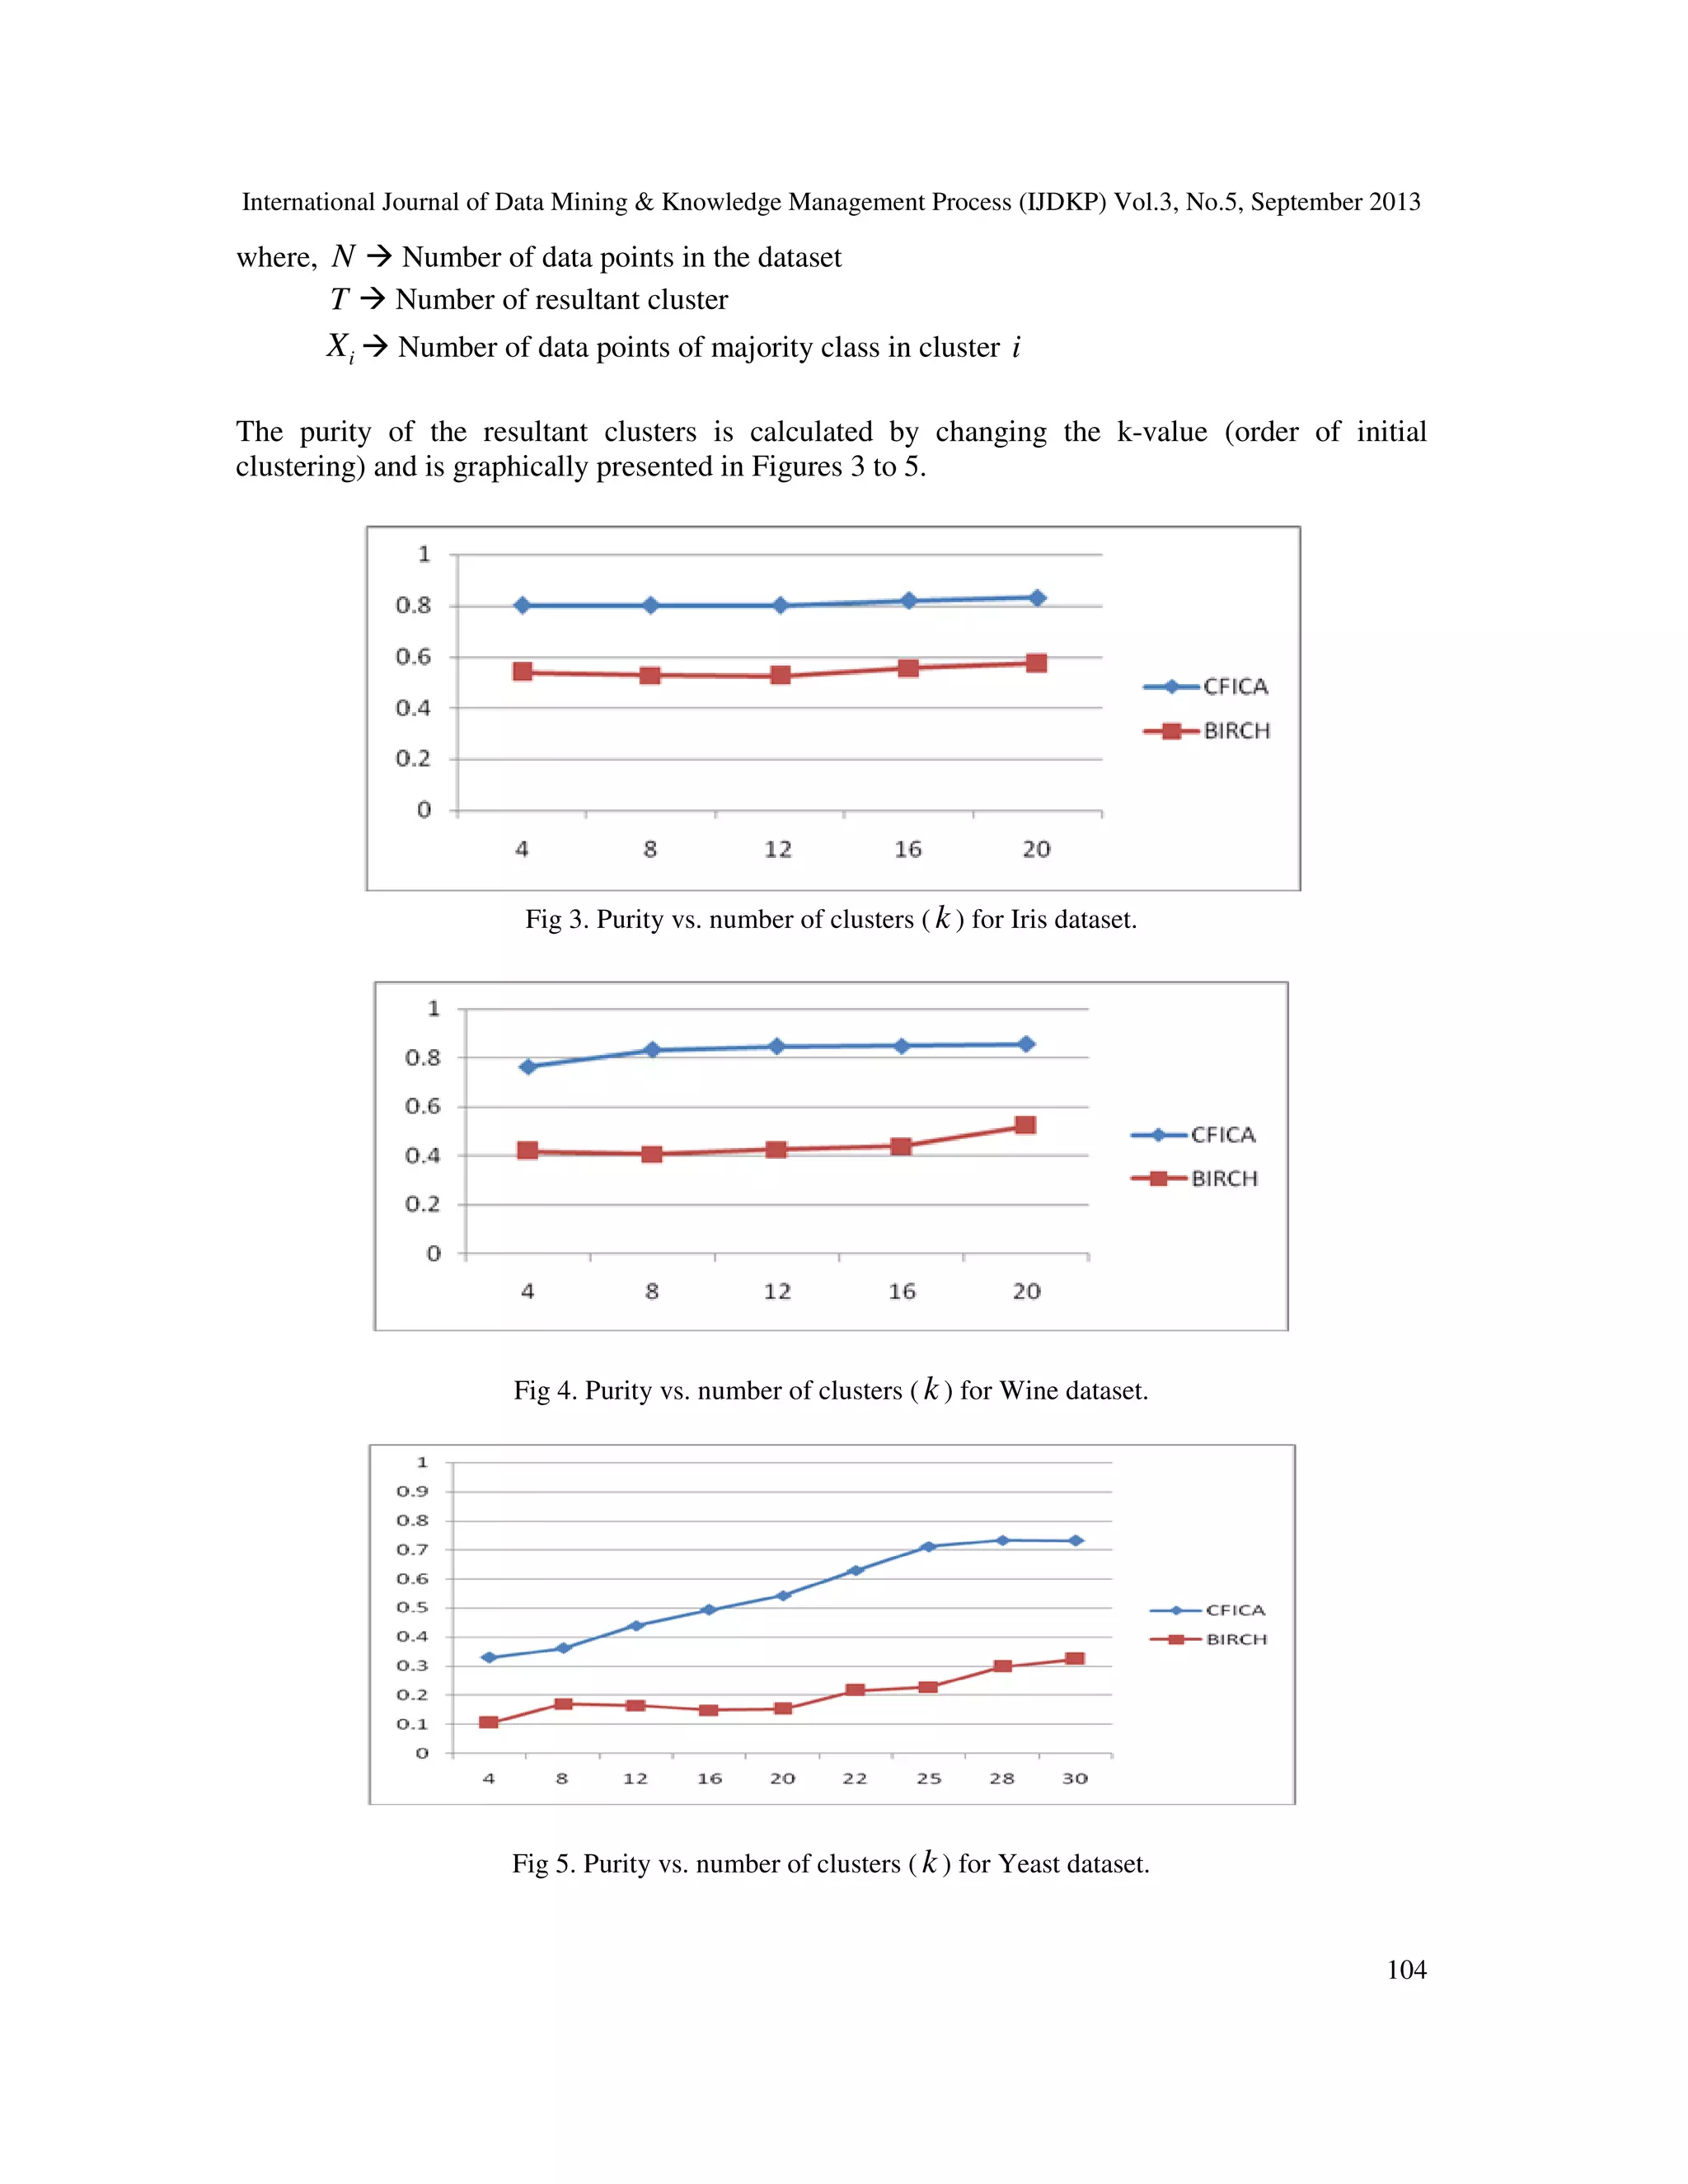
It can be seen from the above figures that the cluster purity increases after dimensionality
reduction has been done.
4.1 Cluster formation
The above datasets are processed dynamically by dividing the data points in each dataset into
chunks. For example, the Iris dataset is divided into 4 chunks (Iris1 consisting of 75 instances,
Iris2, Iris3 and Iris4 consisting of 25 instances each). Initially, the first chunk of data points is
given as input to the k-means algorithm for initial clustering i.e Iris1. It generates k number of
clusters. Then, the cluster feature is computed for those k initial clusters. The nex
points is input to the new approach incrementally. For each data point from the second chunk, the
Inverse Proximity Estimate (IPE) is computed and the data points are assigned to the
corresponding cluster if the calculated distance measure
value, λ. Otherwise, it forms as a separate cluster. Subsequently, the cluster feature is updated for
each data point. Once the whole chunk of data points is processed, the merging process is done if
only the Euclidean distance between the centroids of the pair of clusters is smaller than user
defined merging threshold, θ. Here,
obtained from the merging process and the cluster solution is updated incrementally
receiving the later chunks of data Iris3 and Iris4. Similarly, wine and yeast datasets are also
divided into 4 chunks as follows: wine1
wine4 - 28 instances, yeast1 - 700 instances, yeast 2
yeast4 - 168 instances and handled as above.
4.2 Metrics in which performance is estimated
Validation of clustering results is important. Therefore, the Purity Measure has been used to
evaluate the clustering results ob
to a single class. The purity measure described in [16] [17] has been used for evaluating the
performance of CFICA. The evaluation metric used in CFICA is given below,
0
0.2
0.4
0.6
0.8
4 8 12
of Data Mining & Knowledge Management Process (IJDKP) Vol.3, No.5, September 2013
Fig 2. Purity of Yeast dataset before and after dimensionality reduction
It can be seen from the above figures that the cluster purity increases after dimensionality
The above datasets are processed dynamically by dividing the data points in each dataset into
chunks. For example, the Iris dataset is divided into 4 chunks (Iris1 consisting of 75 instances,
ing of 25 instances each). Initially, the first chunk of data points is
means algorithm for initial clustering i.e Iris1. It generates k number of
clusters. Then, the cluster feature is computed for those k initial clusters. The next chunk of data
points is input to the new approach incrementally. For each data point from the second chunk, the
Inverse Proximity Estimate (IPE) is computed and the data points are assigned to the
corresponding cluster if the calculated distance measure is less than the predefined threshold
. Otherwise, it forms as a separate cluster. Subsequently, the cluster feature is updated for
each data point. Once the whole chunk of data points is processed, the merging process is done if
distance between the centroids of the pair of clusters is smaller than user
θ. Here, λ = 10 and θ = 4.Finally, the set of resultant clusters are
obtained from the merging process and the cluster solution is updated incrementally
receiving the later chunks of data Iris3 and Iris4. Similarly, wine and yeast datasets are also
divided into 4 chunks as follows: wine1 - 100 instances, wine2 and wine3 - 25 instances each,
700 instances, yeast 2 – 350 instances, yeast3 - 200 instances,
168 instances and handled as above.
4.2 Metrics in which performance is estimated
Validation of clustering results is important. Therefore, the Purity Measure has been used to
evaluate the clustering results obtained. A cluster is called a pure cluster if all the objects belong
to a single class. The purity measure described in [16] [17] has been used for evaluating the
performance of CFICA. The evaluation metric used in CFICA is given below,
Purity =
ଵ
ே
∑ ܺ
்
ୀଵ
16 20 22 25 28 30
Before
After
of Data Mining & Knowledge Management Process (IJDKP) Vol.3, No.5, September 2013
103
It can be seen from the above figures that the cluster purity increases after dimensionality
The above datasets are processed dynamically by dividing the data points in each dataset into
chunks. For example, the Iris dataset is divided into 4 chunks (Iris1 consisting of 75 instances,
ing of 25 instances each). Initially, the first chunk of data points is
means algorithm for initial clustering i.e Iris1. It generates k number of
t chunk of data
points is input to the new approach incrementally. For each data point from the second chunk, the
Inverse Proximity Estimate (IPE) is computed and the data points are assigned to the
is less than the predefined threshold
. Otherwise, it forms as a separate cluster. Subsequently, the cluster feature is updated for
each data point. Once the whole chunk of data points is processed, the merging process is done if
distance between the centroids of the pair of clusters is smaller than user
= 4.Finally, the set of resultant clusters are
obtained from the merging process and the cluster solution is updated incrementally upon
receiving the later chunks of data Iris3 and Iris4. Similarly, wine and yeast datasets are also
25 instances each,
200 instances,
Validation of clustering results is important. Therefore, the Purity Measure has been used to
tained. A cluster is called a pure cluster if all the objects belong
to a single class. The purity measure described in [16] [17] has been used for evaluating the
Before
After](https://image.slidesharecdn.com/newproximityestimateforincrementalupdateofnonuniformlydistributedclusters-131008031155-phpapp02/75/New-proximity-estimate-for-incremental-update-of-non-uniformly-distributed-clusters-13-2048.jpg)
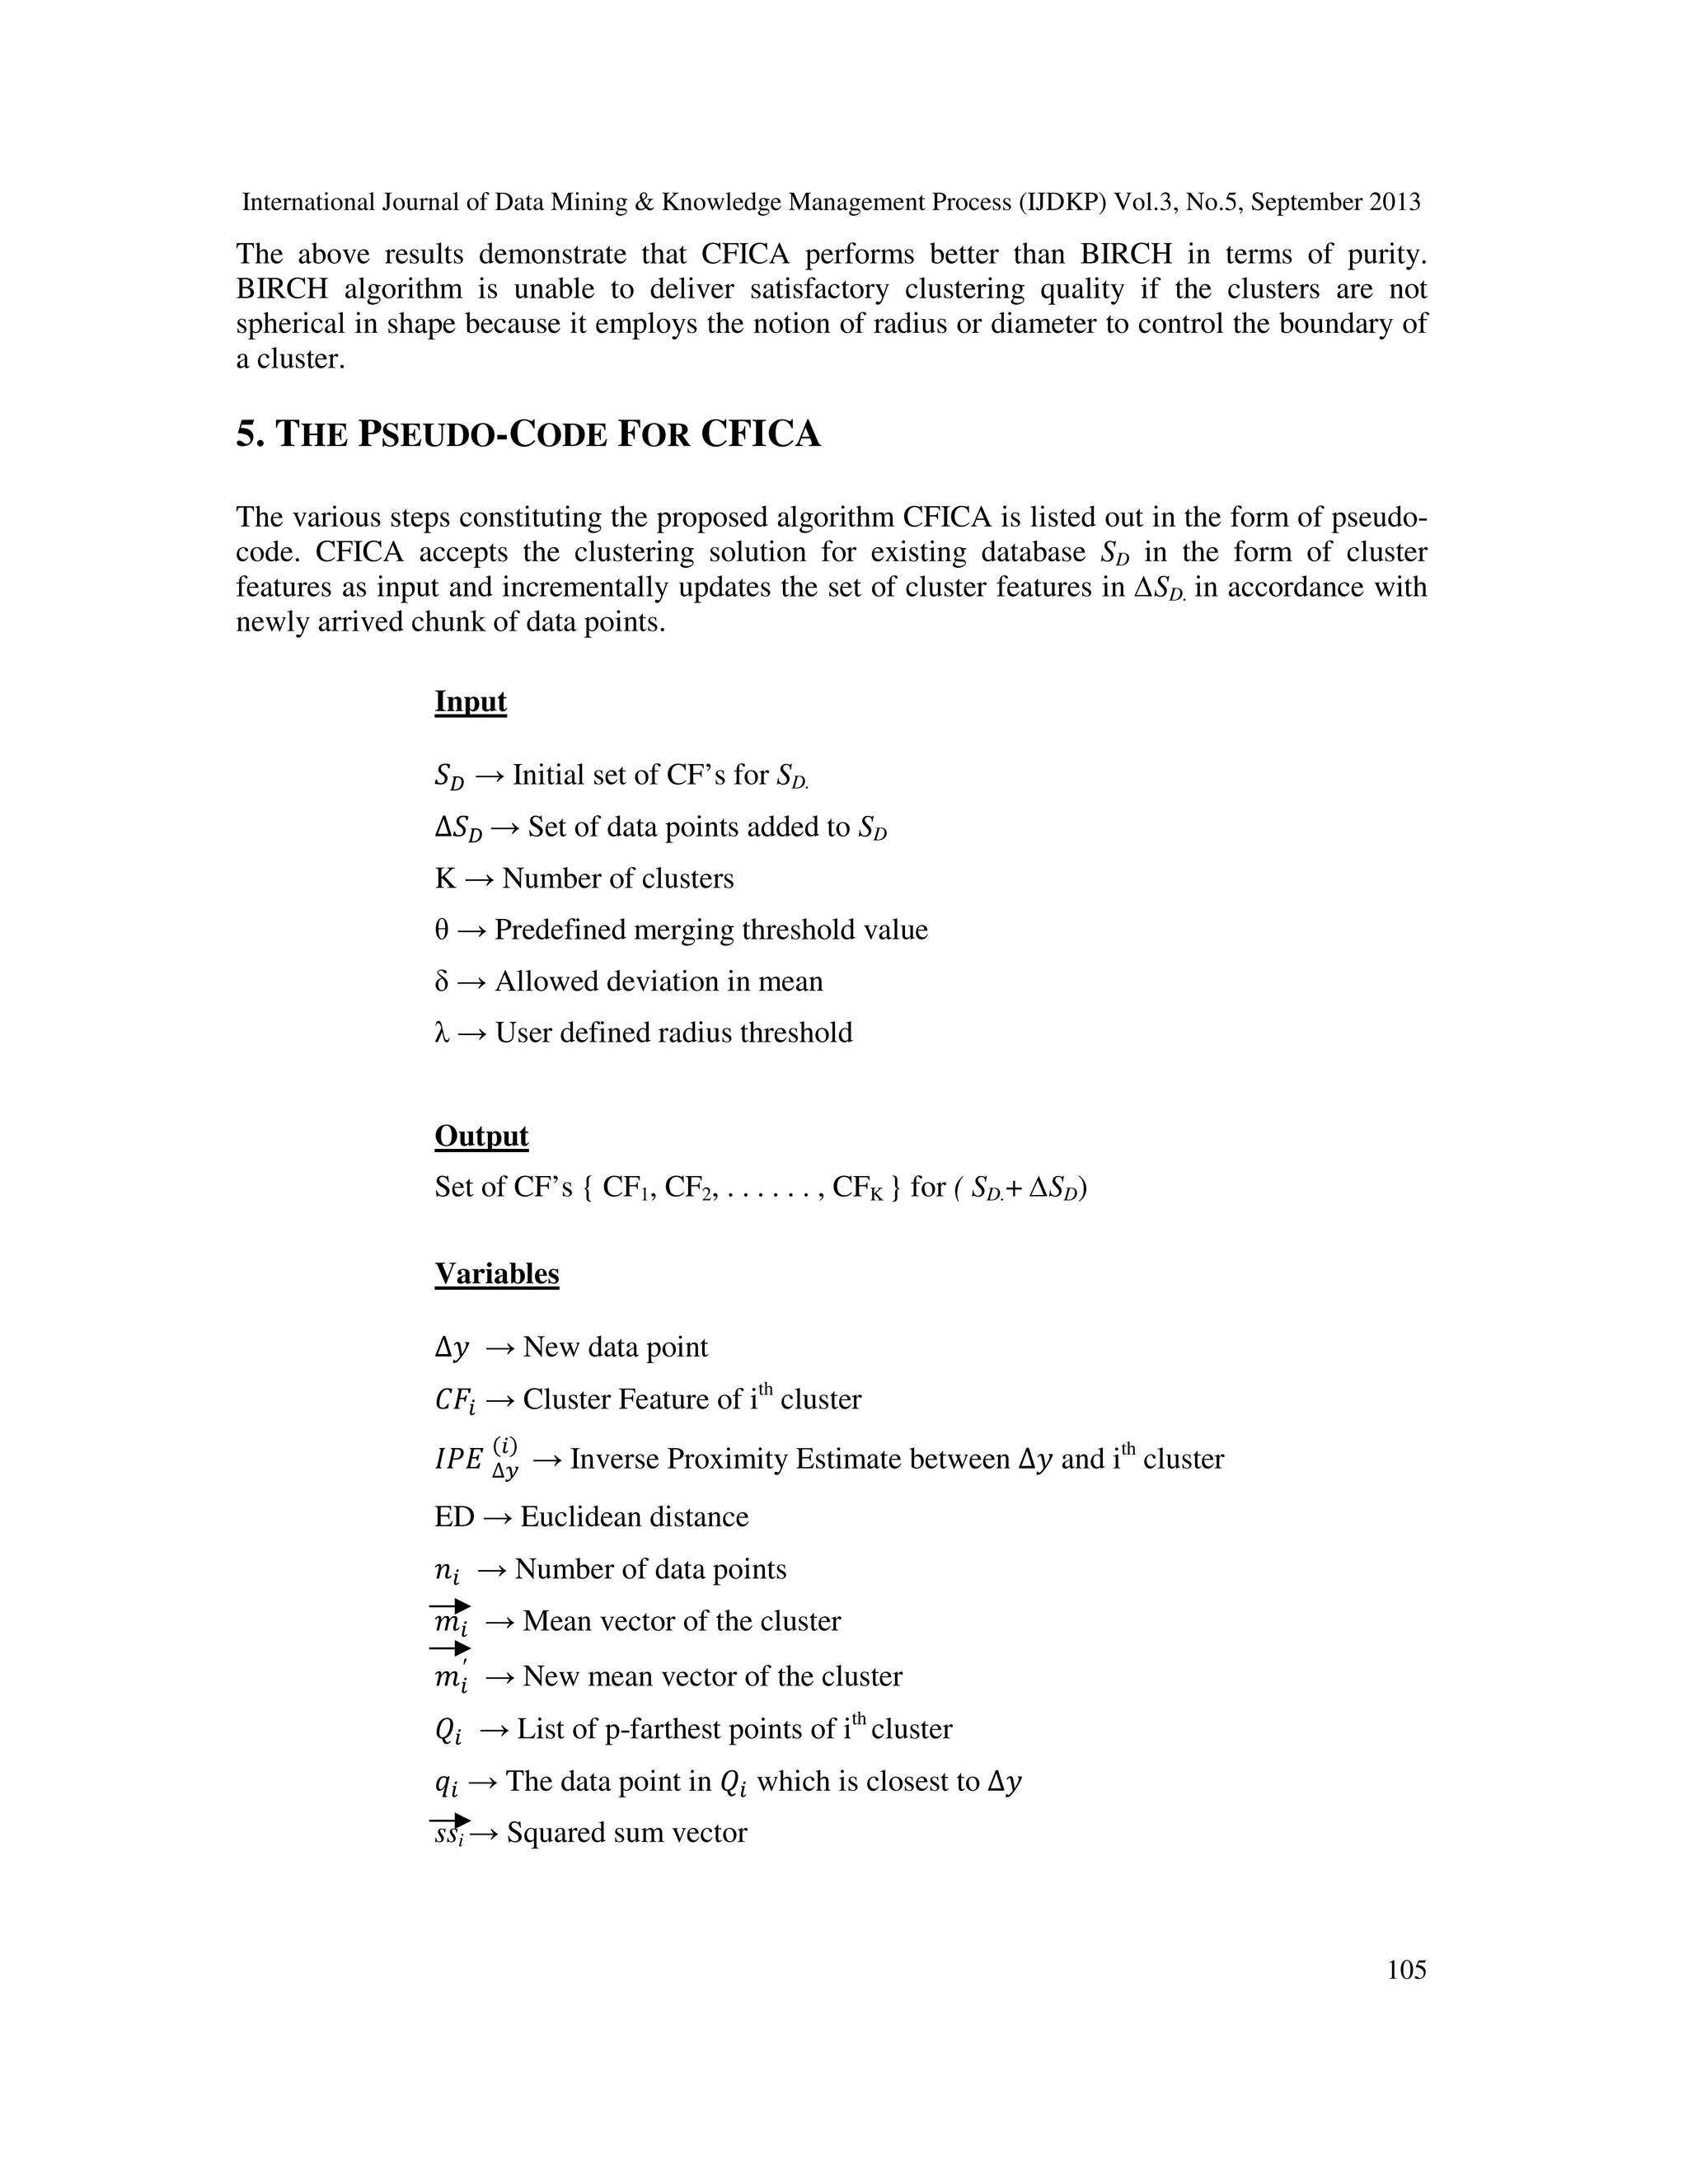
![International Journal of Data Mining & Knowledge Management Process (IJDKP) Vol.3, No.5, September 2013
106
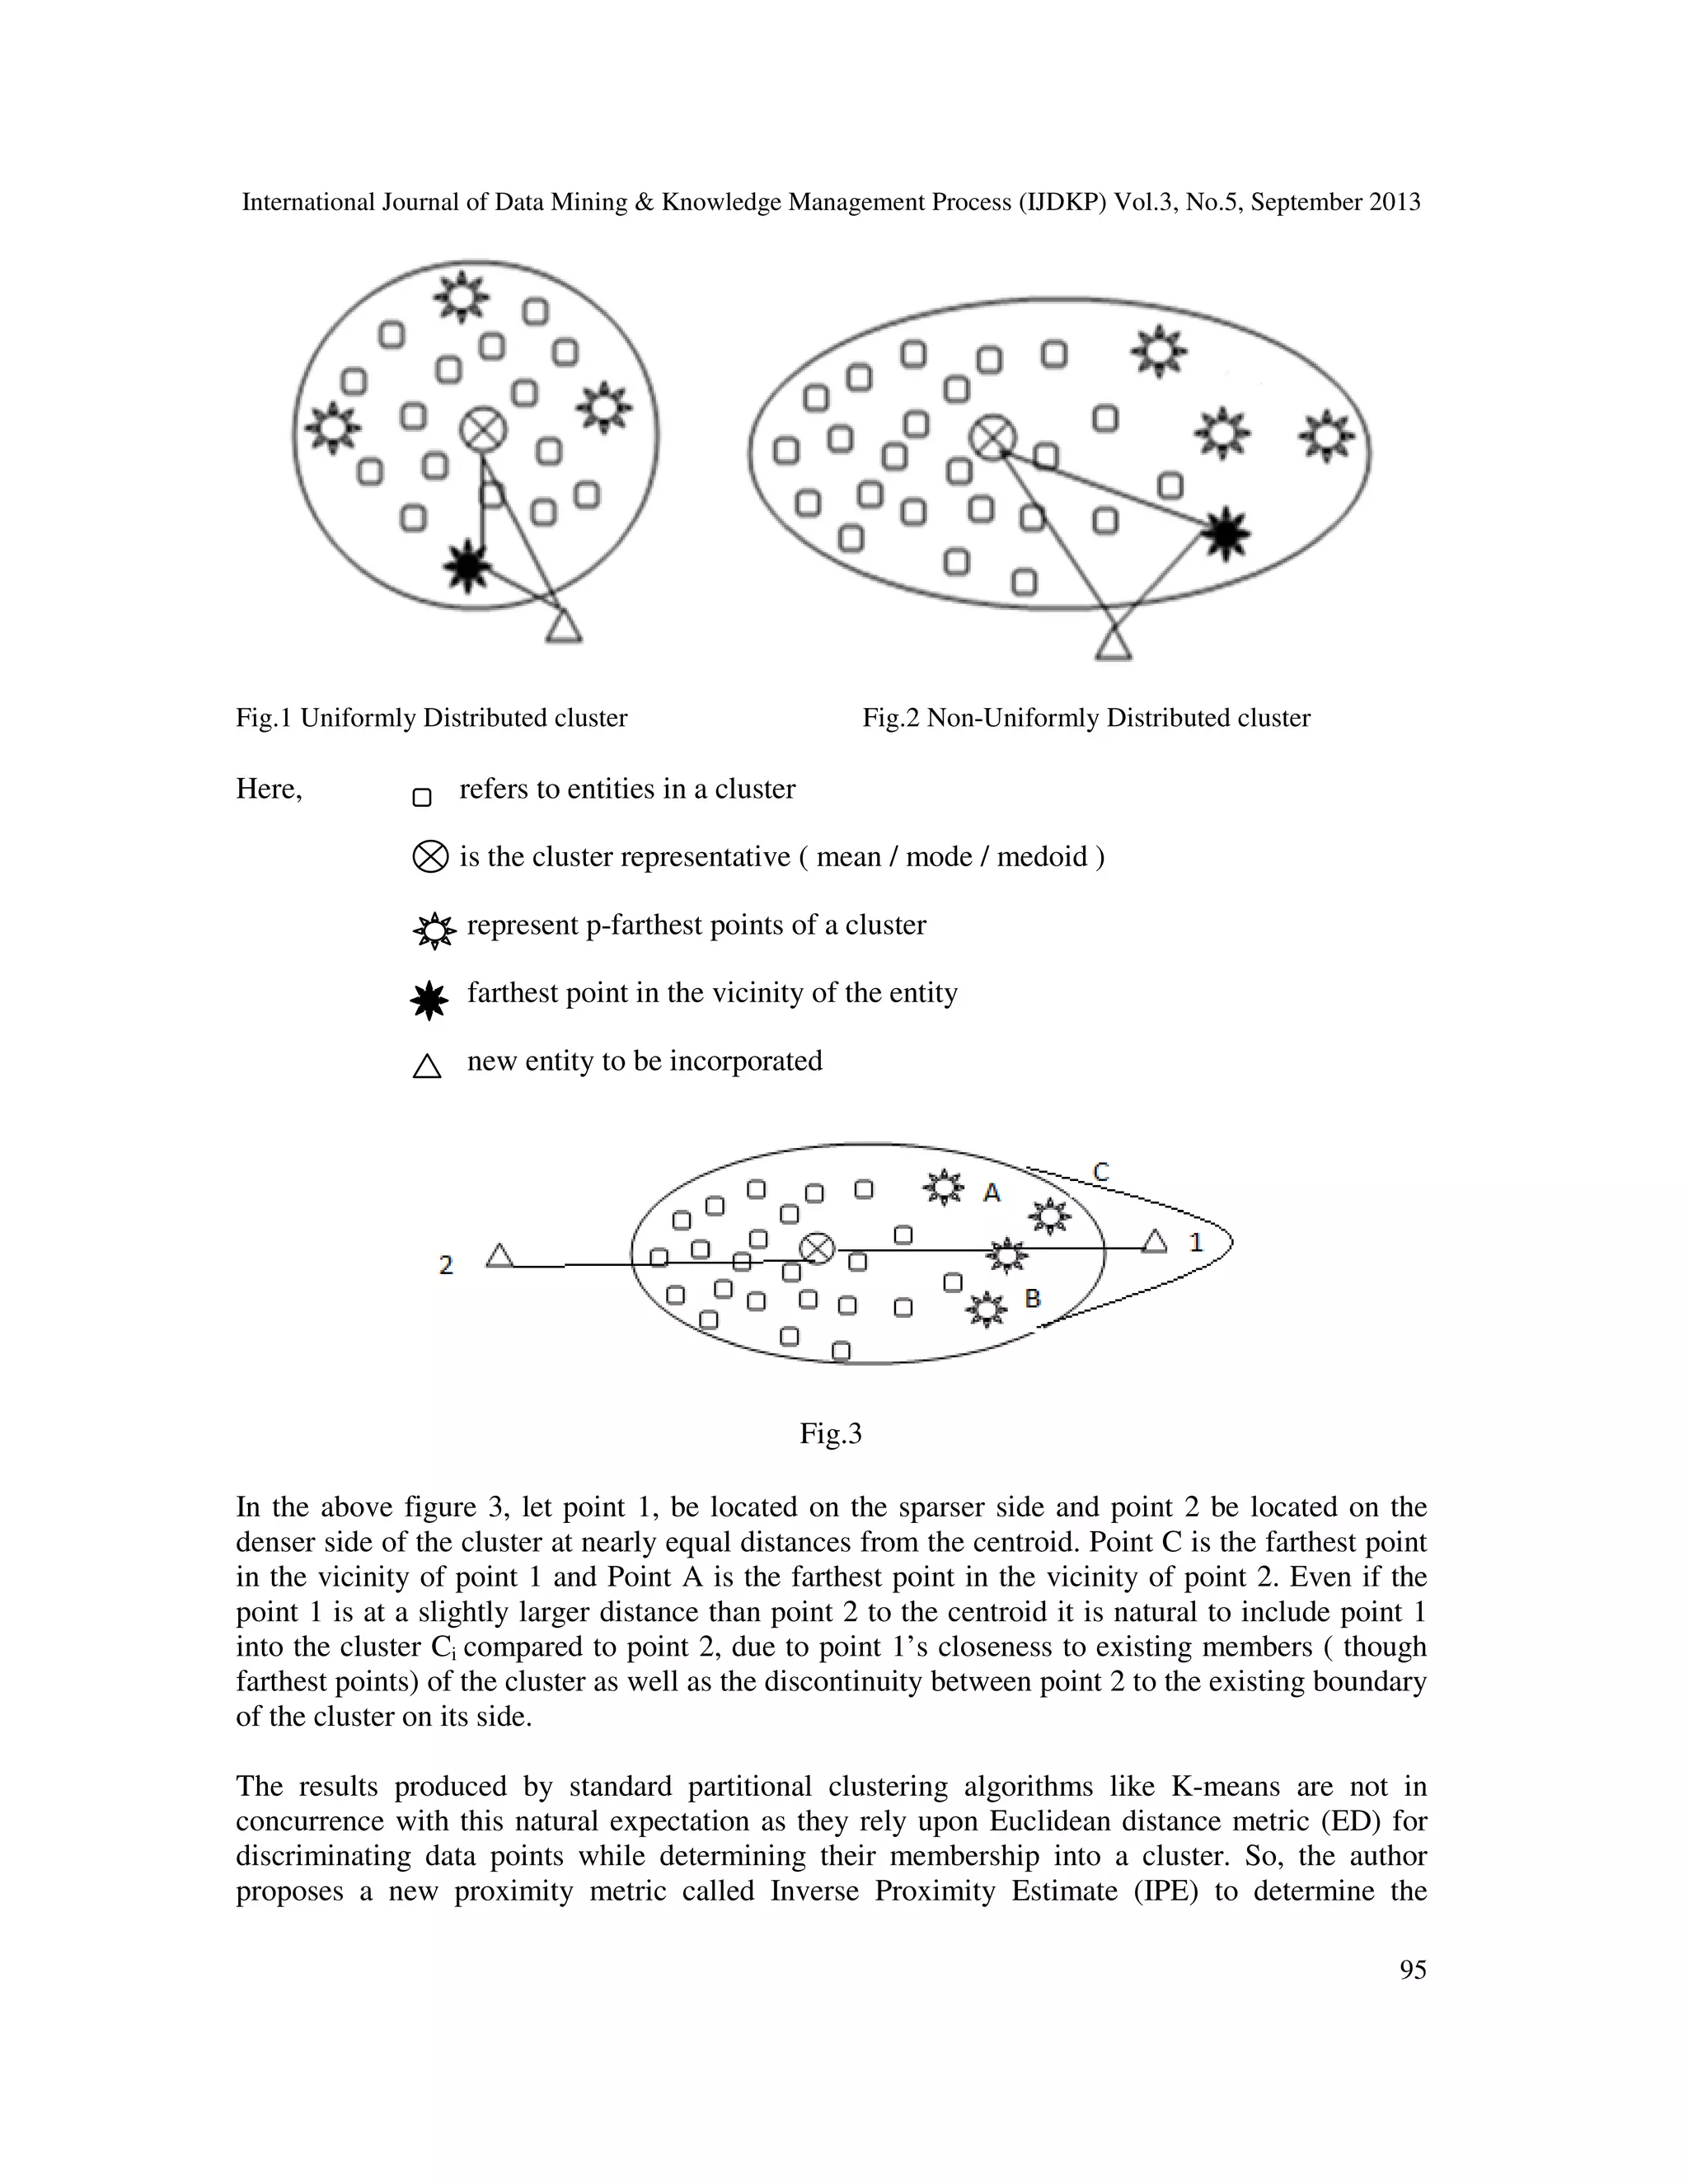
Algorithm
1) Compute Cluster Feature for every cluster ܥ
CFi = { ni, mi, mi
'
, Qi, ssi}
a = k;
2) For each data point ∆ݕ ߳ ∆ܵ
a) For i from 1 to a
Calculate Inverse Proximity Estimate of ∆ݕ to the ith
cluster
ܧܲܫ ∆௬
()
= ܦܧ (݉ , ∆)ݕ + [ ܦܧ (ݍ , ∆)ݕ ∗ ED (݉ , ݍ)]
b) Find suitable cluster j = arg mini { ܧܲܫ ∆௬
()
}
if ( ܧܲܫ ∆௬
()
< λ )
{
insert ∆ݕ into its closest cluster j and update its CF as follows:
CFj = { (nj +1), mj,
ೕ∗ ೕା ∆௬
ೕା ଵ
, qj,(SSi +squared components of ∆})ݕ
if ( deviation in mean =
|ೕ
′
ି ೕ|
|ೕ|
> ߜ)
Read the data points of jth
cluster to recompute CFj.
}
else create a new cluster
{
increment a
insert ∆ݕ into ath
cluster
CFa = {1, ma , ma
'
, ∆y, squared components of ∆y}
}](https://image.slidesharecdn.com/newproximityestimateforincrementalupdateofnonuniformlydistributedclusters-131008031155-phpapp02/75/New-proximity-estimate-for-incremental-update-of-non-uniformly-distributed-clusters-16-2048.jpg)
![International Journal of Data Mining & Knowledge Management Process (IJDKP) Vol.3, No.5, September 2013
107
3) If ( a > k ) merge cluster pair
(i) Compute ED between every pair of cluster centroids based on ݉.
(ii) For cluster pairs with ( ED≪ ߠ ), find increase in variance.
(iii) Merge the cluster pair with minimum increase in variance
Decrement a
(iv) Recalculate CF of merged cluster
CFk = { ( ni + nj ),
(୬ ∗ ୫) ା (୬ౠ ∗ ୫ౠ)
ೖ
, ݉k = ݉
′
, qk,, SSk = SSi + SSj }
Find its ED to other clusters.
(v) Repeat steps (i) to (iv) until ( a = k )
4) Print cluster solution as the set of cluster features.
Wait for the arrival of new chunk of data points upon which call CFICA
again.
6. CONCLUSIONS
An incremental clustering algorithm called Cluster Feature-Based Incremental Clustering
Approach for numerical data (CFICA) which makes use of Inverse Proximity Estimate to handle
entities described in terms of only numerical attributes was developed and evaluated. Cluster
Feature while being compact includes all essential information required for maintenance and
expansion of clusters. Thus CFICA avoids redundant processing which is the essential feature of
an incremental algorithm. The performance of this algorithm, in terms of purity is compared with
the state of art incremental clustering algorithm namely BIRCH on different bench mark datasets.
REFERENCES
[1] Hartigan, J.A. 1975. Clustering Algorithms. John Wiley and Sons, Inc., New York, NY.
[2] Fisher D., “Knowledge acquisition via incremental conceptual clustering,” Machine Learning,
vol. 2, 1987, pp.139-172.
[3] Fisher , D., Xu, L., Carnes, R., Rich, Y., Fenves, S.J., Chen, J., Shiavi, R., Biswas, G., and
Weinberg, J. 1993. Applying AI clustering to engineering tasks. IEEE Expert 8, 51–60.
[4] J. Gennary, P. Langley, and D. Fisher, “Models of Incremental Concept Formation,” Artificial
Intelligence Journal, vol. 40, 1989, pp. 11-61.](https://image.slidesharecdn.com/newproximityestimateforincrementalupdateofnonuniformlydistributedclusters-131008031155-phpapp02/75/New-proximity-estimate-for-incremental-update-of-non-uniformly-distributed-clusters-17-2048.jpg)
![International Journal of Data Mining & Knowledge Management Process (IJDKP) Vol.3, No.5, September 2013
108
[5] Fazil Can, “Incremental Clustering for Dynamic Information Processing”, ACM Transactions on
Information Systems, April 1993, Vol. 11, No. 2, pp. 143-164.
[6] M. Charikar, C. Chekuri, T. Feder, and R. Motwani, “Incremental clustering and dynamic
information retrieval,” 29th Symposium on Theory of Computing, 1997, pp. 626—635.
[7] Tian Zhang , Raghu Ramakrishnan , Miron Livny, “BIRCH: an efficient data clustering method
for very large databases”, Proceedings of the ACM SIGMOD International. Conference on
Management of Data, pp 103-114, 1996.
[8] Ester, M., Kriegel, H., Sander, J., Xu X., Wimmer, M., “Incremental Clustering for Mining in a
Data Warehousing Environment”, Proceedings of the 24th International. Conference on Very
Large Databases (VLDB’98), New York, USA, 1998, pp. 323-333.
[9] Chien-Yu Chen, Shien-Ching Hwang, and Yen-Jen Oyang, "An Incremental Hierarchical Data
Clustering Algorithm Based on Gravity Theory", Proceedings of the 6th Pacific- Asia
Conference on Advances in Knowledge Discovery and Data Mining, 2002, pp: 237 – 250.
[10] Serban G., Campan A., "Incremental Clustering Using a Core-Based Approach", Lecture Notes
in Computer Science, Springer Berlin, Vol: 3733, pp: 854-863, 2005.
[11] Fotakis D., "Incremental algorithms for Facility Location and k-Median", Theoretical Computer
Science, Vol: 361, No: 2-3, pp: 275-313, 2006.
[12] Jain A.K., Murthy M.N., Flynn P.J., “Data Clustering: A Review”, ACM Computing Surveys,
September 1999, Vol. 31, No.3, pp. 264 – 323.
[13] Iris dataset : http://archive.ics.uci.edu/ml/datasets/Iris
[14] Wine dataset : http://archive.ics.uci.edu/ml/datasets/Wine
[15] Yeast dataset : http://archive.ics.uci.edu/ml/datasets/Yeast
[16] Huang Z, “Extensions to the k-Means Algorithm for Clustering Large Data Sets With
Categorical Values”, Data Mining and Knowledge Discovery, 1998, Vol. 2, pp. 283–304.
[17] Xiaoke Su, Yang Lan, Renxia Wan, and Yuming Qin, “A Fast Incremental Clustering
Algorithm”, Proceedings of the 2009 International Symposium on Information Processing
(ISIP’09), 2009, pp. 175-178.
[18] Sowjanya A.M. and Shashi M., “Cluster Feature-Based Incremental Clustering Approach
(CFICA) For Numerical Data”, IJCSNS International Journal of Computer Science and Network
Security, Vol.10, No.9, September 2010.](https://image.slidesharecdn.com/newproximityestimateforincrementalupdateofnonuniformlydistributedclusters-131008031155-phpapp02/75/New-proximity-estimate-for-incremental-update-of-non-uniformly-distributed-clusters-18-2048.jpg)


The paper introduces cfica, an incremental clustering algorithm designed for numerical data in dynamically growing databases, addressing the limitations of conventional clustering methods that rely on static databases. It proposes a new proximity metric called inverse proximity estimate (ipe) that evaluates the membership of a data point in a cluster based on its distance to both a cluster representative and the furthest points within the cluster. This approach allows for efficient updating of cluster formations in response to new data, making it suitable for non-uniformly distributed data.