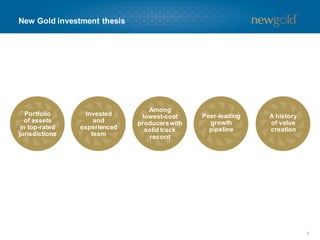
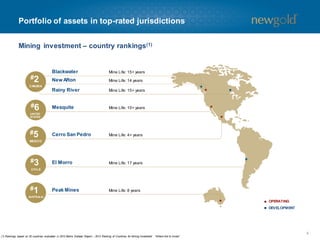
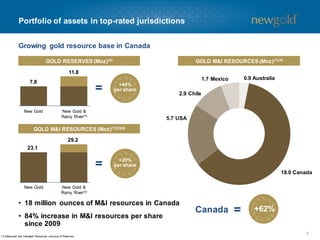
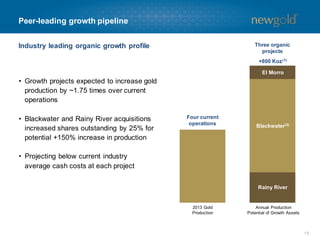
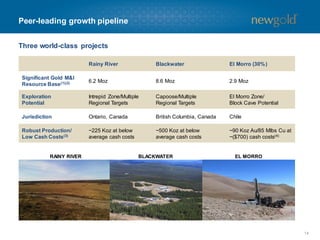
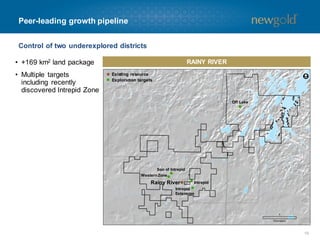
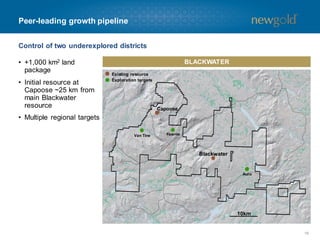
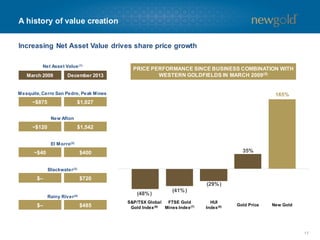
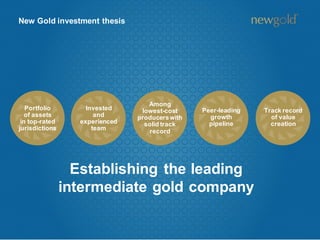
Desjardins Mining
Conference
December 2013
Cautionary statements
All monetary amounts in U.S. dollars unless otherw ise stated
Total cash costs shown net of by-product sales unless otherwise stated
CAUTIONARY NOTE REGARDING FORWARD-LOOKING STATEMENTS
Certain information contained in this presentation, including any information relating to New Gold’s future financial or operating performance as well as information respecting Rainy River and
its assets may be deemed “forward looking”. All statements in this presentation, other than statements of historical fact, that address events or developments that New Gold expects to occur
are “forward-looking statements”. Forward-looking statements are statements that are not historical facts and are generally, but not always, identified by the use of forward-looking terminology
such as “plans”, “expects”, “is expected”, “budget”, “scheduled”, “estimates”, “forecasts”, “intends”, “anticipates”, “projec ts”, “potential”, “believes” or variations of such words and phrases or
statements that certain actions, events or results “may”, “could”, “would”, “should”, “might” or “will be taken”, “occur” or “be achieved” or the negative connotation. Forward-looking statements in
this presentation include, among others, statements with respect to: guidance for production, cash costs and all -in sustaining costs (and its components); the potential difference between gold
price and cash and all -in sustaining costs, including relative to other companies; potential modifications to operations (and the cost of any such modifications) and potential opportunities to
increase throughput at New Afton exploration potential and the results of future exploration activities; expected future mining activities; the expected or potential annual production, expected
cash costs and expected development cost of New Gold’s projects; the estimation of mineral reserves and resources and the realization of such estimates; the expected life of New Gold’s
mines and projects; the timing of completion of feasibility studies or updates, reserve updates and other technical work or reports; the adequacy of capital resources; and expected capital
expenditures and exploration expenditures.
All forward-looking statements in this presentation are based on the opinions and estimates of management as of the date such statements are made and are subject to important ri sk factors
and uncertainties, many of which are beyond New Gold’s ability to control or predict. Material assumptions regarding our forw ard looking statements are discussed in this presentation, the
annual MD&A, the AIF and our Technical Reports. Forward-looking statements are necessarily based on estimates and assumptions that are inherently subject to known and unknown risks,
uncertainties and other factors that may cause actual results, level of activity, performance or achievements to be materiall y different from those expressed or implied by such forward-looking
statements. Such factors include, without limitation: significant capital requirements; price volatility in the spot and forward markets for commodities; fluctuations in the international currency
markets and in the rates of exchange of the currencies of Canada, the United States, Australia, Mexico and Chile; discrepancies between actual and estimated production, between actual and
estimated reserves and resources and between actual and estimated metallurgical recoveries; changes in national and local gov ernment legislation in Canada, the United States, Australia,
Mexico and Chile or any other country in which New Gold currently or may in the future carry on business; taxation; controls, regulations and political or economic developments in the
countries in which New Gold does or may carry on business; the speculative nature of mineral exploration and development, inc luding the risks of obtaining and maintaining the validity and
enforceability of the necessary licenses and permits and complying with the permitting requirements of each jurisdiction in which New Gold operates, including, but not limited to: in Canada,
obtaining the necessary permits for Blackwater and the Rainy River Gold Project; in Mexico, where Cerro San Pedro has a history of ongoing legal challenges related to our environmental
authorization (EIS); and in Chile, where the courts had temporarily suspended the approval of the environmental permit for El Morro; the lack of certainty with respect to foreig n legal systems,
which may not be immune from the influence of political pressure, corruption or other factors that are inconsistent with the rule of law; the uncertainties inherent to current and future legal
challenges New Gold is or may become a party to; diminishing quantities or grades of reserves and resources; competition; loss of key employees; additional funding requirements; rising costs
of labour, supplies, fuel and equipment; actual results of current exploration or reclamation activities; uncertainties inherent to mining economic studies including the PEA for Blackwater and
the Feasibility Study for the Rainy River Gold Project; changes in project parameters as plans continue to be refined; accidents; labour disputes; defective title to mineral claims or property or
contests over claims to mineral properties; uncertainties with respect to the successful integration of the business of Rainy River within the business of New Gold; unexpected delays and costs
inherent to consulting and accommodating rights of First Nations; and uncertainties with respect to obtaining all necessary surface rights for the Rainy River Project. In addition, there are risks
and hazards associated with the business of mineral exploration, development and mining, including environmental events and h azards, industrial accidents, unusual or unexpected formations
,
pressures, cave-ins, flooding and gold bullion losses (and the risk of inadequate insurance or inability to obtain insurance to cover these risks) as well as “Risk Factors” included in New Gold’s
(and, in respect to information related to the Rainy River Gold Project, in Rainy River’s) disclosure documents filed on and available at www.sedar.com. Forward-looking statements are not
guarantees of future performance, and actual results and future events could materially differ from those anticipated in such statements. All of the forward-looking statements contained in this
presentation are qualified by these cautionary statements. New Gold expressly disclaims any intention or obligation to update or revise an y forward-looking statements whether as a result of
new information, events or otherwise, except in accordance with applicable securities laws.
All endnotes can be found at the conclusion of the presentation and should be reviewed.

2
New Gold investment thesis

Portfolio
of assets
in top-rated
jurisdictions

Invested
and
experienced
team

Among
lowest-cost
producers with
solid track
record

Peer-leading
growth
pipeline

A history
of value
creation

3
Portfolio of assets in top-rated jurisdictions
Mining investment – country rankings (1)

Blackwater

Mine Life: 15+ years

New Afton

Mine Life: 14 years

Rainy River

#2

Mine Life: 15+ years

Mesquite

Mine Life: 10+ years

Cerro San Pedro

Mine Life: 4+ years

El Morro

Mine Life: 17 years

Peak Mines

Mine Life: 8 years

CANADA

#6
UNITED
STATES

#5
MEXICO

#3
CHILE

#1
AUSTRALIA

OPERATING
DEVELOPMENT

(1) Rankings based on 25 countries evaluated in 2013 Behre Dolbear Report – 2013 Ranking of Countries for Mining Investm
ent: “Where Not to Invest”.

4
Portfolio of assets in top-rated jurisdictions
Growing gold resource base in Canada
GOLD RESERVES (Moz)(4)

GOLD M&I RESOURCES (Moz)(1)(4)

11.8

New Gold

0.9 Australia

1.7 Mexico

7.8

=

+44%
per share

New Gold &
Rainy River(3)

2.9 Chile

5.7 USA

GOLD M&I RESOURCES (Moz)(1)(2)(4)
29.2

23.1

=

+20%
per share

18.0 Canada
New Gold

New Gold &
Rainy River(3)

• 18 million ounces of M&I resources in Canada

• 84% increase in M&I resources per share
since 2009
(1) Measured and Indicated Resources inclusive of Reserves.

Canada

=

+62%
5
Invested and experienced team
Significantly invested team
EXECUTIVE MANAGEMENT TEAM

BOARD OF DIRECTORS

Randall Oliphant

Executive Chairman

David Emerson

Former Canadian Cabinet Minister

Robert Gallagher

President & CEO

James Estey

Former Chairman,
UBS Securities Canada

Brian Penny

Executive VP & CFO
Robert Gallagher

President & CEO

Vahan Kololian

Founder, Terra Nova Partners

Martyn Konig

Former Executive Chairman,
European Goldfields

Pierre Lassonde

Chairman, Franco-Nevada

Randall Oliphant

Executive Chairman

Raymond Threlkeld

Mining Consultant

Ernie Mast

VP Operations

Collectively ~$70 million invested in New Gold

6
Among lowest-cost producers with solid track record
Lower costs driving margin expansion
• $150 - $200 per ounce lower all-in
sustaining costs(1) results in incremental
margin(2)
• ~$100 per ounce decrease
in cash costs(3) from 2009 to 2013E

2013 GUIDANCE –
ALL-IN SUSTAINING COSTS ($/OZ)(1)

~$1,100
~$1,050
~$900

• Copper and silver create effective hedge

New Gold

Mid-Tier
Average(4)

Senior Average(5)

7
Among lowest-cost producers with solid track record
2013 outlook

Gold production(1)

Copper production

Silver production

390-400 Koz

78-88 Mlbs

~1.3 Moz

2013
Total cash costs(2)

~$375/oz

Assum
ptions for the fourth quarter of 2013: Gold - $1,300 per ounce; Copper - $3.25 per pound; Silver - $20.00 per ounce; AUD/USD and CDN/USD parity.

2013
All-in sustaining
costs(2)(3)

~$900/oz

8
Among lowest-cost producers with solid track record
New Afton hitting its stride

• Evaluating potential for further
throughput increases in 2014 and
beyond

COPPER

GRADE (g/t)

• Achieved targeted throughput
increase to 12,000 tonnes per
day three months ahead of
schedule

GOLD

GRADE (%)

0.96%
0.78

0.67

Q1 2013

0.82

Q2 2013

Q3 2013

Q1 2013

0.98%

Q2 2013

Q3 2013

0.79%

RECOVERY (%)

87%

RECOVERY (%)

88%

87%

88%

Q2 2013

Q3 2013

83%
81%

Q1 2013

Q2 2013

Q3 2013

Q1 2013

PRODUCTION (Koz)

22

PRODUCTION (Mlbs)

25
19

15

Q1 2013

21

12

Q2 2013

Q3 2013

Q1 2013

Q2 2013

Q3 2013
9
Peer-leading growth pipeline
Evaluating further throughput expansion potential to ~14,000 tonnes per day
DRAWBELLS

• 78 completed to date
• 85 to be completed by year-end
• 14 million tonnes, or approximately
three years, of broken reserves
accessible
CRUSHER

• 20,000 tonne per day design capacity
• Daily maximum of 18,581 tonnes in
August 2013
CONVEYOR

• 14,500 tonne per day design capacity

• During third quarter, 52 days over
14,000 tonnes per day conveyed

10
Peer-leading growth pipeline
Evaluating further throughput expansion potential to ~14,000 tonnes per day
• During third quarter, ran operation at 14,000
to 15,500 tonnes per day over five day period

• Mill was able to process higher throughput,
however a commensurate decrease in
recovery was seen
• Currently evaluating low capital cost
alternatives to process at higher rate and
bring recoveries into the high 80’s/low 90’s
• Potential to include:
• Addition of a tower mill for tertiary
grinding
• Additional rougher flotation capacity at
front end of the flotation circuit
• Additional cleaner capacity
11
Peer-leading growth pipeline
New Afton C-Zone exploration program

Looking Northwest

• Actively exploring for both near and
medium-term resource growth
• East Cave Extension represents
lateral extension of B-Zone currently
being mined
• Added two years to mine life
through 2012 exploration efforts

B Zone
Reserve

• C-Zone represents down plunge
extension of ore body
• All 2013 exploration to be
incorporated into year-end mineral
reserve and resource update

East Cave Extension
and Hanging Wall Lens

C Zone

C-ZONE RESOURCE SUMMARY(1)
Measured and Indicated

GOLD
COPPER

Inferred

0.3 Moz at 0.77 g/t

0.4 Moz at 0.62 g/t

211 Mlbs at 0.77%

301 Mlbs at 0.68%

12
Peer-leading growth pipeline
Three organic
projects

Industry leading organic growth profile

+800 Koz (1)
El Morro

• Growth projects expected to increase gold
production by ~1.75 times over current
operations
• Blackwater and Rainy River acquisitions
increased shares outstanding by 25% for
potential +150% increase in production

Four current
operations

Blackwater(2)

• Projecting below current industry
average cash costs at each project
Rainy River

2013 Gold
Production

Annual Production
Potential of Growth Assets

13
Peer-leading growth pipeline
Three world-class projects
Rainy River

Blackwater

El Morro (30% )

Significant Gold M&I
Resource Base(1)(2)

6.2 Moz

8.6 Moz

2.9 Moz

Exploration
Potential

Intrepid Zone/Multiple
Regional Targets

Capoose/Multiple
Regional Targets

El Morro Zone/
Block Cave Potential

Jurisdiction

Ontario, Canada

British Columbia, Canada

Chile

Robust Production/
Low Cash Costs(3)

~225 Koz at below
average cash costs

~500 Koz at below
average cash costs

~90 Koz Au/85 Mlbs Cu at
~($700) cash costs(4)

RAINY RIVER

BLACKWATER

EL MORRO

14
Peer-leading growth pipeline
Control of two underexplored districts
• +169 km2 land package
• Multiple targets
including recently
discovered Intrepid Zone

RAINY RIVER
Existing resource
Exploration targets

Off Lake

Son of Intrepid
Western Zone

Rainy River

Intrepid

Intrepid
Extension

15
Peer-leading growth pipeline
Control of two underexplored districts
• +1,000 km2 land
package
• Initial resource at
Capoose ~25 km from
main Blackwater
resource

BLACKWATER
Existing resource
Exploration targets

Capoose

• Multiple regional targets
Van Tine

Fawnie

Blackwater

Auro

10km

16
A history of value creation
Increasing Net Asset Value drives share price growth
Net Asset Value (1)

March 2009

December 2013

PRICE PERFORMANCE SINCE BUSINESS COMBINATION WITH
WESTERN GOLDFIELDS IN MARCH 2009 (5)

Mesquite, Cerro San Pedro, Peak Mines

~$875

165%

$1,027
New Afton

~$120

$1,542
El Morro (2)

~$40

35%

$400
Blackwater (3)

$–

$720

(29% )
(48% )

Rainy River(4)

$–

$485

(41% )

S&P/TSX Global
FTSE Gold
Gold Index (6)
Mines Index (7)

HUI
Index (8)

Gold Price

New Gold

17
A history of value creation
Near-term catalysts
2013 guidance – increased resources, production growth and lower costs
Blackwater resource update
New Afton C-Zone exploration update
Completion of Rainy River acquisition

New Afton mill to reach 12,000 tonnes per day
Resolution of El Morro temporary permit suspension
Completion of Blackwater Feasibility Study
Rainy River Feasibility Study Update
Blackwater/Rainy River/New Afton exploration/resource updates

New Afton throughput expansion update
18
New Gold investment thesis

Portfolio
of assets
in top-rated
jurisdictions

Invested
and
experienced
team

Among
lowest-cost
producers with
solid track
record

Peer-leading
growth
pipeline

Establishing the leading
intermediate gold company

Track record
of value
creation
Appendix

Appendices
Page
1.

Financial information

21

2.

Consolidated operating performance/Q3’13 summary

27

3.

New Afton

32

4.

Rainy River

38

5.

Blackwater

39

6.

El Morro

41

7.

Reserves and resource notes

47

8.

Commodity price/foreign exchange assumptions

54

20
Appendix 1

Capitalization and liquidity

•
•

Undrawn Credit
Facility(2)

Liquidity
Position

$429mm

Two senior unsecured note offerings
during 2012 ($300 million at 7.00%,
$500 million at 6.25%)

•

Total common shares outstanding of
503 million

•

Cash and
Equivalents (1)

All corporate debt due in 2020
or beyond(3)

Paid $66 million to eliminate legacy
gold hedges on May 15, 2013

$100mm

$529mm

1. Cash and equivalents as at Septem
ber 30, 2013.
2. $50 m
illion of total $150 m
illion currently used for Letters of Credit.
3. See Appendix 1 – Sum ary of debt for detailed breakdown of com
m
ponents of debt.

21
Appendix 1

Summary of debt

Undrawn Credit
Facility

Senior Unsecured Notes
(April 2012)

Senior Unsecured Notes
(November 2012)

El Morro Funding
Loan

Face Value

$150 million(1)

$300 million

$500 million

$76 million

Maturity

1 year with annual
extensions permitted

April 15, 2020

November 15, 2022

n/a

Interest Rate

See ‘Key features’

7.00%

6.25%

4.58%

Payable

Revolving credit

Semi-annually

Semi-annually

Upon start of
production

Conversion price

n/a

n/a

n/a

n/a

Current trading value

n/a

~104

~98

n/a

Key features

•

•
•

•
•

•

•

•

1. $50 m
illion currently allocated for Letters of Credit.

Normal financial
covenants Interest
Rate
3.00-4.25% over
LIBOR based on
ratios
Standby fee of 0.751.06%

•

Senior unsecured
Redeemable after April 15,
2016 at 103.5% down to
100% of face after 2018
Unlimited dividends if
leverage ratio below 2:1

•

Senior unsecured
Redeemable after
November 15, 2017 at par
plus half coupon, declining
ratably to par
Unlimited dividends if
leverage ratio below 2:1

New Gold to
repay Goldcorp
out of 80% of its
30% share of
cash flow once
El Morro starts
production

22
Appendix 1

2012 and 2013 capital expenditures by site
•

New Gold’s 2013 estimated capital expenditures are $315 million

•
•
•

Capital includes costs related to ongoing annual sustaining capital as well as investments for
future production
Capital estimate includes recently acquired Rainy River project

Capital estimates by site are shown below:
TOTAL 2012 ACTUAL CAPITAL EXPENDITURES:
$499 MILLION
Cerro San Pedro
$11mm

TOTAL 2013 CAPITAL EXPENDITURE ESTIMATE:
$315 MILLION

Mesquite
$11mm
Mesquite
$20mm

Peak Mines
$47mm

Rainy River
$25mm

Cerro San Pedro
$40mm

Blackwater
$128mm
New Afton
$302mm

New Afton
$110mm

Peak Mines
$60mm
Blackwater
$60mm

23
Appendix 1

2013 capital expenditures by category
•

The below breaks down capital expenditures at each site into two categories – annual sustaining
capital and direct investments for future production growth and mine life extension

New Afton - $110 million

•

18%

•
82%

$90 million – continued cave and drawbell development as well as
related technical services
Total of ~90 drawbells expected to be completed by end of 2013
• Annual drawbell development to decrease over mine life with
commensurate decrease in capital

Blackwater - $60 million

•
•

$15 million – capitalized exploration
$45 million – Feasibility and related engineering studies, permitting,
camp facilities/operation

•
•

100%

$30 million – underground development and capitalized exploration
$30 million – equipment, mine and mill projects/maintenance

Peak Mines - $60 million

50%

50%

Direct investment for future production

Annual sustaining capital

24
Appendix 1

2013 capital expenditures by category
Cerro San Pedro - $40 million

•
•

$30 million – final leach pad expansion and capitalized stripping for
phase 5 development
$10 million – site maintenance/processing improvements

•
•

$20 million – engineering, studies, environmental and other
$5 million – ongoing exploration

•

$12 million – two additional trucks and construction of new welding and
tire shops
$8 million – equipment components/site maintenance

25%

75%

Rainy River - $25 million
100%

Mesquite - $20 million

40%

•
60%

Direct investment for future production

Annual sustaining capital

New Gold’s 30% share of estimated 2013 El Morro capital cost of $10
million fully carried by Goldcorp Inc.
25
Appendix 1

2013 exploration program overview
•

New Gold’s estimated exploration budget for 2013 is $50 million
•
•

•

Capitalized: $20 million
Expensed: $30 million

Additional $5 million of exploration at Rainy River post acquisition

Capitalized: $5 million

Capitalized: $15 million

Expensed: $5 million

Expensed: $15 million

Peak Mines
33,000 metres

Blackwater
40,000 metres

New Afton
40,000 metres

Expensed: $10 million

26
Appendix 2

2013 third quarter highlights

• Gold production – 94,038 ounces
• Total cash costs(1) – $280 per ounce sold
• All-in sustaining costs(2) – $779 per ounce
• New Afton achieved targeted increase in
throughput three months ahead of schedule
• Adjusted earnings per share (3) – $0.04/share

Lowest cost
quarter in
company’s history

• Adjusted net cash generated from
operations (4) – $54 million
• Completed Rainy River acquisition(5)
• Cash and cash equivalents of $429 million

1.
2.
3.
4.
5.

Refer to Endnote on total cash costs under the heading “Non-GAAP Measures”.
Refer to Endnote on all-in sustaining costs under the heading “Non-GAAP Measures”.
Refer to Endnote on adjusted net earnings under the heading “Non-GAAP Measures”.
Refer to Endnote on adjusted net cash generated from operations under the heading “Non-GAAP Measures”.
97.5% of Rainy River was acquired in Q3, with the rem
aining 2.5% acquired in Q4.

27
Appendix 2

2013 mine-by-mine operating results

2013 THIRD QUARTER
Gold sales
(000s ounces)

costs (1)

Cash
($/oz)

2013 YEAR-TO-DATE

All-in Sustaining
costs (2) ($/oz)

Gold sales
(000s ounces)

Cash costs (1)
($/oz)

All-in Sustaining
costs (2) ($/oz)

New Afton

25

($1,310)

($365)

62

($1,104)

($191)

Cerro San Pedro

24

$723

$771

81

$605

$674

Mesquite

21

$1,017

$1,098

72

$936

$1,162

Peak Mines

24

$856

$1,332

77

$874

$1,405

94

$280

$779

291

$399

$905

2013 THIRD QUARTER

2013 YEAR-TO-DATE

New Afton co-product cash costs(1)
Gold ($/oz)

$454

$526

Copper ($/lb)

$1.05

$1.24

1. Refer to Endnote on total cash costs under the heading “Non-GAAP Measures”.
2. Refer to Endnote on all-in sustaining costs under the heading “Non-GAAP Measures”.

28
Appendix 2

Consolidated financial summary

2013 THIRD QUARTER

2012 THIRD QUARTER

$196

$196

Earnings from mine operations ($ million)

$51

$77

Net earnings ($ million)

$12

$18

$0.02

$0.04

$20

$43

$0.04

$0.09

$54

$47

Revenue ($ million)

Net earnings per share ($/share)
Adjusted net earnings(1) ($ million)
Adjusted net earnings per share(1) ($/share)
Adjusted net cash generated from operations (2) ($ million)

1. Refer to Endnote on adjusted net earnings under the heading “Non-GAAP Measures”.
2. Refer to Endnote on adjusted net cash generated from operations under the heading “Non-GAAP Measures”.

29
Appendix 2

2013 estimated all-in sustaining costs

Total cash costs (1)

~$375/oz

General and administrative

~$70/oz

Exploration expense

~$80/oz

Sustaining capital(2)

~$375/oz

ALL-IN SUSTAINING COSTS(3)

1. Refer to Endnote on total cash costs under the heading “Non-GAAP Measures”.
2. Sustaining capital based on New Gold’s total 2013 estim
ated capital expenditures excluding expenditures related to growth-related initiatives.
3. Refer to Endnote on all-in sustaining costs under the heading “Non-GAAP Measures”.

~$900/oz

30
Appendix 2

Lower costs driving margin expansion
New Gold offers shareholders potential for over $400 per ounce(1) of incremental margin

$782(4)

$800
$738

Total Cash Costs (US$/oz)(2)

$643
$600

$557

$478

Incremental Margin to New Gold
Shareholders

$465
$446

$400

$421

$418

$375

$200
2009

1.
2.
3.
4.

2010

2011

Calculated based on H1’2013 GFMS industry average cash costs less New Gold 2013 cash cost guidance. Assum no change to industry average cash costs for rem
es
ainder of 2013.
Refer to Endnote on total cash costs under the heading “Non-GAAP Measures”.
Industry data per GFMS reports calculated net of by-product credits as at various year-ends
Industry data per GFMS reports calculated net of by-product credits at H1’2013.

2012

2013E

31
Appendix 3

Drawbell continuity schedule
Copper resource grades

Accelerated East
Cave development
completed June
2013

East Cave
production began
June 2013

65 drawbells
in production
In West Cave

Planned Draw bells in 2013

Planned Future Drawbells

32
Appendix 3

Mill schematic

Final Concentrate

To Tailings

Surface Stockpile

Potential New Facilities

33
Appendix 3

East Cave Extension and Hanging Wall Lens overview

Reserves Replacement
• East Cave Extension delineation and infill drilling to extend Main Zone reserve
laterally to east
• Hanging Wall Lens drilling to test potential to develop additional resources in
hanging wall to Main Zone
East Cave Extension

Hanging Wall Lens

Holes

Metres

Holes

Metres

2013 program

34

8,253

24

9,522

2012 program

8

3,177

-

-

Total to date

42

11,430

24

9,522

34
Appendix 3

Drill program highlights
HIGHLIGHTS FROM EAST CAVE DRILL PROGRAM
Drill
Hole

From
(m)

To
(m)

Interval
(m)

Gold
(g/t)

Copper
(%)

AF13-198

19

58

39

0.17

0.38

AF13-207

41

110

69

0.50

0.69

AF13-210

44

180

136

0.25

0.66

AF13-212

46

190

144

0.18

0.75

AF13-215

236

406

170

0.67

1.47

AF13-227

216

322

106

0.21

0.59

HIGHLIGHTS FROM HANGING WALL LENS DRILL PROGRAM
Drill
Hole

From
(m)

To
(m)

Interval
(m)

Gold
(g/t)

Copper
(%)

EA13-040

138

224

86

0.33

0.78

EA13-041

226

256

30

1.69

1.22

EA13-049

256

278

22

1.68

1.08

EA13-055

294

336

42

0.49

0.62

EA13-062

252

352

100

0.80

0.43

EA13-068

366

418

52

2.04

1.43

EA13-079B

294

462

168

1.21

0.70

3

70

67

0.54

0.15

EA13-084

1. Refer to news release dated October 21, 2013 “New Gold Achieves Targeted Throughput Increase at New Afton Ahead of Schedule” as filed on SEDAR for all assay results as well as other disclosure relating to these results.

35
Appendix 3

C-Zone overview

Resource Expansion
• C-Zone delineation and infill drilling to expand and upgrade resource to support
future engineering design studies
Holes

Metres

2013 program

41

26,800

2012 program

26

13,900

Total to date

67

40,700

• Exploring potential to expand C-Zone to west and down plunge
C-ZONE RESOURCE SUMMARY(1)

Measured and Indicated

Inferred

GOLD

0.3 Moz at 0.77 g/t

0.4 Moz at 0.62 g/t

COPPER

211 Mlbs at 0.77%

301 Mlbs at 0.68%

Note: Includes all 2012 drilling plus five holes completed in early 2013

1. Refer to appendix 7 for detailed breakdown of resources and other inform
ation related to resource estim
ates.

36
Appendix 3

C-Zone highlights
2013 C-ZONE DRILLING HIGHLIGHTS
From
(m)

To
(m)

Interval
(m)

Gold
(g/t)

Copper
(%)

EA13-031

644

708

64

0.86

1.33

EA13-032

478

622

144

0.92

1.10

EA13-034

744

810

66

0.90

0.93

EA13-036

592

678

86

1.51

1.66

EA13-037

566

652

86

0.66

1.38

EA13-045

526

588

62

0.85

1.13

EA13-046

722

792

70

1.13

1.06

EA13-054

504

628

124

1.08

1.52

EA13-056

740

820

80

0.70

0.48

EA13-076

372

416

44

0.54

0.96

EA13-088

514

596

82

1.95

2.57

Drill Hole

• 2013 drilling program
has tripled the amount
of drill hole data
defining the C-Zone
resource
• Drill program has both
extended limits and
improved classification
confidence in C-Zone
resource

1. Refer to news release dated October 21, 2013 “New Gold Achieves Targeted Throughput Increase at New Afton Ahead of Schedule” as filed on SEDAR for all assay results as well as other disclosure relating to these results.

37
Appendix 4

Rainy River – Location

•

Mining friendly Northwestern Ontario

•

65 km northwest of Fort Frances

•

80 km south of Kenora

•

Within 25 km of rail and power

•

Local skilled labour force

Kenora

Rainy River Gold Project
Fort Frances
HWY 600

Thunder Bay

Site Topography

38
Appendix 5

Blackwater – A robust project

Measured and Indicated
Gold Resources (1) –
Direct Processing Material

8.6 Moz
•

Additional Measured and Indicated
gold resources – stockpile material of
0.9 million ounces

•

Central British Columbia near
infrastructure
•

Year-round accessibility for drilling/
development

•

Total 2012 drilling over 270,000 metres
project wide

•

Tax synergies with New Afton

•

PEA completed September 2012

•

Targeting annual gold production of
~500,000 ounces

•
•

1. Refer to Appendix 7 for detailed disclosure on Resource calculations and other inform
ation related to resource estim
ates.
2. Blackwater’s potential is not supported by a feasibility study. See Endnote “Blackwater PEA – Additional Cautionary Note”.

Targeting completion of Feasibility
Study by late 2013
Consolidated significant land position –
1,000 km2

39
Appendix 5

Blackwater – Project overview

•

Conventional truck and shovel open pit mine with 60,000 tonnes per day
processing plant

•

Low grade stockpiling strategy

•

Simple, conventional flowsheet using whole ore leach process

•

Conventional waste rock and Tailings Storage Facility

•

Power supply from the hydroelectric power grid, via 133 kilometre transmission line

•

Minimal off-site infrastructure required
•

•

Good existing access road; water supply within 15 kilometres

Low environmental risk and facility designed for closure

1. Source: Septem
ber 2012 Prelim
inary Econom Assessm
ic
ent.

40
Appendix 6

El Morro (30%)

2.9 Moz
Gold Reserve(1)
2.1 Blbs
Copper Reserve(1)
•

Goldcorp – 70% partner and project operator
• New Gold’s 30% share of capital fully
funded by Goldcorp

Location

Chile

Mine type

Open Pit

Reserves (1) – Gold/Copper (Moz/Mlbs)

2.9/2,097

Resources (1) – Gold/Copper (Moz/Mlbs)

2.9/2,097

Estimate mine life

17 years

LOM production/yr (Au Koz/Cu Mlbs)

90/85

LOM cash costs/oz by-product(2)

($700)

•

Current resource entirely within La Fortuna
deposit

• Neighbouring El Morro deposit
underexplored
•

2012 year end update added 0.4 million
ounces of gold and 229 million pounds of
copper to reserves (1)

•

Evaluating various alternatives for a power
source to northern Chilean development
projects

1. New Gold’s attributable 30% share. Refer to Appendix 7 for detailed disclosure on reserve and resource calculations.
2. Refer to Endnote on total cash cost under the heading “Non-GAAP Measures”. Life of m
ine co-product costs estim
ated at $550/oz gold and $1.45/lb copper at com odity price assum
m
ptions of $1,200/oz gold and $2.75/lb copper.

41
Appendix 6

El Morro overview of updated Feasibility Study

•

El Morro Feasibility Study was updated in December 2011

•

Key parameters for New Gold include:
•

30% share of estimated development capital, or $1.2 billion, carried by Goldcorp
–

Receive cash flow from start of production

–

Interest rate fixed at 4.58%

•

Base 17-year mine life

•

30% share of annual production: ~90,000 ounces of gold and ~85 million pounds
of copper

•

Estimated total cash costs (1), net of by-products ($700) per ounce

–

Co-product gold ~$550 per ounce

–

Co-product copper ~$1.45 per pound

1. Refer to Endnote on total cash costs under the heading “Non-GAAP Measures” .

42
Appendix 6

La Fortuna deposit
2012 open pit Proven and
Probable reserves and Measured
and Indicated resources

Underground Inferred
resource with block
cave potential

500 m etres

43
Appendix 6

El Morro (30%) – Funding structure(1)

Total Capital
100%
~ $3.9 billion
30%

100% Average
annual
cash flow
70%

Funded by
$1.2 billion
interest at 4.58%

~ $2.7 billion

30%

20%

70%

80%

Carried funding repayment

• New Gold’s 30% share of development capital 100% carried
• Interest fixed at 4.58%

1. Capital estim
ates based on Decem
ber 2011 Feasibility Study.

44
Appendix 6

Selected porphyry gold/copper deposits/mines (1)
Au Grade
(g/t)
0.80

New Afton
0.70

0.60

El Morro
0.50

0.40

0.30

0.20

0.10

-0.20%

0.40%

0.60%

0.80%

Producing

1.20%

(2)

Cu Grade
(%)

Development
Alumbrera

Chapada

Cadia-Ridgew ay

1.00%

New Prosperity

Mt. Milligan

El Morro

New Afton

Cobre Panama

Cerro Casale

Agua Rica

1. Based on disclosure by respective com
panies.
2. Includes “Cadia East Underground” and “Ridgeway Underground” reserves as indicated in Newcrest’s February 8, 2013 press release; does not inc lude “Other” Cadia province reserves.

45
Appendix 6

El Morro relative positioning(1)

EL MORRO WITHIN GOLDCORP PORTFOLIO

Asset

Gold Reserves (Moz)

Asset

Gold Equivalent(2) (Moz)

Penasquito

15.7

Penasquito

43.9

Pueblo Viejo

10.0

El Morro

17.4

Los Filos

7.4

Pueblo Viejo

11.7

El Morro

6.7

Los Filos

8.4

Cerro Negro

5.7

Cerro Negro

6.7

1. All reserve inform
ation taken from Goldcorp’s Decem
ber 31, 2012 year-end resource statem
ents.
2. Gold equivalent calculated based on the following com odity prices: Gold - $1,600/oz; Silver - $30.00/oz; Copper - $3.50/lb; Lead - $0.90/lb; Zinc - $0.90/lb.
m

46
Appendix 7

Reserves and resources summary

Mineral Reserves and Resources Summary
Year End 2012
Gold
Koz

Proven and Probable Reserves
Measured and Indicated Resources (inclusive of Reserves)
Inferred Resources
M&I Resources (inclusive of Reserves)
Mesquite
Cerro San Pedro
Peak Mines
New Afton
Blackwater
Capoose
Rainy River
El Morro
Total M&I

11,783
29,242
6,822
5,684
1,703
880
2,224
9,497
196
6,167
2,891
29,242

(1)(2)

Silver
Koz

Year End 2011
Copper
Mlbs

Gold
Koz

41,571
159,585
88,359

3,282
4,223
1,187

7,863
18,797
6,323

-

146
1,980
2,097
4,223

5,534
1,812
948
1,742
5,423
384
n/a
2,954
18,797

57,980
1,350
7,292
70,128
9,497
13,338
159,585

Silver
Koz

(3)

Copper
Mlbs

34,347
115,268
76,856

2,888
3,946
2,202

-

167
1,586
n/a
2,193
3,946

55,860
1,570
5,470
25,774
26,594
n/a
115,268

1. For additional inform
ation regarding reserve and resource estim
ates; refer to: New Gold’s “Annual Inform
ation Form for the Financial Year Ended Decem
ber 31, 2012” dated March 27, 2013; news release dated April 4, 2013 “New Gold Announces Increased
Gold Resources at Blackwater Project”; news release dated May 1, 2013 “New Gold Announces 2013 First Quarter Results – Increases Gold and Copper Resources at New Afton C-Zone by Over 300 Percent”; and news release dated July 31, 2013 “New
Gold Second Quarter Delivers Increased Production at Lower Costs - Second Half of 2013 Rem
ains on Track to Provide Strong Finish to the Year”.
2. Year end 2012 Mineral Resources updated for Blackwater resource updates on April 4, 2013 and New Afton C -Zone update on May 1, 2013.
47
3. Year end 2011 Mineral Resources presented at Investor Day on February 2, 2012.
Appendix 7

Reserves and resources summary (cont’d)
Mineral Reserves statement as at December 31, 2012(1)
Metal grade
Tonnes
000s

Mesquite
Proven
Probable
Mesquite P&P
Cerro San Pedro
Proven
Probable
CSP P&P
Peak Mines
Proven
Probable
Peak P&P
New Afton
Proven
Probable
New Afton P&P
Rainy River
Proven
Probable
Rainy River P&P
El Morro
Proven
Probable
El Morro P&P
Total Proven
Total Probable
Total P&P

13,140

Gold
g/t

Contained metal

Silver
g/t

Copper
%

Gold
Koz

-

-

2,055

127,549

0.68
0.56
0.57

21,100
26,400
47,500

0.52
0.48
0.50

17.1
17.4
17.3

2,109
2,118
4,227

5.89
3.82
4.85

52,500
52,500

Silver
Koz

2,342

-

-

-

353
407
760

11,600
14,800
26,400

-

7.5
6.8
7.2

1.08
1.18
1.13

399
260
659

510
466
976

50
55
105

0.65
0.65

2.3
2.3

0.93
0.93

1,100
1,100

3,880
3,880

1,080
1,080

27,700
88,600
116,300

1.14
1.06
1.08

1.94
3.01
2.76

-

1,015
3,017
4,031

1,728
8,587
10,315

-

307,949
335,152
643,101

0.57
0.37
0.47

-

0.56
0.44
0.49

1,705
1,186
2,891
3,759
8,025
11,783

114,409

287

Copper
Mlbs

100% Basis

1. Year end 2012 Mineral Resources updated for Blackwater Resource update on April 4, 2013 and New Afton C -Zone update on May 1, 2013.

30% Basis

13,838
27,733
41,571

1,135
962
2,097
1,185
2,097
3,282
48
Appendix 7

Reserves and resources summary (cont’d)
Measured and Indicated mineral Resource statement (inclusive of Reserves) as at December 31, 2012(1)
Metal grade
Tonnes
000s

Gold
g/t

Contained metal

Silver
g/t

Copper
%

Gold
Koz

Silver
Koz

Copper
Mlbs

Mesquite
Measured - oxide
Indicated - oxide
Meqsuite M&I - oxide
Measured - non oxide

19,100
274,100
293,200
4,900

0.51
0.38
0.39
0.88

-

-

313
3,349
3,662
139

-

-

Indicated - non oxide

96,000

0.61

-

-

1,883

-

-

Mesquite M&I - non oxide

100,900

0.62

-

-

2,022

-

-

Total Mesquite M&I
Cerro San Pedro
Measured - oxide
Indicated - oxide
CSP M&I - oxide
Measured - sulphide
Indicated - sulphide
CSP M&I - sulphide
Total CSP M&I
Peak Mines
Measured
Indicated
Peak M&I
New Afton
A&B Zones
Measured
Indicated
A&B Zone M&I
C-Zone
Measured
Indicated
C-Zone M&I
Total New Afton M&I

394,100

0.45

-

-

5,684

-

-

27,100
49,000
76,100
15,200
60,400
75,600
151,700

0.34
0.24
0.28
0.47
0.41
0.42
0.35

15.0
13.0
13.7
11.9
9.6
10.1
11.9

-

303
380
683
229
791
1,020
1,703

13,100
20,480
33,580
5,800
18,600
24,400
57,980

-

2,700
3,200
5,900

5.74
3.75
4.66

7.5
6.8
7.1

1.05
1.19
1.13

494
386
880

647
703
1,350

62
84
146

33,500
45,900
79,400

0.86
0.67
0.75

2.9
2.4
2.6

1.18
0.89
1.01

929
984
1,913

3,160
3,530
6,690

873
896
1,769

1,282
11,205
12,486
91,886

0.75
0.78
0.77
0.75

1.4
1.5
1.5
2.6

0.79
0.77
0.77
1.00

31
280
311
2,224

56
548
602
7,292

22
189
211
1,980

1. Year end 2012 Mineral Resources updated for Blackwater Resource update on April 4, 2013 and New Afton C-Zone update on May 1, 2013.

49
Appendix 7

Reserves and resources summary (cont’d)
Measured and Indicated mineral Resource statement (inclusive of Reserves) as at December 31, 2012
Metal grade

Tonnes
000s
Blackwater
Direct processing material
Measured
Indicated
M&I (direct processing)
Stockpile material
Measured
Indicated
M&I (stockpile)
Total Blackwater M&I
Capoose
Indicated

Gold
g/t

(1)

Contained metal

Silver
g/t

Copper
%

Gold
Koz

Silver
Koz

Copper
Mlbs

116,955
189,044
305,999

1.04
0.78
0.88

5.6
6.0
5.8

-

3,896
4,729
8,624

21,057
36,467
57,524

-

26,521
64,382
90,903
396,902

0.30
0.30
0.30
0.74

4.1
4.4
4.3
5.5

-

256
617
873
9,497

3,496
9,108
12,604
70,128

-

14,200

0.43

20.8

-

196

9,497

-

Measured

27,638

1.33

1.90

-

1,182

1,689

-

Indicated

130,885

1.18

2.8

-

4,985

11,649

-

Total Rainy River M&I

158,523

1.21

2.62

-

6,167

13,338

-

Rainy River

El Morro
Measured
Indicated
El Morro M&I
Total Measured
Total Indicated
Total M&I

100% Basis
307,949
335,152
643,101

0.57
0.37
0.47

1. Year end 2012 Mineral Resources updated for Blackwater Resource update on April 4, 2013 and New Afton C -Zone update on May 1, 2013.

30% Basis
-

0.56
0.44
0.49

1,705
1,186
2,891
9,477
19,766
29,242

49,005
110,582
159,585

1,135
962
2,097
2,092
2,131
4,223

50
Appendix 7

Reserves and resources summary (cont’d)

Inferred Resource statement as at December 31, 2012(1)
Metal grade
Tonnes
000s

Gold
g/t

Contained metal

Silver
g/t

Copper
%

Gold
Koz

Silver
Koz

Copper
Mlbs

Mesquite
Oxide

35,200

0.33

-

-

373

-

-

Non oxide

15,700

0.55

-

-

278

-

-

Mesquite Inferred

50,900

0.40

-

-

651

-

-

Oxides

53,400

0.17

9.0

-

300

15,400

-

Sulphides

50,500

0.34

8.5

-

550

13,800

-

103,900

0.25

8.8

-

850

29,200

-

1,700

2.64

4.8

1.13

144

261

42

A&B-Zone

14,900

0.45

2.0

0.65

216

940

212

C-Zone

20,221

0.62

1.4

0.68

401

923

301

New Afton Inferred

35,121

0.56

1.5

0.68

617

1,863

513

13,815

0.76

4.1

-

337

1,821

-

Cerro San Pedro

CSP Inferred

Peak Mines
New Afton

Blackwater

Direct processing
Stockpile

3,785

0.31

3.6

-

38

438

-

Blackwater Inferred

17,600

0.66

4.0

-

375

2,263

-

Capoose

64,070

0.29

23.2

-

595

47,789

-

Rainy River

93,804

0.76

2.32

-

2,280

6,983

-

100% Basis
El Morro

137,555

0.99

Total Inferred

1. Year end 2012 Mineral Resources updated for Blackwater Resource update on April 4, 2013 and New Afton C -Zone update on May 1, 2013.

30% Basis
-

0.70

1,310

-

632

6,822

88,359

1,187

51
Appendix 7

Reserves and resources notes
Mineral reserves are contained w ithin Measured and Indicated mineral resources. Measured and Indicated mineral resources that are not mineral reserves do not have demonstrated economic
viability as defined by a technical Feasibility Study. New Gold reports its Measured and Indicated mineral resources inclusiv e of its mineral reserves. Inferred mineral resources are not know n
w ith the same degree of certainty as Measured and Indicated resources, do not have demonstrated economic viability, and are exclusive of mineral reserves. Mineral reserves have been
estimated and reported in accordance with the Canadian Institute of Mining, Metallurgy and Petroleum (‘CIM’) definition standards and guidelines and Canadian National Instrument 43-101
(‘NI 43-101’).
1) Mineral Reserves for the company’s mineral properties have been calculated based on the follow ing metal prices and low er cut-off criteria:

Mineral Property

Gold
(US$/oz)

Silver
(US$/oz)

Copper
(US$/lb)

Low er Cut-off

Mesquite

$1,300

-

-

0.21 g/t Au – Oxide reserves
0.41 g/t Au – Non-oxide reserves

Cerro San Pedro

$1,300

$24.00

-

US$4.33 /t NSR

Peak Mines

$1,300

$24.00

$3.00

A$120 – 253/t NSR

New Afton

$1,300

-

$3.00

US$24/t NSR

El Morro

$1,350

-

$3.00

0.20% CuEq

Rainy River

$1,250

$25.00

-

0.30 g/t AuEq – Open Pit
3.5 g/t AuEq - Underground

52
Appendix 7

Reserves and resources notes (cont’d)
2) Mineral Resources for the company’s mineral properties have been calculated based on the follow ing metal prices and low er cut-off criteria:
Mineral Property

Gold
(US$/oz)

Silver
(US$/oz)

Copper
(US$/lb)

Low er Cut-off

Mesquite

$1,400

-

-

0.12 g/t Au – Oxide resources
0.24 g/t Au – Non-oxide resources

Cerro San Pedro

$1,400

$28.00

-

0.1g/t AuEq – Open pit oxide resources
0.4g/t AuEq – Open pit sulphide resources

Peak Mines

$1,400

$28.00

$3.25

A$97 - 137/t NSR

New Afton

$1,400

$28.00

$3.25

0.40% CuEq – All resources

El Morro

$1,500

-

$3.50

0.15% Cu – Open pit resources
0.20% Cu – Underground resources

Blackw ater

$1,400

$28.00

-

0.40 g/t AuEq

Capoose

$1,400

-

-

0.40 g/t AuEq

Rainy River

$1,100

$22.50

-

0.35 g/t AuEq – Open Pit
2.5 g/t AuEq – Underground

Mineral resources have been estimated and reported in accordance with CIM definition standards and guidelines and Canadian NI 43-101.
3) Mineral resources are classif ied as Measured, Indicated and Inf erred resources and are reported based on technical and economic parameters consistent with the methods most suitable f or their potential commercial
exploitation. Where dif f erent mining and/or processing methods might be applied to dif f erent portions of a mineral resource, the designators ‘open pit’ and ‘underground’ hav e been applied to indicate env isioned mining
method. Likewise the designators ‘oxide’, ‘non-oxide’ and ‘sulphide’ hav e been applied to indicate the ty pe of mineralization as it relates to appropriate mineral processing method and expect ed pay able metal recov eries.
Additional details regarding mineral resource estimation, classif ication and reporting parameters f or each of New Gold’s mineral properties are prov ided in the respectiv e NI 43-101 Technical Reports which are av ailable
on SEDAR.
4) Blackwater April 4, 2013 update:
1. Mineral resources are reported within a conceptual open pit shell based on metal prices of $1,400/oz gold and $28.00/oz silv er. The March 2013 mineral resource estimate utilizes av erage metallurgical recov eries of
88.0% gold and 64.0% silv er f or oxide mineralization, 85.0% gold and 58.0% silv er f or transitional oxide/sulf ide mineralization and 85.0% gold and 44.0% silv er f or sulf ide mineralization. The 2012 y ear-end mineral
resource estimate utilizes av erage metallurgical recov eries of 86% gold and 44.9% silv er f or all material ty pes.
2. Total contained metal is calculated based on Tonnes*Grade / 31.10348 grams per troy ounce.
3. Gold-equiv alent cut-of f grade estimates are based on $1,400/oz gold and $28.00/oz silv er and av erage metal recov eries as described in Note 1 abov e.
4. Direct processing material is def ined as mineralization abov e a 0.40 g/t AuEq cut-of f and likely to be mined and processed directly .
5. Stockpile material is def ined as mineralization between a 0.30 g/t AuEq and a 0.40 AuEq cut-of f that is suitable f or stockpiling and f uture processing based on av erage metallurgical recov eries as described in Note 1
abov e.
5) Qualif ied Person: The preparation of New Gold’s mineral reserv e and resource statements has been done by or under the superv ision of Qualif ied Persons as def ined under Canadian NI 43-101 and they were rev iewed
and approv ed by Mark Petersen, a Qualif ied Person under NI 43-101 and an of f icer of New Gold.

6) For additional inf ormation regarding reserv e and resource estimates, ref er to: New Gold’s “Annual Inf ormation Form f or the Financial Y ear Ended December 31, 2012” dated March 27, 2013; news release dated April 4,
2013 “New Gold Announces Increased Gold Resources at Blackwater Project”; news release dated May 1, 2013 “New Gold Announces 2013 First Quarter Results – Increases Gold and Copper Resources at New Af ton
C-Zone by Ov er 300 Percent”; and news release dated July 31, 2013 “New Gold Second Quarter Deliv ers Increased Production at Lower Costs - Second Half of 2013 Remains on Track to Prov ide Strong Finish
to the Y ear”.
53
Appendix 8

Commodity price/foreign exchange assumptions

Guidance assumptions(1)
2013
Gold price ($/oz)

~1,300

Silver price ($/oz)

~20.00

Copper price ($/oz)

~3.25

USD/AUD

1.00

USD/CAD

1.00

USD/MXN

13.00

Spot:
Spot
Gold price ($/oz)

1,225

Silver price ($/oz)

19.40

Copper price ($/oz)

3.20

USD/AUD

0.91

USD/CAD

0.94

USD/MXN

13.05

1. Based on year-to-date average realized prices through Septem
ber 30, 2013 and assum
ptions for the fourth quarter of 2013: Gold - $1,300 per ounce; Copper - $3.25 per pound; Silver - $20.00 per ounce; AUD/USD and CDN/USD parity.

54
Notes

Page 4
1. Rankings based on 25 countries evaluated in 2013 Behre Dolbear Report – 2013 Ranking of Countries for Mining Investment: “Where Not to Invest”.
Page 5
1. Measured and Indicated Resources inclusive of Reserves.
2. Refer to Endnotes under the heading “Cautionary note to U.S. readers concerning estimates of Measured, Indicated and Inferred Resources ” and “Technical Information”.
3. New Gold completed the acquisition of 100% of Rainy River on October 15, 2013.
4. Refer to Appendix 7 for detailed breakdow n of reserves and resources and information related to reserve and resource estimate
s.
Page 7
1. Refer to Endnote on all-in sustaining costs under the heading “Non-GAAP Measures”.
2. Based on comparison w ith costs published by issuers listed in notes 4 and 5. The manner in w hich costs are determined may va from one issuer to another.
ry
3. Refer to Endnote on total cash costs under the heading “Non-GAAP Measures”.
4. Mid-tier average includes: Alamos, Eldorado, Agnico Eagle, Aurico and IAMGOLD.
5. Senior average includes: Barrick, Goldcorp, Kinross and New mont.
Page 8
1. Gold sales expected to be in the same general range as production.
2. Refer to Endnote on total cash costs under the heading “Non-GAAP Measures”. Guidance for total cash costs and all-in sustaining costs incorporates realized prices and
foreign exchange rates to September 30, 2013 and assumes commodity price assumptions of: Gold - $1,300/oz; Copper - $3.25/lb; Silver - $20.00/oz for the balance of
2013.
3. Refer to Endnote on all-in sustaining costs under the heading “Non-GAAP Measures”.

Page 12
1. Refer to Appendix 7 for detailed disclosure on Reserve and Resource calculations and information related to reserve and resource estimates.
Page 13
1. Based on ~225Koz from Rainy River, ~500Koz from Blackw ater and ~90Koz from El Morro. Refer to slide 14 for more information.
2. Blackw ater’s potential is not supported by a feasibility study. See Endnote “Blackw ater PEA – Additional Cautionary Note”.

55
Notes continued

Page 14
1. Refer to Appendix 7 for detailed disclosure on Reserve and Resource calculations.
2. Refer to Endnotes under the heading “Cautionary note to U.S. readers concerning estimates of Measured, Indicated and InferredResources” and “Technical Information”.
Measured and Indicated Resources are inclusive of Reserves. At Blackw ater, the 8.6 million ounces of Resources referred to ab
ove excludes 0.9 million ounces of material
to be stockpiled w hich has been classified as Measured and Indicated Resource.
3. Refer to Endnote on total cash costs under the heading “Non-GAAP Measures”. Cash costs have been compared to industry data per GFMS
reports w hich calculated an average, net of by-product credits, cash cost of $738 per ounce for the YE’2012.
4. Blackw ater production and cash costs based on September 2012 PEA; Rainy River production and cash costs based on April 2013 F
easibility Study; and El Morro
production and cash costs based on updated December 2011 Feasibility Study.Blackw ater’s potential is not supported by a feasibility study. See Endnote “Blackw ater PEA
– Additional Cautionary Note”.
Page 17
Source: Broker Reports, Company Estimates and Announcements, Bloomberg; all amounts in USD.
1. New Gold’s average analyst consensus NAV.
2. New Gold’s average analyst consensus NAV for El Morro; includes $50 million cash payment received from Goldcorp as part of transaction consideration.
3. New Gold acquired Richfield and Silver Quest on June 1, 2011 and December 23, 2011, respectively.
4. New Gold completed the acquisition of 100% of Rainy River on October 15, 2013.
5. New Gold share price appreciation calculated using a base price of US$1.79 from the March 3, 2009 close.
6. S&P/TSX Global Gold Index includes 54 gold companies in various stages of development/production.
7. FTSE Gold Mines Index includes 26 gold producing companies.
8. HUI Index includes 15 of the major global gold producers.

56
Endnotes

CAUTIONARY NOTE TO U.S. READERS CONCERNING ESTIMATES OF MEASURED, INDICATED AND INFERRED RESOURCES
Information concerning the properties and operations of New Gold has been prepared in accordance with Canadian standards under applicable Canadian securities laws, and may not be
comparable to similar information for United States companies. The terms “Mineral Resource”, “Measured Mineral Resource”, “In dicated Mineral Resource” and “Inferred Mineral Resource”
used in this presentation are Canadian mining terms as defined in accordance with National Instrument 43 -101 (“NI 43-101”) under guidelines set out in the Canadian Institute of Mining,
Metallurgy and Petroleum (“CIM”) Standards on Mineral Resources and Mineral Reserves adopted by the CIM Council on November 2 7, 2010. While the terms “Mineral Resource”,
“Measured Mineral Resource”, “Indicated Mineral Resource” and “Inferred Mineral Resource” are recognized and required by Canadian securities regulations, they are not defined terms
under standards of the United States Securities and Exchange Commission. Under United States standards, mineralization may no t be classified as a “Reserve” unless the determination has
been made that the mineralization could be economically and legally produced or extracted at the time the Reserve calculation is made. As such, certain information contained in this
presentation concerning descriptions of mineralization and resources under Canadian standards is not comparable to similar in formation made public by United States companies subject to
the reporting and disclosure requirements of the United States Securities and Exchange Commission. An “Inferred Mineral Resou rce” has a great amount of uncertainty as to its existence
and as to its economic and legal feasibility. It cannot be assumed that all or any part of an “Inferred Mineral Resource” wil l ever be upgraded to a higher category. Under Canadian rules,
estimates of Inferred Mineral Resources may not form the basis of feasibility or pre -feasibility studies. Readers are cautioned not to assume that all or any part of Measured or Indicated
Resources will ever be converted into Mineral Reserves. Readers are also cautioned not to assume that all or any part of an “Inferred Mineral Resource” exists, or is economically or legally
mineable. In addition, the definitions of “Proven Mineral Reserves” and “Probable Mineral Reserves” under CIM standards diffe r in certain respects from the standards of the United States
Securities and Exchange Commission.
TECHNICAL INFORMATION
The scientific and technical information in this presentation has been reviewed and approved by Mark Petersen, a Qualified Person under National Instrument 43 -101 and officer of New Gold.
Mineral Reserves and Mineral Resources
The estimates of Mineral Reserves and Mineral Resources discussed in this presentation may be materially affected by environmenta l, permitting, legal, title, taxation, sociopolitical, marketing
and other relevant issues. In addition to our February 5, 2013, April 4, 2013 and July 31, 2013 presentations, further details regarding Mineral Reserve and Resource estimates, including
classifications, key assumptions and parameters used in such estimates and other related information for each of New Gold's mineral properties are provided in the respective NI 43-101
Technical Reports, which are available at www.sedar.com .
Blackwater PEA – Additional Cautionary Note
This note regarding the preliminary economic assessment (“PEA”) is in addition to cautionary language already included in this presentation as required under NI 43-101. The Blackwater PEA
is preliminary in nature and includes Inferred Mineral Resources that are considered too speculative geologically to have the economic considerations applied to them that would enable them
to be categorized as mineral reserves, and there is no certainty that the PEA based on these mineral resources will be realiz ed. Mineral resources that are not mineral reserves do not have
demonstrated economic viability. This presentation includes information on New Gold’s PEA with respect to the Blackwater Project, which was outlined in the PEA Technical Report filed on
October 10, 2012. As disclosed in the presentation, New Gold has, since the date of the PEA, completed several non-material updates of the mineral resource estimate for the Blackwater
Project. Although the PEA represents useful, accurate and reliable information based on the information available at the time of its publication, and provides an important indicator as to the
economic potential of the Blackwater Project, the PEA is based on mineral resources estimates with an effective date of July 27, 2012, which do not reflect drilli ng conducted since their
effective date, and the PEA does not reflect the latest mineral resource estimate discussed in subsequent presentation. Certa in assumptions used in the PEA, some of which relate to the July
27, 2012 mineral resource estimate, may have changed from those used for the new resource estimate, causing a variation of parameters. Moreover, the updated mineral resource estimate
may impact how New Gold intends to develop the deposit, including pit outlines, production rates and mine life.

57
Endnotes continued

NON-GAAP MEASURES
TOTAL CASH COSTS
“Total cash costs” per ounce figures are non-GAAP measures which are calculated in accordance with a standard developed by The G old Institute, which was a worldwide association of
suppliers of gold and gold products and included leading North American gold producers. The Gold Institute ceased operations in 2002, but the standard is widely accepted as the standard of
reporting cash costs of production in North America. Adoption of the standard is voluntary and the cost measures presented ma y not be comparable to other similarly titled measures of other
companies. New Gold reports total cash costs on a sales basis. Total cash costs include mine site operating costs such as min ing, processing, administration, royalties and production taxes,
but are exclusive of amortization, reclamation, capital and exploration costs. Total cash costs are reduced by any by -product revenue and is then divided by ounces sold to arrive at the total
by-product cash cost of sales. The measure, along with sales, is considered to be a key indicator of a company’s ability to gene rate operating earnings and cash flow from its mining
operations. This data is furnished to provide additional information and is a non -IFRS measure. Total cash costs presented do not have a standardized meaning under IFRS and may not be
comparable to similar measures presented by other mining companies. It should not be considered in isolation as a substitute for measures of performance prepared in accordance with IFRS
and is not necessarily indicative of operating costs presented under IFRS. Further details regarding this measure and a reconciliation to the nearest IFRS measure is provided in the MD&A
accompanying the quarterly financial statements.
ALL-IN SUSTAINING COSTS
Consistent with the guidance announced earlier in 2013 from the World Gold Council, an association of various gold mining com panies from around the world of which New Gold is a member,
New Gold defines “all-in sustaining costs” as the sum of total cash costs, sustaining capital expenditures, corporate general & administrative costs, capitalized and expensed exploration that
is sustaining in nature and environmental reclamation costs. New Gold believes this non -GAAP measure provides further transparency into costs associated with producing gold and will
assist analysts, investors and other stakeholders of the company in assessing its operating performance, its ability to generate free cash flow from current operations and its overall value. Allin sustaining costs constitute a non-GAAP measure and are intended to provide additional information only and do not have any st andardized meaning under IFRS. They should not be
considered in isolation or as a substitute for measures of performance prepared in accordance with IFRS. Other companies may calculate these measures differently. Further details
regarding this measure and a reconciliation to the nearest IFRS measure is provided in the MD&A accompanying the quarterly financial statements.
ADJUSTED NET EARNINGS
“Adjusted net earnings” and “adjusted net earnings per share” are non -GAAP financial measures. Net earnings have been adjusted a nd tax affected for the group of costs in “Other gains and
losses” on the condensed consolidated income statement. The adjusted entries are also impacted for tax to the extent that the underlying entries are impacted for tax in the unadjusted net
earnings from continuing operations. The company uses this measure for its own internal purposes and believes the presentation of adjusted net earnings enables investors and analysts to
better understand the underlying operating performance of our core mining business through the eyes of management. Management periodically evaluates the components of adjusted net
earnings based on an internal assessment of performance measures that are useful for evaluating the operating performance of our business and a review of the non-GAAP measures used
by mining industry analysts and other mining companies. Adjusted net earnings and adjusted net earnings per share are intended to provide additional information only and do not have any
standardized meaning under IFRS. They should not be considered in isolation or as a substitute for measures of performance prepared in accordance with IFRS. The measures are not
necessarily indicative of operating profit or cash flow from operations as determined under IFRS. Other companies may calcula te these measures differently. Further details regarding this
measure and a reconciliation to the nearest IFRS measure is provided in the MD&A accompanying the quarterly financial statements.
ADJUSTED NET CASH GENERATED FROM OPERATIONS
“Adjusted net cash generated from operations” is a non-GAAP financial measure. Net cash generated from operations has been adjusted for one-time expenses related to the company’s
acquisition of Rainy River in the third quarter and a one -time charge incurred in the second quarter related to the settlement o f the company’s legacy gold hedge position. The company
believes the presentation of adjusted net cash generated from operations enables investors and analysts to better understand the underlying operating performance of our core mining
business. Adjusted net cash generated from operations is intended to provide additional information only and does not have any standardized meaning under IFRS. It should not be
considered in isolation or as a substitute for measures of performance prepared in accordance with IFRS. Further details regarding this measure and a reconciliation to the nearest IFRS
measure is provided in the MD&A accompanying the quarterly financial statements.

58
Contact information

Investor Relations
Hannes Portmann
Vice President, Corporate Development
416-324-6014
hannes.portmann@newgold.com

59

Corporate Presentation - December 2013

  • 1.
  • 2.
    Cautionary statements All monetaryamounts in U.S. dollars unless otherw ise stated Total cash costs shown net of by-product sales unless otherwise stated CAUTIONARY NOTE REGARDING FORWARD-LOOKING STATEMENTS Certain information contained in this presentation, including any information relating to New Gold’s future financial or operating performance as well as information respecting Rainy River and its assets may be deemed “forward looking”. All statements in this presentation, other than statements of historical fact, that address events or developments that New Gold expects to occur are “forward-looking statements”. Forward-looking statements are statements that are not historical facts and are generally, but not always, identified by the use of forward-looking terminology such as “plans”, “expects”, “is expected”, “budget”, “scheduled”, “estimates”, “forecasts”, “intends”, “anticipates”, “projec ts”, “potential”, “believes” or variations of such words and phrases or statements that certain actions, events or results “may”, “could”, “would”, “should”, “might” or “will be taken”, “occur” or “be achieved” or the negative connotation. Forward-looking statements in this presentation include, among others, statements with respect to: guidance for production, cash costs and all -in sustaining costs (and its components); the potential difference between gold price and cash and all -in sustaining costs, including relative to other companies; potential modifications to operations (and the cost of any such modifications) and potential opportunities to increase throughput at New Afton exploration potential and the results of future exploration activities; expected future mining activities; the expected or potential annual production, expected cash costs and expected development cost of New Gold’s projects; the estimation of mineral reserves and resources and the realization of such estimates; the expected life of New Gold’s mines and projects; the timing of completion of feasibility studies or updates, reserve updates and other technical work or reports; the adequacy of capital resources; and expected capital expenditures and exploration expenditures. All forward-looking statements in this presentation are based on the opinions and estimates of management as of the date such statements are made and are subject to important ri sk factors and uncertainties, many of which are beyond New Gold’s ability to control or predict. Material assumptions regarding our forw ard looking statements are discussed in this presentation, the annual MD&A, the AIF and our Technical Reports. Forward-looking statements are necessarily based on estimates and assumptions that are inherently subject to known and unknown risks, uncertainties and other factors that may cause actual results, level of activity, performance or achievements to be materiall y different from those expressed or implied by such forward-looking statements. Such factors include, without limitation: significant capital requirements; price volatility in the spot and forward markets for commodities; fluctuations in the international currency markets and in the rates of exchange of the currencies of Canada, the United States, Australia, Mexico and Chile; discrepancies between actual and estimated production, between actual and estimated reserves and resources and between actual and estimated metallurgical recoveries; changes in national and local gov ernment legislation in Canada, the United States, Australia, Mexico and Chile or any other country in which New Gold currently or may in the future carry on business; taxation; controls, regulations and political or economic developments in the countries in which New Gold does or may carry on business; the speculative nature of mineral exploration and development, inc luding the risks of obtaining and maintaining the validity and enforceability of the necessary licenses and permits and complying with the permitting requirements of each jurisdiction in which New Gold operates, including, but not limited to: in Canada, obtaining the necessary permits for Blackwater and the Rainy River Gold Project; in Mexico, where Cerro San Pedro has a history of ongoing legal challenges related to our environmental authorization (EIS); and in Chile, where the courts had temporarily suspended the approval of the environmental permit for El Morro; the lack of certainty with respect to foreig n legal systems, which may not be immune from the influence of political pressure, corruption or other factors that are inconsistent with the rule of law; the uncertainties inherent to current and future legal challenges New Gold is or may become a party to; diminishing quantities or grades of reserves and resources; competition; loss of key employees; additional funding requirements; rising costs of labour, supplies, fuel and equipment; actual results of current exploration or reclamation activities; uncertainties inherent to mining economic studies including the PEA for Blackwater and the Feasibility Study for the Rainy River Gold Project; changes in project parameters as plans continue to be refined; accidents; labour disputes; defective title to mineral claims or property or contests over claims to mineral properties; uncertainties with respect to the successful integration of the business of Rainy River within the business of New Gold; unexpected delays and costs inherent to consulting and accommodating rights of First Nations; and uncertainties with respect to obtaining all necessary surface rights for the Rainy River Project. In addition, there are risks and hazards associated with the business of mineral exploration, development and mining, including environmental events and h azards, industrial accidents, unusual or unexpected formations , pressures, cave-ins, flooding and gold bullion losses (and the risk of inadequate insurance or inability to obtain insurance to cover these risks) as well as “Risk Factors” included in New Gold’s (and, in respect to information related to the Rainy River Gold Project, in Rainy River’s) disclosure documents filed on and available at www.sedar.com. Forward-looking statements are not guarantees of future performance, and actual results and future events could materially differ from those anticipated in such statements. All of the forward-looking statements contained in this presentation are qualified by these cautionary statements. New Gold expressly disclaims any intention or obligation to update or revise an y forward-looking statements whether as a result of new information, events or otherwise, except in accordance with applicable securities laws. All endnotes can be found at the conclusion of the presentation and should be reviewed. 2
  • 3.
    New Gold investmentthesis Portfolio of assets in top-rated jurisdictions Invested and experienced team Among lowest-cost producers with solid track record Peer-leading growth pipeline A history of value creation 3
  • 4.
    Portfolio of assetsin top-rated jurisdictions Mining investment – country rankings (1) Blackwater Mine Life: 15+ years New Afton Mine Life: 14 years Rainy River #2 Mine Life: 15+ years Mesquite Mine Life: 10+ years Cerro San Pedro Mine Life: 4+ years El Morro Mine Life: 17 years Peak Mines Mine Life: 8 years CANADA #6 UNITED STATES #5 MEXICO #3 CHILE #1 AUSTRALIA OPERATING DEVELOPMENT (1) Rankings based on 25 countries evaluated in 2013 Behre Dolbear Report – 2013 Ranking of Countries for Mining Investm ent: “Where Not to Invest”. 4
  • 5.
    Portfolio of assetsin top-rated jurisdictions Growing gold resource base in Canada GOLD RESERVES (Moz)(4) GOLD M&I RESOURCES (Moz)(1)(4) 11.8 New Gold 0.9 Australia 1.7 Mexico 7.8 = +44% per share New Gold & Rainy River(3) 2.9 Chile 5.7 USA GOLD M&I RESOURCES (Moz)(1)(2)(4) 29.2 23.1 = +20% per share 18.0 Canada New Gold New Gold & Rainy River(3) • 18 million ounces of M&I resources in Canada • 84% increase in M&I resources per share since 2009 (1) Measured and Indicated Resources inclusive of Reserves. Canada = +62% 5
  • 6.
    Invested and experiencedteam Significantly invested team EXECUTIVE MANAGEMENT TEAM BOARD OF DIRECTORS Randall Oliphant Executive Chairman David Emerson Former Canadian Cabinet Minister Robert Gallagher President & CEO James Estey Former Chairman, UBS Securities Canada Brian Penny Executive VP & CFO Robert Gallagher President & CEO Vahan Kololian Founder, Terra Nova Partners Martyn Konig Former Executive Chairman, European Goldfields Pierre Lassonde Chairman, Franco-Nevada Randall Oliphant Executive Chairman Raymond Threlkeld Mining Consultant Ernie Mast VP Operations Collectively ~$70 million invested in New Gold 6
  • 7.
    Among lowest-cost producerswith solid track record Lower costs driving margin expansion • $150 - $200 per ounce lower all-in sustaining costs(1) results in incremental margin(2) • ~$100 per ounce decrease in cash costs(3) from 2009 to 2013E 2013 GUIDANCE – ALL-IN SUSTAINING COSTS ($/OZ)(1) ~$1,100 ~$1,050 ~$900 • Copper and silver create effective hedge New Gold Mid-Tier Average(4) Senior Average(5) 7
  • 8.
    Among lowest-cost producerswith solid track record 2013 outlook Gold production(1) Copper production Silver production 390-400 Koz 78-88 Mlbs ~1.3 Moz 2013 Total cash costs(2) ~$375/oz Assum ptions for the fourth quarter of 2013: Gold - $1,300 per ounce; Copper - $3.25 per pound; Silver - $20.00 per ounce; AUD/USD and CDN/USD parity. 2013 All-in sustaining costs(2)(3) ~$900/oz 8
  • 9.
    Among lowest-cost producerswith solid track record New Afton hitting its stride • Evaluating potential for further throughput increases in 2014 and beyond COPPER GRADE (g/t) • Achieved targeted throughput increase to 12,000 tonnes per day three months ahead of schedule GOLD GRADE (%) 0.96% 0.78 0.67 Q1 2013 0.82 Q2 2013 Q3 2013 Q1 2013 0.98% Q2 2013 Q3 2013 0.79% RECOVERY (%) 87% RECOVERY (%) 88% 87% 88% Q2 2013 Q3 2013 83% 81% Q1 2013 Q2 2013 Q3 2013 Q1 2013 PRODUCTION (Koz) 22 PRODUCTION (Mlbs) 25 19 15 Q1 2013 21 12 Q2 2013 Q3 2013 Q1 2013 Q2 2013 Q3 2013 9
  • 10.
    Peer-leading growth pipeline Evaluatingfurther throughput expansion potential to ~14,000 tonnes per day DRAWBELLS • 78 completed to date • 85 to be completed by year-end • 14 million tonnes, or approximately three years, of broken reserves accessible CRUSHER • 20,000 tonne per day design capacity • Daily maximum of 18,581 tonnes in August 2013 CONVEYOR • 14,500 tonne per day design capacity • During third quarter, 52 days over 14,000 tonnes per day conveyed 10
  • 11.
    Peer-leading growth pipeline Evaluatingfurther throughput expansion potential to ~14,000 tonnes per day • During third quarter, ran operation at 14,000 to 15,500 tonnes per day over five day period • Mill was able to process higher throughput, however a commensurate decrease in recovery was seen • Currently evaluating low capital cost alternatives to process at higher rate and bring recoveries into the high 80’s/low 90’s • Potential to include: • Addition of a tower mill for tertiary grinding • Additional rougher flotation capacity at front end of the flotation circuit • Additional cleaner capacity 11
  • 12.
    Peer-leading growth pipeline NewAfton C-Zone exploration program Looking Northwest • Actively exploring for both near and medium-term resource growth • East Cave Extension represents lateral extension of B-Zone currently being mined • Added two years to mine life through 2012 exploration efforts B Zone Reserve • C-Zone represents down plunge extension of ore body • All 2013 exploration to be incorporated into year-end mineral reserve and resource update East Cave Extension and Hanging Wall Lens C Zone C-ZONE RESOURCE SUMMARY(1) Measured and Indicated GOLD COPPER Inferred 0.3 Moz at 0.77 g/t 0.4 Moz at 0.62 g/t 211 Mlbs at 0.77% 301 Mlbs at 0.68% 12
  • 13.
    Peer-leading growth pipeline Threeorganic projects Industry leading organic growth profile +800 Koz (1) El Morro • Growth projects expected to increase gold production by ~1.75 times over current operations • Blackwater and Rainy River acquisitions increased shares outstanding by 25% for potential +150% increase in production Four current operations Blackwater(2) • Projecting below current industry average cash costs at each project Rainy River 2013 Gold Production Annual Production Potential of Growth Assets 13
  • 14.
    Peer-leading growth pipeline Threeworld-class projects Rainy River Blackwater El Morro (30% ) Significant Gold M&I Resource Base(1)(2) 6.2 Moz 8.6 Moz 2.9 Moz Exploration Potential Intrepid Zone/Multiple Regional Targets Capoose/Multiple Regional Targets El Morro Zone/ Block Cave Potential Jurisdiction Ontario, Canada British Columbia, Canada Chile Robust Production/ Low Cash Costs(3) ~225 Koz at below average cash costs ~500 Koz at below average cash costs ~90 Koz Au/85 Mlbs Cu at ~($700) cash costs(4) RAINY RIVER BLACKWATER EL MORRO 14
  • 15.
    Peer-leading growth pipeline Controlof two underexplored districts • +169 km2 land package • Multiple targets including recently discovered Intrepid Zone RAINY RIVER Existing resource Exploration targets Off Lake Son of Intrepid Western Zone Rainy River Intrepid Intrepid Extension 15
  • 16.
    Peer-leading growth pipeline Controlof two underexplored districts • +1,000 km2 land package • Initial resource at Capoose ~25 km from main Blackwater resource BLACKWATER Existing resource Exploration targets Capoose • Multiple regional targets Van Tine Fawnie Blackwater Auro 10km 16
  • 17.
    A history ofvalue creation Increasing Net Asset Value drives share price growth Net Asset Value (1) March 2009 December 2013 PRICE PERFORMANCE SINCE BUSINESS COMBINATION WITH WESTERN GOLDFIELDS IN MARCH 2009 (5) Mesquite, Cerro San Pedro, Peak Mines ~$875 165% $1,027 New Afton ~$120 $1,542 El Morro (2) ~$40 35% $400 Blackwater (3) $– $720 (29% ) (48% ) Rainy River(4) $– $485 (41% ) S&P/TSX Global FTSE Gold Gold Index (6) Mines Index (7) HUI Index (8) Gold Price New Gold 17
  • 18.
    A history ofvalue creation Near-term catalysts 2013 guidance – increased resources, production growth and lower costs Blackwater resource update New Afton C-Zone exploration update Completion of Rainy River acquisition New Afton mill to reach 12,000 tonnes per day Resolution of El Morro temporary permit suspension Completion of Blackwater Feasibility Study Rainy River Feasibility Study Update Blackwater/Rainy River/New Afton exploration/resource updates New Afton throughput expansion update 18
  • 19.
    New Gold investmentthesis Portfolio of assets in top-rated jurisdictions Invested and experienced team Among lowest-cost producers with solid track record Peer-leading growth pipeline Establishing the leading intermediate gold company Track record of value creation
  • 20.
    Appendix Appendices Page 1. Financial information 21 2. Consolidated operatingperformance/Q3’13 summary 27 3. New Afton 32 4. Rainy River 38 5. Blackwater 39 6. El Morro 41 7. Reserves and resource notes 47 8. Commodity price/foreign exchange assumptions 54 20
  • 21.
    Appendix 1 Capitalization andliquidity • • Undrawn Credit Facility(2) Liquidity Position $429mm Two senior unsecured note offerings during 2012 ($300 million at 7.00%, $500 million at 6.25%) • Total common shares outstanding of 503 million • Cash and Equivalents (1) All corporate debt due in 2020 or beyond(3) Paid $66 million to eliminate legacy gold hedges on May 15, 2013 $100mm $529mm 1. Cash and equivalents as at Septem ber 30, 2013. 2. $50 m illion of total $150 m illion currently used for Letters of Credit. 3. See Appendix 1 – Sum ary of debt for detailed breakdown of com m ponents of debt. 21
  • 22.
    Appendix 1 Summary ofdebt Undrawn Credit Facility Senior Unsecured Notes (April 2012) Senior Unsecured Notes (November 2012) El Morro Funding Loan Face Value $150 million(1) $300 million $500 million $76 million Maturity 1 year with annual extensions permitted April 15, 2020 November 15, 2022 n/a Interest Rate See ‘Key features’ 7.00% 6.25% 4.58% Payable Revolving credit Semi-annually Semi-annually Upon start of production Conversion price n/a n/a n/a n/a Current trading value n/a ~104 ~98 n/a Key features • • • • • • • • 1. $50 m illion currently allocated for Letters of Credit. Normal financial covenants Interest Rate 3.00-4.25% over LIBOR based on ratios Standby fee of 0.751.06% • Senior unsecured Redeemable after April 15, 2016 at 103.5% down to 100% of face after 2018 Unlimited dividends if leverage ratio below 2:1 • Senior unsecured Redeemable after November 15, 2017 at par plus half coupon, declining ratably to par Unlimited dividends if leverage ratio below 2:1 New Gold to repay Goldcorp out of 80% of its 30% share of cash flow once El Morro starts production 22
  • 23.
    Appendix 1 2012 and2013 capital expenditures by site • New Gold’s 2013 estimated capital expenditures are $315 million • • • Capital includes costs related to ongoing annual sustaining capital as well as investments for future production Capital estimate includes recently acquired Rainy River project Capital estimates by site are shown below: TOTAL 2012 ACTUAL CAPITAL EXPENDITURES: $499 MILLION Cerro San Pedro $11mm TOTAL 2013 CAPITAL EXPENDITURE ESTIMATE: $315 MILLION Mesquite $11mm Mesquite $20mm Peak Mines $47mm Rainy River $25mm Cerro San Pedro $40mm Blackwater $128mm New Afton $302mm New Afton $110mm Peak Mines $60mm Blackwater $60mm 23
  • 24.
    Appendix 1 2013 capitalexpenditures by category • The below breaks down capital expenditures at each site into two categories – annual sustaining capital and direct investments for future production growth and mine life extension New Afton - $110 million • 18% • 82% $90 million – continued cave and drawbell development as well as related technical services Total of ~90 drawbells expected to be completed by end of 2013 • Annual drawbell development to decrease over mine life with commensurate decrease in capital Blackwater - $60 million • • $15 million – capitalized exploration $45 million – Feasibility and related engineering studies, permitting, camp facilities/operation • • 100% $30 million – underground development and capitalized exploration $30 million – equipment, mine and mill projects/maintenance Peak Mines - $60 million 50% 50% Direct investment for future production Annual sustaining capital 24
  • 25.
    Appendix 1 2013 capitalexpenditures by category Cerro San Pedro - $40 million • • $30 million – final leach pad expansion and capitalized stripping for phase 5 development $10 million – site maintenance/processing improvements • • $20 million – engineering, studies, environmental and other $5 million – ongoing exploration • $12 million – two additional trucks and construction of new welding and tire shops $8 million – equipment components/site maintenance 25% 75% Rainy River - $25 million 100% Mesquite - $20 million 40% • 60% Direct investment for future production Annual sustaining capital New Gold’s 30% share of estimated 2013 El Morro capital cost of $10 million fully carried by Goldcorp Inc. 25
  • 26.
    Appendix 1 2013 explorationprogram overview • New Gold’s estimated exploration budget for 2013 is $50 million • • • Capitalized: $20 million Expensed: $30 million Additional $5 million of exploration at Rainy River post acquisition Capitalized: $5 million Capitalized: $15 million Expensed: $5 million Expensed: $15 million Peak Mines 33,000 metres Blackwater 40,000 metres New Afton 40,000 metres Expensed: $10 million 26
  • 27.
    Appendix 2 2013 thirdquarter highlights • Gold production – 94,038 ounces • Total cash costs(1) – $280 per ounce sold • All-in sustaining costs(2) – $779 per ounce • New Afton achieved targeted increase in throughput three months ahead of schedule • Adjusted earnings per share (3) – $0.04/share Lowest cost quarter in company’s history • Adjusted net cash generated from operations (4) – $54 million • Completed Rainy River acquisition(5) • Cash and cash equivalents of $429 million 1. 2. 3. 4. 5. Refer to Endnote on total cash costs under the heading “Non-GAAP Measures”. Refer to Endnote on all-in sustaining costs under the heading “Non-GAAP Measures”. Refer to Endnote on adjusted net earnings under the heading “Non-GAAP Measures”. Refer to Endnote on adjusted net cash generated from operations under the heading “Non-GAAP Measures”. 97.5% of Rainy River was acquired in Q3, with the rem aining 2.5% acquired in Q4. 27
  • 28.
    Appendix 2 2013 mine-by-mineoperating results 2013 THIRD QUARTER Gold sales (000s ounces) costs (1) Cash ($/oz) 2013 YEAR-TO-DATE All-in Sustaining costs (2) ($/oz) Gold sales (000s ounces) Cash costs (1) ($/oz) All-in Sustaining costs (2) ($/oz) New Afton 25 ($1,310) ($365) 62 ($1,104) ($191) Cerro San Pedro 24 $723 $771 81 $605 $674 Mesquite 21 $1,017 $1,098 72 $936 $1,162 Peak Mines 24 $856 $1,332 77 $874 $1,405 94 $280 $779 291 $399 $905 2013 THIRD QUARTER 2013 YEAR-TO-DATE New Afton co-product cash costs(1) Gold ($/oz) $454 $526 Copper ($/lb) $1.05 $1.24 1. Refer to Endnote on total cash costs under the heading “Non-GAAP Measures”. 2. Refer to Endnote on all-in sustaining costs under the heading “Non-GAAP Measures”. 28
  • 29.
    Appendix 2 Consolidated financialsummary 2013 THIRD QUARTER 2012 THIRD QUARTER $196 $196 Earnings from mine operations ($ million) $51 $77 Net earnings ($ million) $12 $18 $0.02 $0.04 $20 $43 $0.04 $0.09 $54 $47 Revenue ($ million) Net earnings per share ($/share) Adjusted net earnings(1) ($ million) Adjusted net earnings per share(1) ($/share) Adjusted net cash generated from operations (2) ($ million) 1. Refer to Endnote on adjusted net earnings under the heading “Non-GAAP Measures”. 2. Refer to Endnote on adjusted net cash generated from operations under the heading “Non-GAAP Measures”. 29
  • 30.
    Appendix 2 2013 estimatedall-in sustaining costs Total cash costs (1) ~$375/oz General and administrative ~$70/oz Exploration expense ~$80/oz Sustaining capital(2) ~$375/oz ALL-IN SUSTAINING COSTS(3) 1. Refer to Endnote on total cash costs under the heading “Non-GAAP Measures”. 2. Sustaining capital based on New Gold’s total 2013 estim ated capital expenditures excluding expenditures related to growth-related initiatives. 3. Refer to Endnote on all-in sustaining costs under the heading “Non-GAAP Measures”. ~$900/oz 30
  • 31.
    Appendix 2 Lower costsdriving margin expansion New Gold offers shareholders potential for over $400 per ounce(1) of incremental margin $782(4) $800 $738 Total Cash Costs (US$/oz)(2) $643 $600 $557 $478 Incremental Margin to New Gold Shareholders $465 $446 $400 $421 $418 $375 $200 2009 1. 2. 3. 4. 2010 2011 Calculated based on H1’2013 GFMS industry average cash costs less New Gold 2013 cash cost guidance. Assum no change to industry average cash costs for rem es ainder of 2013. Refer to Endnote on total cash costs under the heading “Non-GAAP Measures”. Industry data per GFMS reports calculated net of by-product credits as at various year-ends Industry data per GFMS reports calculated net of by-product credits at H1’2013. 2012 2013E 31
  • 32.
    Appendix 3 Drawbell continuityschedule Copper resource grades Accelerated East Cave development completed June 2013 East Cave production began June 2013 65 drawbells in production In West Cave Planned Draw bells in 2013 Planned Future Drawbells 32
  • 33.
    Appendix 3 Mill schematic FinalConcentrate To Tailings Surface Stockpile Potential New Facilities 33
  • 34.
    Appendix 3 East CaveExtension and Hanging Wall Lens overview Reserves Replacement • East Cave Extension delineation and infill drilling to extend Main Zone reserve laterally to east • Hanging Wall Lens drilling to test potential to develop additional resources in hanging wall to Main Zone East Cave Extension Hanging Wall Lens Holes Metres Holes Metres 2013 program 34 8,253 24 9,522 2012 program 8 3,177 - - Total to date 42 11,430 24 9,522 34
  • 35.
    Appendix 3 Drill programhighlights HIGHLIGHTS FROM EAST CAVE DRILL PROGRAM Drill Hole From (m) To (m) Interval (m) Gold (g/t) Copper (%) AF13-198 19 58 39 0.17 0.38 AF13-207 41 110 69 0.50 0.69 AF13-210 44 180 136 0.25 0.66 AF13-212 46 190 144 0.18 0.75 AF13-215 236 406 170 0.67 1.47 AF13-227 216 322 106 0.21 0.59 HIGHLIGHTS FROM HANGING WALL LENS DRILL PROGRAM Drill Hole From (m) To (m) Interval (m) Gold (g/t) Copper (%) EA13-040 138 224 86 0.33 0.78 EA13-041 226 256 30 1.69 1.22 EA13-049 256 278 22 1.68 1.08 EA13-055 294 336 42 0.49 0.62 EA13-062 252 352 100 0.80 0.43 EA13-068 366 418 52 2.04 1.43 EA13-079B 294 462 168 1.21 0.70 3 70 67 0.54 0.15 EA13-084 1. Refer to news release dated October 21, 2013 “New Gold Achieves Targeted Throughput Increase at New Afton Ahead of Schedule” as filed on SEDAR for all assay results as well as other disclosure relating to these results. 35
  • 36.
    Appendix 3 C-Zone overview ResourceExpansion • C-Zone delineation and infill drilling to expand and upgrade resource to support future engineering design studies Holes Metres 2013 program 41 26,800 2012 program 26 13,900 Total to date 67 40,700 • Exploring potential to expand C-Zone to west and down plunge C-ZONE RESOURCE SUMMARY(1) Measured and Indicated Inferred GOLD 0.3 Moz at 0.77 g/t 0.4 Moz at 0.62 g/t COPPER 211 Mlbs at 0.77% 301 Mlbs at 0.68% Note: Includes all 2012 drilling plus five holes completed in early 2013 1. Refer to appendix 7 for detailed breakdown of resources and other inform ation related to resource estim ates. 36
  • 37.
    Appendix 3 C-Zone highlights 2013C-ZONE DRILLING HIGHLIGHTS From (m) To (m) Interval (m) Gold (g/t) Copper (%) EA13-031 644 708 64 0.86 1.33 EA13-032 478 622 144 0.92 1.10 EA13-034 744 810 66 0.90 0.93 EA13-036 592 678 86 1.51 1.66 EA13-037 566 652 86 0.66 1.38 EA13-045 526 588 62 0.85 1.13 EA13-046 722 792 70 1.13 1.06 EA13-054 504 628 124 1.08 1.52 EA13-056 740 820 80 0.70 0.48 EA13-076 372 416 44 0.54 0.96 EA13-088 514 596 82 1.95 2.57 Drill Hole • 2013 drilling program has tripled the amount of drill hole data defining the C-Zone resource • Drill program has both extended limits and improved classification confidence in C-Zone resource 1. Refer to news release dated October 21, 2013 “New Gold Achieves Targeted Throughput Increase at New Afton Ahead of Schedule” as filed on SEDAR for all assay results as well as other disclosure relating to these results. 37
  • 38.
    Appendix 4 Rainy River– Location • Mining friendly Northwestern Ontario • 65 km northwest of Fort Frances • 80 km south of Kenora • Within 25 km of rail and power • Local skilled labour force Kenora Rainy River Gold Project Fort Frances HWY 600 Thunder Bay Site Topography 38
  • 39.
    Appendix 5 Blackwater –A robust project Measured and Indicated Gold Resources (1) – Direct Processing Material 8.6 Moz • Additional Measured and Indicated gold resources – stockpile material of 0.9 million ounces • Central British Columbia near infrastructure • Year-round accessibility for drilling/ development • Total 2012 drilling over 270,000 metres project wide • Tax synergies with New Afton • PEA completed September 2012 • Targeting annual gold production of ~500,000 ounces • • 1. Refer to Appendix 7 for detailed disclosure on Resource calculations and other inform ation related to resource estim ates. 2. Blackwater’s potential is not supported by a feasibility study. See Endnote “Blackwater PEA – Additional Cautionary Note”. Targeting completion of Feasibility Study by late 2013 Consolidated significant land position – 1,000 km2 39
  • 40.
    Appendix 5 Blackwater –Project overview • Conventional truck and shovel open pit mine with 60,000 tonnes per day processing plant • Low grade stockpiling strategy • Simple, conventional flowsheet using whole ore leach process • Conventional waste rock and Tailings Storage Facility • Power supply from the hydroelectric power grid, via 133 kilometre transmission line • Minimal off-site infrastructure required • • Good existing access road; water supply within 15 kilometres Low environmental risk and facility designed for closure 1. Source: Septem ber 2012 Prelim inary Econom Assessm ic ent. 40
  • 41.
    Appendix 6 El Morro(30%) 2.9 Moz Gold Reserve(1) 2.1 Blbs Copper Reserve(1) • Goldcorp – 70% partner and project operator • New Gold’s 30% share of capital fully funded by Goldcorp Location Chile Mine type Open Pit Reserves (1) – Gold/Copper (Moz/Mlbs) 2.9/2,097 Resources (1) – Gold/Copper (Moz/Mlbs) 2.9/2,097 Estimate mine life 17 years LOM production/yr (Au Koz/Cu Mlbs) 90/85 LOM cash costs/oz by-product(2) ($700) • Current resource entirely within La Fortuna deposit • Neighbouring El Morro deposit underexplored • 2012 year end update added 0.4 million ounces of gold and 229 million pounds of copper to reserves (1) • Evaluating various alternatives for a power source to northern Chilean development projects 1. New Gold’s attributable 30% share. Refer to Appendix 7 for detailed disclosure on reserve and resource calculations. 2. Refer to Endnote on total cash cost under the heading “Non-GAAP Measures”. Life of m ine co-product costs estim ated at $550/oz gold and $1.45/lb copper at com odity price assum m ptions of $1,200/oz gold and $2.75/lb copper. 41
  • 42.
    Appendix 6 El Morrooverview of updated Feasibility Study • El Morro Feasibility Study was updated in December 2011 • Key parameters for New Gold include: • 30% share of estimated development capital, or $1.2 billion, carried by Goldcorp – Receive cash flow from start of production – Interest rate fixed at 4.58% • Base 17-year mine life • 30% share of annual production: ~90,000 ounces of gold and ~85 million pounds of copper • Estimated total cash costs (1), net of by-products ($700) per ounce – Co-product gold ~$550 per ounce – Co-product copper ~$1.45 per pound 1. Refer to Endnote on total cash costs under the heading “Non-GAAP Measures” . 42
  • 43.
    Appendix 6 La Fortunadeposit 2012 open pit Proven and Probable reserves and Measured and Indicated resources Underground Inferred resource with block cave potential 500 m etres 43
  • 44.
    Appendix 6 El Morro(30%) – Funding structure(1) Total Capital 100% ~ $3.9 billion 30% 100% Average annual cash flow 70% Funded by $1.2 billion interest at 4.58% ~ $2.7 billion 30% 20% 70% 80% Carried funding repayment • New Gold’s 30% share of development capital 100% carried • Interest fixed at 4.58% 1. Capital estim ates based on Decem ber 2011 Feasibility Study. 44
  • 45.
    Appendix 6 Selected porphyrygold/copper deposits/mines (1) Au Grade (g/t) 0.80 New Afton 0.70 0.60 El Morro 0.50 0.40 0.30 0.20 0.10 -0.20% 0.40% 0.60% 0.80% Producing 1.20% (2) Cu Grade (%) Development Alumbrera Chapada Cadia-Ridgew ay 1.00% New Prosperity Mt. Milligan El Morro New Afton Cobre Panama Cerro Casale Agua Rica 1. Based on disclosure by respective com panies. 2. Includes “Cadia East Underground” and “Ridgeway Underground” reserves as indicated in Newcrest’s February 8, 2013 press release; does not inc lude “Other” Cadia province reserves. 45
  • 46.
    Appendix 6 El Morrorelative positioning(1) EL MORRO WITHIN GOLDCORP PORTFOLIO Asset Gold Reserves (Moz) Asset Gold Equivalent(2) (Moz) Penasquito 15.7 Penasquito 43.9 Pueblo Viejo 10.0 El Morro 17.4 Los Filos 7.4 Pueblo Viejo 11.7 El Morro 6.7 Los Filos 8.4 Cerro Negro 5.7 Cerro Negro 6.7 1. All reserve inform ation taken from Goldcorp’s Decem ber 31, 2012 year-end resource statem ents. 2. Gold equivalent calculated based on the following com odity prices: Gold - $1,600/oz; Silver - $30.00/oz; Copper - $3.50/lb; Lead - $0.90/lb; Zinc - $0.90/lb. m 46
  • 47.
    Appendix 7 Reserves andresources summary Mineral Reserves and Resources Summary Year End 2012 Gold Koz Proven and Probable Reserves Measured and Indicated Resources (inclusive of Reserves) Inferred Resources M&I Resources (inclusive of Reserves) Mesquite Cerro San Pedro Peak Mines New Afton Blackwater Capoose Rainy River El Morro Total M&I 11,783 29,242 6,822 5,684 1,703 880 2,224 9,497 196 6,167 2,891 29,242 (1)(2) Silver Koz Year End 2011 Copper Mlbs Gold Koz 41,571 159,585 88,359 3,282 4,223 1,187 7,863 18,797 6,323 - 146 1,980 2,097 4,223 5,534 1,812 948 1,742 5,423 384 n/a 2,954 18,797 57,980 1,350 7,292 70,128 9,497 13,338 159,585 Silver Koz (3) Copper Mlbs 34,347 115,268 76,856 2,888 3,946 2,202 - 167 1,586 n/a 2,193 3,946 55,860 1,570 5,470 25,774 26,594 n/a 115,268 1. For additional inform ation regarding reserve and resource estim ates; refer to: New Gold’s “Annual Inform ation Form for the Financial Year Ended Decem ber 31, 2012” dated March 27, 2013; news release dated April 4, 2013 “New Gold Announces Increased Gold Resources at Blackwater Project”; news release dated May 1, 2013 “New Gold Announces 2013 First Quarter Results – Increases Gold and Copper Resources at New Afton C-Zone by Over 300 Percent”; and news release dated July 31, 2013 “New Gold Second Quarter Delivers Increased Production at Lower Costs - Second Half of 2013 Rem ains on Track to Provide Strong Finish to the Year”. 2. Year end 2012 Mineral Resources updated for Blackwater resource updates on April 4, 2013 and New Afton C -Zone update on May 1, 2013. 47 3. Year end 2011 Mineral Resources presented at Investor Day on February 2, 2012.
  • 48.
    Appendix 7 Reserves andresources summary (cont’d) Mineral Reserves statement as at December 31, 2012(1) Metal grade Tonnes 000s Mesquite Proven Probable Mesquite P&P Cerro San Pedro Proven Probable CSP P&P Peak Mines Proven Probable Peak P&P New Afton Proven Probable New Afton P&P Rainy River Proven Probable Rainy River P&P El Morro Proven Probable El Morro P&P Total Proven Total Probable Total P&P 13,140 Gold g/t Contained metal Silver g/t Copper % Gold Koz - - 2,055 127,549 0.68 0.56 0.57 21,100 26,400 47,500 0.52 0.48 0.50 17.1 17.4 17.3 2,109 2,118 4,227 5.89 3.82 4.85 52,500 52,500 Silver Koz 2,342 - - - 353 407 760 11,600 14,800 26,400 - 7.5 6.8 7.2 1.08 1.18 1.13 399 260 659 510 466 976 50 55 105 0.65 0.65 2.3 2.3 0.93 0.93 1,100 1,100 3,880 3,880 1,080 1,080 27,700 88,600 116,300 1.14 1.06 1.08 1.94 3.01 2.76 - 1,015 3,017 4,031 1,728 8,587 10,315 - 307,949 335,152 643,101 0.57 0.37 0.47 - 0.56 0.44 0.49 1,705 1,186 2,891 3,759 8,025 11,783 114,409 287 Copper Mlbs 100% Basis 1. Year end 2012 Mineral Resources updated for Blackwater Resource update on April 4, 2013 and New Afton C -Zone update on May 1, 2013. 30% Basis 13,838 27,733 41,571 1,135 962 2,097 1,185 2,097 3,282 48
  • 49.
    Appendix 7 Reserves andresources summary (cont’d) Measured and Indicated mineral Resource statement (inclusive of Reserves) as at December 31, 2012(1) Metal grade Tonnes 000s Gold g/t Contained metal Silver g/t Copper % Gold Koz Silver Koz Copper Mlbs Mesquite Measured - oxide Indicated - oxide Meqsuite M&I - oxide Measured - non oxide 19,100 274,100 293,200 4,900 0.51 0.38 0.39 0.88 - - 313 3,349 3,662 139 - - Indicated - non oxide 96,000 0.61 - - 1,883 - - Mesquite M&I - non oxide 100,900 0.62 - - 2,022 - - Total Mesquite M&I Cerro San Pedro Measured - oxide Indicated - oxide CSP M&I - oxide Measured - sulphide Indicated - sulphide CSP M&I - sulphide Total CSP M&I Peak Mines Measured Indicated Peak M&I New Afton A&B Zones Measured Indicated A&B Zone M&I C-Zone Measured Indicated C-Zone M&I Total New Afton M&I 394,100 0.45 - - 5,684 - - 27,100 49,000 76,100 15,200 60,400 75,600 151,700 0.34 0.24 0.28 0.47 0.41 0.42 0.35 15.0 13.0 13.7 11.9 9.6 10.1 11.9 - 303 380 683 229 791 1,020 1,703 13,100 20,480 33,580 5,800 18,600 24,400 57,980 - 2,700 3,200 5,900 5.74 3.75 4.66 7.5 6.8 7.1 1.05 1.19 1.13 494 386 880 647 703 1,350 62 84 146 33,500 45,900 79,400 0.86 0.67 0.75 2.9 2.4 2.6 1.18 0.89 1.01 929 984 1,913 3,160 3,530 6,690 873 896 1,769 1,282 11,205 12,486 91,886 0.75 0.78 0.77 0.75 1.4 1.5 1.5 2.6 0.79 0.77 0.77 1.00 31 280 311 2,224 56 548 602 7,292 22 189 211 1,980 1. Year end 2012 Mineral Resources updated for Blackwater Resource update on April 4, 2013 and New Afton C-Zone update on May 1, 2013. 49
  • 50.
    Appendix 7 Reserves andresources summary (cont’d) Measured and Indicated mineral Resource statement (inclusive of Reserves) as at December 31, 2012 Metal grade Tonnes 000s Blackwater Direct processing material Measured Indicated M&I (direct processing) Stockpile material Measured Indicated M&I (stockpile) Total Blackwater M&I Capoose Indicated Gold g/t (1) Contained metal Silver g/t Copper % Gold Koz Silver Koz Copper Mlbs 116,955 189,044 305,999 1.04 0.78 0.88 5.6 6.0 5.8 - 3,896 4,729 8,624 21,057 36,467 57,524 - 26,521 64,382 90,903 396,902 0.30 0.30 0.30 0.74 4.1 4.4 4.3 5.5 - 256 617 873 9,497 3,496 9,108 12,604 70,128 - 14,200 0.43 20.8 - 196 9,497 - Measured 27,638 1.33 1.90 - 1,182 1,689 - Indicated 130,885 1.18 2.8 - 4,985 11,649 - Total Rainy River M&I 158,523 1.21 2.62 - 6,167 13,338 - Rainy River El Morro Measured Indicated El Morro M&I Total Measured Total Indicated Total M&I 100% Basis 307,949 335,152 643,101 0.57 0.37 0.47 1. Year end 2012 Mineral Resources updated for Blackwater Resource update on April 4, 2013 and New Afton C -Zone update on May 1, 2013. 30% Basis - 0.56 0.44 0.49 1,705 1,186 2,891 9,477 19,766 29,242 49,005 110,582 159,585 1,135 962 2,097 2,092 2,131 4,223 50
  • 51.
    Appendix 7 Reserves andresources summary (cont’d) Inferred Resource statement as at December 31, 2012(1) Metal grade Tonnes 000s Gold g/t Contained metal Silver g/t Copper % Gold Koz Silver Koz Copper Mlbs Mesquite Oxide 35,200 0.33 - - 373 - - Non oxide 15,700 0.55 - - 278 - - Mesquite Inferred 50,900 0.40 - - 651 - - Oxides 53,400 0.17 9.0 - 300 15,400 - Sulphides 50,500 0.34 8.5 - 550 13,800 - 103,900 0.25 8.8 - 850 29,200 - 1,700 2.64 4.8 1.13 144 261 42 A&B-Zone 14,900 0.45 2.0 0.65 216 940 212 C-Zone 20,221 0.62 1.4 0.68 401 923 301 New Afton Inferred 35,121 0.56 1.5 0.68 617 1,863 513 13,815 0.76 4.1 - 337 1,821 - Cerro San Pedro CSP Inferred Peak Mines New Afton Blackwater Direct processing Stockpile 3,785 0.31 3.6 - 38 438 - Blackwater Inferred 17,600 0.66 4.0 - 375 2,263 - Capoose 64,070 0.29 23.2 - 595 47,789 - Rainy River 93,804 0.76 2.32 - 2,280 6,983 - 100% Basis El Morro 137,555 0.99 Total Inferred 1. Year end 2012 Mineral Resources updated for Blackwater Resource update on April 4, 2013 and New Afton C -Zone update on May 1, 2013. 30% Basis - 0.70 1,310 - 632 6,822 88,359 1,187 51
  • 52.
    Appendix 7 Reserves andresources notes Mineral reserves are contained w ithin Measured and Indicated mineral resources. Measured and Indicated mineral resources that are not mineral reserves do not have demonstrated economic viability as defined by a technical Feasibility Study. New Gold reports its Measured and Indicated mineral resources inclusiv e of its mineral reserves. Inferred mineral resources are not know n w ith the same degree of certainty as Measured and Indicated resources, do not have demonstrated economic viability, and are exclusive of mineral reserves. Mineral reserves have been estimated and reported in accordance with the Canadian Institute of Mining, Metallurgy and Petroleum (‘CIM’) definition standards and guidelines and Canadian National Instrument 43-101 (‘NI 43-101’). 1) Mineral Reserves for the company’s mineral properties have been calculated based on the follow ing metal prices and low er cut-off criteria: Mineral Property Gold (US$/oz) Silver (US$/oz) Copper (US$/lb) Low er Cut-off Mesquite $1,300 - - 0.21 g/t Au – Oxide reserves 0.41 g/t Au – Non-oxide reserves Cerro San Pedro $1,300 $24.00 - US$4.33 /t NSR Peak Mines $1,300 $24.00 $3.00 A$120 – 253/t NSR New Afton $1,300 - $3.00 US$24/t NSR El Morro $1,350 - $3.00 0.20% CuEq Rainy River $1,250 $25.00 - 0.30 g/t AuEq – Open Pit 3.5 g/t AuEq - Underground 52
  • 53.
    Appendix 7 Reserves andresources notes (cont’d) 2) Mineral Resources for the company’s mineral properties have been calculated based on the follow ing metal prices and low er cut-off criteria: Mineral Property Gold (US$/oz) Silver (US$/oz) Copper (US$/lb) Low er Cut-off Mesquite $1,400 - - 0.12 g/t Au – Oxide resources 0.24 g/t Au – Non-oxide resources Cerro San Pedro $1,400 $28.00 - 0.1g/t AuEq – Open pit oxide resources 0.4g/t AuEq – Open pit sulphide resources Peak Mines $1,400 $28.00 $3.25 A$97 - 137/t NSR New Afton $1,400 $28.00 $3.25 0.40% CuEq – All resources El Morro $1,500 - $3.50 0.15% Cu – Open pit resources 0.20% Cu – Underground resources Blackw ater $1,400 $28.00 - 0.40 g/t AuEq Capoose $1,400 - - 0.40 g/t AuEq Rainy River $1,100 $22.50 - 0.35 g/t AuEq – Open Pit 2.5 g/t AuEq – Underground Mineral resources have been estimated and reported in accordance with CIM definition standards and guidelines and Canadian NI 43-101. 3) Mineral resources are classif ied as Measured, Indicated and Inf erred resources and are reported based on technical and economic parameters consistent with the methods most suitable f or their potential commercial exploitation. Where dif f erent mining and/or processing methods might be applied to dif f erent portions of a mineral resource, the designators ‘open pit’ and ‘underground’ hav e been applied to indicate env isioned mining method. Likewise the designators ‘oxide’, ‘non-oxide’ and ‘sulphide’ hav e been applied to indicate the ty pe of mineralization as it relates to appropriate mineral processing method and expect ed pay able metal recov eries. Additional details regarding mineral resource estimation, classif ication and reporting parameters f or each of New Gold’s mineral properties are prov ided in the respectiv e NI 43-101 Technical Reports which are av ailable on SEDAR. 4) Blackwater April 4, 2013 update: 1. Mineral resources are reported within a conceptual open pit shell based on metal prices of $1,400/oz gold and $28.00/oz silv er. The March 2013 mineral resource estimate utilizes av erage metallurgical recov eries of 88.0% gold and 64.0% silv er f or oxide mineralization, 85.0% gold and 58.0% silv er f or transitional oxide/sulf ide mineralization and 85.0% gold and 44.0% silv er f or sulf ide mineralization. The 2012 y ear-end mineral resource estimate utilizes av erage metallurgical recov eries of 86% gold and 44.9% silv er f or all material ty pes. 2. Total contained metal is calculated based on Tonnes*Grade / 31.10348 grams per troy ounce. 3. Gold-equiv alent cut-of f grade estimates are based on $1,400/oz gold and $28.00/oz silv er and av erage metal recov eries as described in Note 1 abov e. 4. Direct processing material is def ined as mineralization abov e a 0.40 g/t AuEq cut-of f and likely to be mined and processed directly . 5. Stockpile material is def ined as mineralization between a 0.30 g/t AuEq and a 0.40 AuEq cut-of f that is suitable f or stockpiling and f uture processing based on av erage metallurgical recov eries as described in Note 1 abov e. 5) Qualif ied Person: The preparation of New Gold’s mineral reserv e and resource statements has been done by or under the superv ision of Qualif ied Persons as def ined under Canadian NI 43-101 and they were rev iewed and approv ed by Mark Petersen, a Qualif ied Person under NI 43-101 and an of f icer of New Gold. 6) For additional inf ormation regarding reserv e and resource estimates, ref er to: New Gold’s “Annual Inf ormation Form f or the Financial Y ear Ended December 31, 2012” dated March 27, 2013; news release dated April 4, 2013 “New Gold Announces Increased Gold Resources at Blackwater Project”; news release dated May 1, 2013 “New Gold Announces 2013 First Quarter Results – Increases Gold and Copper Resources at New Af ton C-Zone by Ov er 300 Percent”; and news release dated July 31, 2013 “New Gold Second Quarter Deliv ers Increased Production at Lower Costs - Second Half of 2013 Remains on Track to Prov ide Strong Finish to the Y ear”. 53
  • 54.
    Appendix 8 Commodity price/foreignexchange assumptions Guidance assumptions(1) 2013 Gold price ($/oz) ~1,300 Silver price ($/oz) ~20.00 Copper price ($/oz) ~3.25 USD/AUD 1.00 USD/CAD 1.00 USD/MXN 13.00 Spot: Spot Gold price ($/oz) 1,225 Silver price ($/oz) 19.40 Copper price ($/oz) 3.20 USD/AUD 0.91 USD/CAD 0.94 USD/MXN 13.05 1. Based on year-to-date average realized prices through Septem ber 30, 2013 and assum ptions for the fourth quarter of 2013: Gold - $1,300 per ounce; Copper - $3.25 per pound; Silver - $20.00 per ounce; AUD/USD and CDN/USD parity. 54
  • 55.
    Notes Page 4 1. Rankingsbased on 25 countries evaluated in 2013 Behre Dolbear Report – 2013 Ranking of Countries for Mining Investment: “Where Not to Invest”. Page 5 1. Measured and Indicated Resources inclusive of Reserves. 2. Refer to Endnotes under the heading “Cautionary note to U.S. readers concerning estimates of Measured, Indicated and Inferred Resources ” and “Technical Information”. 3. New Gold completed the acquisition of 100% of Rainy River on October 15, 2013. 4. Refer to Appendix 7 for detailed breakdow n of reserves and resources and information related to reserve and resource estimate s. Page 7 1. Refer to Endnote on all-in sustaining costs under the heading “Non-GAAP Measures”. 2. Based on comparison w ith costs published by issuers listed in notes 4 and 5. The manner in w hich costs are determined may va from one issuer to another. ry 3. Refer to Endnote on total cash costs under the heading “Non-GAAP Measures”. 4. Mid-tier average includes: Alamos, Eldorado, Agnico Eagle, Aurico and IAMGOLD. 5. Senior average includes: Barrick, Goldcorp, Kinross and New mont. Page 8 1. Gold sales expected to be in the same general range as production. 2. Refer to Endnote on total cash costs under the heading “Non-GAAP Measures”. Guidance for total cash costs and all-in sustaining costs incorporates realized prices and foreign exchange rates to September 30, 2013 and assumes commodity price assumptions of: Gold - $1,300/oz; Copper - $3.25/lb; Silver - $20.00/oz for the balance of 2013. 3. Refer to Endnote on all-in sustaining costs under the heading “Non-GAAP Measures”. Page 12 1. Refer to Appendix 7 for detailed disclosure on Reserve and Resource calculations and information related to reserve and resource estimates. Page 13 1. Based on ~225Koz from Rainy River, ~500Koz from Blackw ater and ~90Koz from El Morro. Refer to slide 14 for more information. 2. Blackw ater’s potential is not supported by a feasibility study. See Endnote “Blackw ater PEA – Additional Cautionary Note”. 55
  • 56.
    Notes continued Page 14 1.Refer to Appendix 7 for detailed disclosure on Reserve and Resource calculations. 2. Refer to Endnotes under the heading “Cautionary note to U.S. readers concerning estimates of Measured, Indicated and InferredResources” and “Technical Information”. Measured and Indicated Resources are inclusive of Reserves. At Blackw ater, the 8.6 million ounces of Resources referred to ab ove excludes 0.9 million ounces of material to be stockpiled w hich has been classified as Measured and Indicated Resource. 3. Refer to Endnote on total cash costs under the heading “Non-GAAP Measures”. Cash costs have been compared to industry data per GFMS reports w hich calculated an average, net of by-product credits, cash cost of $738 per ounce for the YE’2012. 4. Blackw ater production and cash costs based on September 2012 PEA; Rainy River production and cash costs based on April 2013 F easibility Study; and El Morro production and cash costs based on updated December 2011 Feasibility Study.Blackw ater’s potential is not supported by a feasibility study. See Endnote “Blackw ater PEA – Additional Cautionary Note”. Page 17 Source: Broker Reports, Company Estimates and Announcements, Bloomberg; all amounts in USD. 1. New Gold’s average analyst consensus NAV. 2. New Gold’s average analyst consensus NAV for El Morro; includes $50 million cash payment received from Goldcorp as part of transaction consideration. 3. New Gold acquired Richfield and Silver Quest on June 1, 2011 and December 23, 2011, respectively. 4. New Gold completed the acquisition of 100% of Rainy River on October 15, 2013. 5. New Gold share price appreciation calculated using a base price of US$1.79 from the March 3, 2009 close. 6. S&P/TSX Global Gold Index includes 54 gold companies in various stages of development/production. 7. FTSE Gold Mines Index includes 26 gold producing companies. 8. HUI Index includes 15 of the major global gold producers. 56
  • 57.
    Endnotes CAUTIONARY NOTE TOU.S. READERS CONCERNING ESTIMATES OF MEASURED, INDICATED AND INFERRED RESOURCES Information concerning the properties and operations of New Gold has been prepared in accordance with Canadian standards under applicable Canadian securities laws, and may not be comparable to similar information for United States companies. The terms “Mineral Resource”, “Measured Mineral Resource”, “In dicated Mineral Resource” and “Inferred Mineral Resource” used in this presentation are Canadian mining terms as defined in accordance with National Instrument 43 -101 (“NI 43-101”) under guidelines set out in the Canadian Institute of Mining, Metallurgy and Petroleum (“CIM”) Standards on Mineral Resources and Mineral Reserves adopted by the CIM Council on November 2 7, 2010. While the terms “Mineral Resource”, “Measured Mineral Resource”, “Indicated Mineral Resource” and “Inferred Mineral Resource” are recognized and required by Canadian securities regulations, they are not defined terms under standards of the United States Securities and Exchange Commission. Under United States standards, mineralization may no t be classified as a “Reserve” unless the determination has been made that the mineralization could be economically and legally produced or extracted at the time the Reserve calculation is made. As such, certain information contained in this presentation concerning descriptions of mineralization and resources under Canadian standards is not comparable to similar in formation made public by United States companies subject to the reporting and disclosure requirements of the United States Securities and Exchange Commission. An “Inferred Mineral Resou rce” has a great amount of uncertainty as to its existence and as to its economic and legal feasibility. It cannot be assumed that all or any part of an “Inferred Mineral Resource” wil l ever be upgraded to a higher category. Under Canadian rules, estimates of Inferred Mineral Resources may not form the basis of feasibility or pre -feasibility studies. Readers are cautioned not to assume that all or any part of Measured or Indicated Resources will ever be converted into Mineral Reserves. Readers are also cautioned not to assume that all or any part of an “Inferred Mineral Resource” exists, or is economically or legally mineable. In addition, the definitions of “Proven Mineral Reserves” and “Probable Mineral Reserves” under CIM standards diffe r in certain respects from the standards of the United States Securities and Exchange Commission. TECHNICAL INFORMATION The scientific and technical information in this presentation has been reviewed and approved by Mark Petersen, a Qualified Person under National Instrument 43 -101 and officer of New Gold. Mineral Reserves and Mineral Resources The estimates of Mineral Reserves and Mineral Resources discussed in this presentation may be materially affected by environmenta l, permitting, legal, title, taxation, sociopolitical, marketing and other relevant issues. In addition to our February 5, 2013, April 4, 2013 and July 31, 2013 presentations, further details regarding Mineral Reserve and Resource estimates, including classifications, key assumptions and parameters used in such estimates and other related information for each of New Gold's mineral properties are provided in the respective NI 43-101 Technical Reports, which are available at www.sedar.com . Blackwater PEA – Additional Cautionary Note This note regarding the preliminary economic assessment (“PEA”) is in addition to cautionary language already included in this presentation as required under NI 43-101. The Blackwater PEA is preliminary in nature and includes Inferred Mineral Resources that are considered too speculative geologically to have the economic considerations applied to them that would enable them to be categorized as mineral reserves, and there is no certainty that the PEA based on these mineral resources will be realiz ed. Mineral resources that are not mineral reserves do not have demonstrated economic viability. This presentation includes information on New Gold’s PEA with respect to the Blackwater Project, which was outlined in the PEA Technical Report filed on October 10, 2012. As disclosed in the presentation, New Gold has, since the date of the PEA, completed several non-material updates of the mineral resource estimate for the Blackwater Project. Although the PEA represents useful, accurate and reliable information based on the information available at the time of its publication, and provides an important indicator as to the economic potential of the Blackwater Project, the PEA is based on mineral resources estimates with an effective date of July 27, 2012, which do not reflect drilli ng conducted since their effective date, and the PEA does not reflect the latest mineral resource estimate discussed in subsequent presentation. Certa in assumptions used in the PEA, some of which relate to the July 27, 2012 mineral resource estimate, may have changed from those used for the new resource estimate, causing a variation of parameters. Moreover, the updated mineral resource estimate may impact how New Gold intends to develop the deposit, including pit outlines, production rates and mine life. 57
  • 58.
    Endnotes continued NON-GAAP MEASURES TOTALCASH COSTS “Total cash costs” per ounce figures are non-GAAP measures which are calculated in accordance with a standard developed by The G old Institute, which was a worldwide association of suppliers of gold and gold products and included leading North American gold producers. The Gold Institute ceased operations in 2002, but the standard is widely accepted as the standard of reporting cash costs of production in North America. Adoption of the standard is voluntary and the cost measures presented ma y not be comparable to other similarly titled measures of other companies. New Gold reports total cash costs on a sales basis. Total cash costs include mine site operating costs such as min ing, processing, administration, royalties and production taxes, but are exclusive of amortization, reclamation, capital and exploration costs. Total cash costs are reduced by any by -product revenue and is then divided by ounces sold to arrive at the total by-product cash cost of sales. The measure, along with sales, is considered to be a key indicator of a company’s ability to gene rate operating earnings and cash flow from its mining operations. This data is furnished to provide additional information and is a non -IFRS measure. Total cash costs presented do not have a standardized meaning under IFRS and may not be comparable to similar measures presented by other mining companies. It should not be considered in isolation as a substitute for measures of performance prepared in accordance with IFRS and is not necessarily indicative of operating costs presented under IFRS. Further details regarding this measure and a reconciliation to the nearest IFRS measure is provided in the MD&A accompanying the quarterly financial statements. ALL-IN SUSTAINING COSTS Consistent with the guidance announced earlier in 2013 from the World Gold Council, an association of various gold mining com panies from around the world of which New Gold is a member, New Gold defines “all-in sustaining costs” as the sum of total cash costs, sustaining capital expenditures, corporate general & administrative costs, capitalized and expensed exploration that is sustaining in nature and environmental reclamation costs. New Gold believes this non -GAAP measure provides further transparency into costs associated with producing gold and will assist analysts, investors and other stakeholders of the company in assessing its operating performance, its ability to generate free cash flow from current operations and its overall value. Allin sustaining costs constitute a non-GAAP measure and are intended to provide additional information only and do not have any st andardized meaning under IFRS. They should not be considered in isolation or as a substitute for measures of performance prepared in accordance with IFRS. Other companies may calculate these measures differently. Further details regarding this measure and a reconciliation to the nearest IFRS measure is provided in the MD&A accompanying the quarterly financial statements. ADJUSTED NET EARNINGS “Adjusted net earnings” and “adjusted net earnings per share” are non -GAAP financial measures. Net earnings have been adjusted a nd tax affected for the group of costs in “Other gains and losses” on the condensed consolidated income statement. The adjusted entries are also impacted for tax to the extent that the underlying entries are impacted for tax in the unadjusted net earnings from continuing operations. The company uses this measure for its own internal purposes and believes the presentation of adjusted net earnings enables investors and analysts to better understand the underlying operating performance of our core mining business through the eyes of management. Management periodically evaluates the components of adjusted net earnings based on an internal assessment of performance measures that are useful for evaluating the operating performance of our business and a review of the non-GAAP measures used by mining industry analysts and other mining companies. Adjusted net earnings and adjusted net earnings per share are intended to provide additional information only and do not have any standardized meaning under IFRS. They should not be considered in isolation or as a substitute for measures of performance prepared in accordance with IFRS. The measures are not necessarily indicative of operating profit or cash flow from operations as determined under IFRS. Other companies may calcula te these measures differently. Further details regarding this measure and a reconciliation to the nearest IFRS measure is provided in the MD&A accompanying the quarterly financial statements. ADJUSTED NET CASH GENERATED FROM OPERATIONS “Adjusted net cash generated from operations” is a non-GAAP financial measure. Net cash generated from operations has been adjusted for one-time expenses related to the company’s acquisition of Rainy River in the third quarter and a one -time charge incurred in the second quarter related to the settlement o f the company’s legacy gold hedge position. The company believes the presentation of adjusted net cash generated from operations enables investors and analysts to better understand the underlying operating performance of our core mining business. Adjusted net cash generated from operations is intended to provide additional information only and does not have any standardized meaning under IFRS. It should not be considered in isolation or as a substitute for measures of performance prepared in accordance with IFRS. Further details regarding this measure and a reconciliation to the nearest IFRS measure is provided in the MD&A accompanying the quarterly financial statements. 58
  • 59.
    Contact information Investor Relations HannesPortmann Vice President, Corporate Development 416-324-6014 hannes.portmann@newgold.com 59