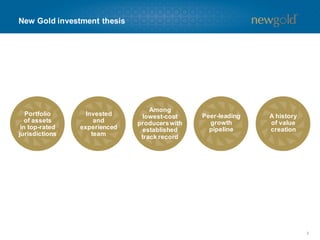
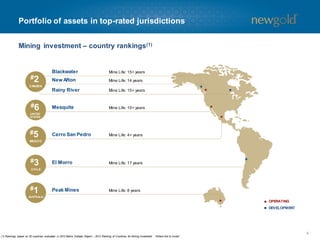
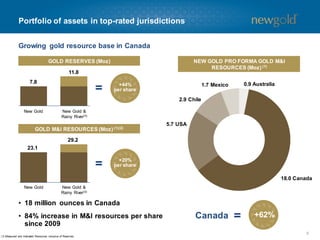
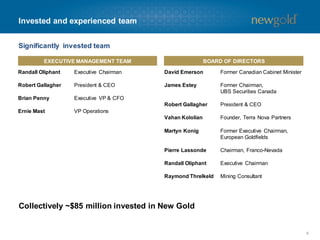
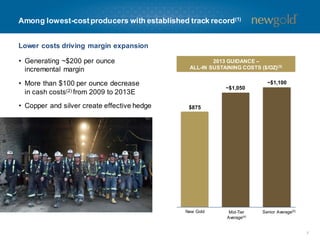
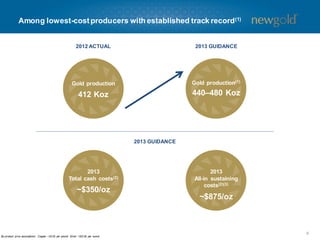
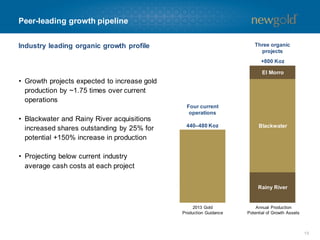
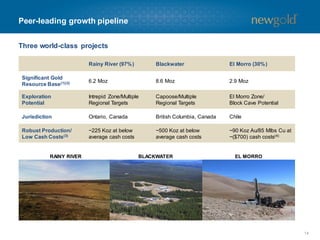
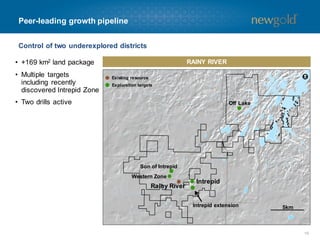
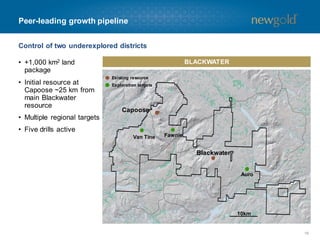
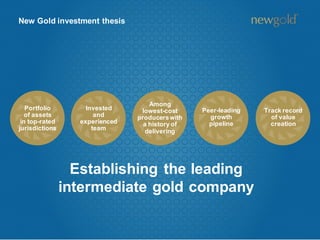
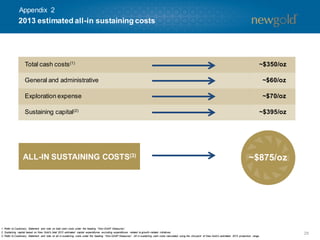
This document provides cautionary statements and an overview of the Denver Gold Forum held in September 2013. It cautions readers that monetary amounts are in US dollars unless otherwise stated, and that total cash costs are shown net of by-product sales. It also provides several cautionary notes regarding the use of forward-looking statements in the presentation. The document outlines New Gold's portfolio of assets in top-rated jurisdictions, its experienced management team, its position as a low-cost producer, and its peer-leading growth pipeline. It summarizes New Gold's production and cost guidance for 2013 and provides details on its current operations and projects.
Goldman Sachs - Annual Global Metals & Mining Conferencenewgold2011
New Gold is a mid-tier gold mining company with a portfolio of assets in top-rated jurisdictions. It has a track record of low-cost production and significant organic growth potential through projects like Blackwater, Rainy River, and New Afton. New Gold also has an experienced management team that is significantly invested in the company and has a history of creating value through acquisitions and exploration.
New Gold is an intermediate gold producer with a portfolio of assets in top-rated jurisdictions. It has a track record of low-cost production and is among the lowest-cost gold producers. New Gold also has an industry-leading growth pipeline through its Rainy River, Blackwater, and El Morro projects which could increase annual gold production by over 1.75 times current levels. New Gold has established a history of value creation through acquisitions and exploration success that has increased its net asset value and driven share price growth.
RBC Capital Markets London Gold Conferencenewgold2011
The document is a presentation from RBC Capital Markets' London Gold Conference in November 2013. It provides cautionary statements regarding forward-looking information and summarizes New Gold's investment thesis. New Gold has a portfolio of assets in top-rated mining jurisdictions including Canada, the United States, Mexico, and Chile. It has an experienced management team that is significantly invested in the company. New Gold is also among the lowest cost gold producers with a solid track record and goal of further reducing costs.
Third Quarter 2013 Financial Results Presentationnewgold2011
The document summarizes New Gold's third quarter 2013 results webcast. It highlights key points such as gold production of 94,038 ounces at total cash costs of $280 per ounce. New Afton achieved a targeted increase in throughput ahead of schedule. Adjusted earnings per share were $0.04. The updated 2013 outlook estimates gold production of 390,000-400,000 ounces and total cash costs of around $375 per ounce. New Afton exploration potential and New Gold's development projects are also briefly discussed.
Probe Metals is a well-funded Canadian gold explorer focused on unlocking value in Val-d'Or, Quebec. The company has consolidated 327 square kilometers of land in the Val-d'Or East district, within one of Canada's leading gold mining camps. An initial NI 43-101 resource estimate for the Val-d'Or East project indicated 770,000 ounces of gold at 2.6 g/t. Aggressive exploration is ongoing, with 85,000 meters of drilling planned for 2018 and a resource update expected in Q1. The company has a strong balance sheet of over $25 million and a strategic investor in Goldcorp.
This document provides an agenda for New Gold's 2013 Investor Day, which will include presentations on the company's 2012 performance and 2013 outlook, health and safety initiatives, development projects, reserves and resources, value enhancing initiatives at New Afton, and a conclusion. It also includes cautionary statements about the use of forward-looking information and non-IFRS performance measures.
Probe Metals is a well-funded gold explorer focused on its district-scale land package in Val-d'Or, Quebec. The company has consolidated over 327 km2 in the area, which contains its initial inferred resource of 770koz gold. Probe plans to aggressively explore the property through a 75,000 meter drill program to expand resources. The company is well positioned for growth with a strong balance sheet of over $30 million and a proven management team with a track record of success.
Probe Metals is a well-funded Canadian gold explorer advancing its Val-d'Or East project in Quebec. The project has over 1.8 million ounces of gold in the measured and indicated categories and over 2.3 million ounces in the inferred category. A preliminary economic assessment outlines an average annual production of 207,000 ounces of gold over a 12.5 year mine life with an after-tax NPV of C$598 million and IRR of 32.8% at a gold price of US$1,500. Probe plans a 162,000 meter drill program in 2022, its largest to date, to focus on exploration, expansion, and resource conversion at Val-d'Or East.
2016 Annual General Meeting of ShareholdersNOVAGOLD
This document summarizes the 2016 Annual General Meeting of Shareholders for NovaGold Resources Inc. It provides an agenda for the meeting including remarks from the Vice President & CFO, President & CEO, and Chairman. It also contains cautionary statements regarding forward-looking information and scientific and technical data. The document discusses NovaGold's projects including Donlin Gold in Alaska and Galore Creek in British Columbia and highlights their scale, quality and location in top-rated mining jurisdictions. It outlines NovaGold's achievements in 2015 including permitting progress for Donlin Gold and mine planning for Galore Creek. Goals for 2016 include further advancing Donlin Gold permitting toward a construction decision.
The document is an investor presentation for Golden Star Resources dated June 15th. It summarizes that Golden Star has secured $150 million in financing through a gold stream and loan agreement with Royal Gold. This financing will fully fund the development of Golden Star's Wassa and Prestea underground mine projects in Ghana. The presentation outlines how this financing and the development of the underground mines is expected to significantly improve Golden Star's cost profile and production outlook over the next several years.
Probe Metals is a well-funded Canadian gold explorer advancing its Val-d'Or East project. The project has grown to over 1.8 million ounces of gold in the measured and indicated categories and 2.3 million ounces in inferred. A preliminary economic assessment outlines a 12.5 year mine life producing an average of 207,000 ounces of gold per year with an after-tax NPV of C$598 million and IRR of 32.8% at a gold price of US$1,500. The project has significant exploration potential and is located in the mining-friendly jurisdiction of Quebec near infrastructure.
The document summarizes a corporate presentation for Probe Metals Inc., a well-funded Canadian gold explorer. Key points include:
- A preliminary economic assessment showed a 12.5 year mine life with average annual production of 207,000 ounces of gold and a post-tax NPV of C$598 million at a gold price of US$1,500.
- The Val-d'Or East project has over 1.8 million ounces of gold in measured and indicated resources and 2.3 million ounces in inferred resources, making it one of the largest gold resources in Val-d'Or, Quebec.
- The company has a large land position in the prolific Abitibi gold belt of Quebec
Probe Metals is a well-funded Canadian gold explorer advancing its flagship Val-d'Or East project located in Quebec. A preliminary economic assessment shows the project could have average annual production of 207,000 ounces of gold over a 12.5 year mine life with an after-tax NPV of C$598 million and IRR of 32.8% at a gold price of US$1,500 per ounce. The company plans a 162,000-meter drill program in 2022, its largest to date, to focus on expanding resources and converting inferred resources to the measured and indicated categories to support further studies.
Probe Metals is a well-funded Canadian gold explorer advancing its Val-d'Or East project in Quebec. A preliminary economic assessment shows the project could have a 12.5 year mine life producing over 200,000 ounces of gold per year on average with an after-tax NPV of C$598 million and IRR of 32.8% at a gold price of US$1,500. The Val-d'Or East project hosts over 1.8 million ounces of gold in the measured and indicated categories and has significant potential for further resource growth.
The document summarizes a corporate presentation for Probe Metals Inc., a well-funded Canadian gold explorer. Key points include:
- A preliminary economic assessment shows the Val-d'Or East project could have a 12.5 year mine life producing over 207,000 ounces of gold per year on average with a pre-tax NPV of $991 million and IRR of 47.2%.
- Val-d'Or East has over 1.8 million ounces of gold in the measured and indicated categories and 2.3 million ounces in inferred, making it one of the largest gold resources in the Val-d'Or district.
- The company has consolidated a large land position in the prolific A
The document is a corporate presentation for Probe Metals Inc., a Canadian gold explorer. It summarizes that:
1) A preliminary economic assessment showed the Val-d'Or East project could have a 12.5 year mine life producing an average of 207,000 ounces of gold per year with a post-tax NPV of C$598 million and IRR of 32.8% at a gold price of US$1,500 per ounce.
2) Recent drilling has increased the gold resource at Val-d'Or East to over 1.8 million ounces in the measured and indicated categories and 2.3 million ounces in inferred, making it one of the largest gold resources in the Val-d
The document provides an update on the Blackwater gold project, including results from a preliminary economic assessment (PEA). Some key highlights from the PEA include an after-tax IRR of 14-26% depending on gold price assumptions, a 5-year payback period, average annual gold production of 569,000 ounces in the first 5 years at total cash costs of $467/ounce, and estimated development capital costs of $1.8 billion including contingency. The results indicate solid economic potential for the project even at a long-term gold price of $1,275/ounce.
Detour Gold Corporation is an intermediate Canadian gold mining company with one operating mine, Detour Lake, located in northeastern Ontario. The presentation provides an overview of Detour Lake's operations and growth plans. Key points include:
- Detour Lake is a large, long-life asset with over 16 million ounces of gold reserves and expected production of 540,000-570,000 ounces annually over the next 20 years.
- Production and costs are expected to improve over the mine life as optimizations are implemented and economies of scale are realized. All-in sustaining costs are forecast to decline from $920-980 per ounce in 2016.
- The company is pursuing organic growth through projects like the proposed West
Corporate presentation merrill conference (barcelona) - may 14-16, 2013newgold2011
This document provides cautionary statements for a presentation on New Gold's mining operations and financial projections. It notes that statements regarding future performance are forward-looking and subject to risks and uncertainties outside the company's control. It also cautions that mineral resource estimates may not be economically viable. The document outlines New Gold's definitions for total cash costs and all-in sustaining cash costs as performance measures but notes they are non-IFRS and may not be comparable to other company's definitions.
This document provides an annual general and special meeting disclaimer and overview of Golden Star Resources Ltd. It summarizes that Golden Star is an established gold producer in Ghana with significant infrastructure that provides operational leverage. It is also developing brownfield projects that are expected to transform its production profile and deliver ounces at lower cash operating costs. The document introduces key management and the board of directors and their relevant experience in the mining industry.
BMO Global Metals & Mining Conference, FloridaDetourGold
- Detour Gold is a Canadian intermediate gold producer providing guidance for 2015 of 475-525 thousand ounces of gold production at total cash costs of $780-850 per ounce and all-in sustaining costs of $1,050-1,150 per ounce.
- Key targets for 2015 include improving the mining rate to 238,000 tonnes per day, mill throughput to 54,000 tonnes per day, and gold recovery to 91.5%.
- Planned sustaining capital expenditures are $90-100 million which is expected to generate $140-195 million in net cash flow for 2015 depending on gold prices.
This corporate presentation provides an overview of Detour Gold Corporation as Canada's next intermediate gold producer. Detour Gold's key asset is the Detour Lake Mine in Ontario, which has proven and probable reserves of 15.6 million ounces of gold. The presentation outlines Detour Gold's objectives to deliver strong operational performance at Detour Lake, generate positive cash flows, and use cash flows to fund future growth. Detour Gold has made solid progress in 2013 by achieving its first gold pour in February, reaching commercial production at Detour Lake in August, and producing over 150,000 ounces of gold in the first nine months of the year.
Corporate presentation november 2015 (1 on 1 meeting)newgold2011
The document is a corporate presentation from New Gold that outlines its investment thesis. It discusses New Gold's portfolio of assets in top-rated jurisdictions, its invested and experienced team, and its track record of being among the lowest-cost gold producers. It also highlights New Gold's peer-leading growth pipeline, which is expected to deliver around 8% production growth in 2015. The presentation notes that New Gold has a history of value creation and that its share price has outperformed industry indexes since 2009.
Randall Oliphant, Executive Chairman of New Gold Inc., provided an overview of the company's 2012 third quarter results in a webcast on November 1, 2012. The presentation included cautionary statements about forward-looking information and estimates of mineral resources. New Gold reported its financial and operating results in US dollars and defined terms related to costs and preliminary economic assessments, as required by applicable standards and regulations in Canada.
- The document is a presentation from New Gold Inc. summarizing the company's second quarter 2014 results.
- Key highlights include gold production of 89,460 ounces at total cash costs of $251/oz and all-in sustaining costs of $745/oz.
- The New Afton mill expansion remains on schedule for mid-2015. Engineering and permitting of the Rainy River and Blackwater projects are also advancing.
This corporate presentation provides an overview of New Gold Inc. It highlights the company's portfolio of assets located in top-rated mining jurisdictions. New Gold has a history of low-cost production and a growth pipeline that can potentially increase annual production by 900,000 ounces. The special New Afton asset in Canada has outperformed initial estimates and has potential to further increase through the C-zone extension and mill expansion.
Scotiabank Latin American Mining Conferencenewgold2011
This document provides cautionary statements for a mining conference presentation. It notes that all monetary amounts are in US dollars unless otherwise stated. It also contains forward-looking statements regarding expectations for the estimated mineral resources and reserves as well as ongoing cash flows and benefits of a transaction. Various risks and uncertainties are also outlined that could affect whether the forward-looking statements are realized. Technical information is also provided regarding the qualifications of individuals involved in evaluating the technical information presented.
This corporate presentation provides cautionary statements for forward-looking information and estimates of resources. It notes that all monetary amounts are in US dollars unless otherwise stated. It also cautions that forward-looking statements involve known and unknown risks that may cause actual results to differ from expectations. In addition, it provides context for terms used to classify mineral resources under Canadian standards which may not be comparable to classifications under US standards.
2015 q3 earnings webcast v final (webcast)newgold2011
This document provides a summary of New Gold's third quarter 2015 results webcast. It discusses the following key points:
- Production results for the third quarter including 122,580 ounces of gold produced at total cash costs of $495 per ounce and all-in sustaining costs of $788 per ounce.
- Financial results for the third quarter and year-to-date including operating margin of $72 million, adjusted net loss of $9 million, and net cash generated from operations before changes in working capital of $58 million.
- Recent corporate developments that improved New Gold's financial position including the sale of a stream on Rainy River for $175 million and the sale of 30% interest in the El
This corporate presentation from New Gold provides the following key information in 3 sentences:
New Gold has a portfolio of assets located in top-rated mining jurisdictions, including Canada, the United States, Mexico, Chile, and Australia. New Gold is a low-cost producer with peer-leading all-in sustaining costs of $754 per ounce in the first nine months of 2014 and expects costs to decrease to $825-835 per ounce for the full year. New Gold's growth pipeline is expected to increase annual production potential by approximately 900,000 ounces per year from the development of the Rainy River and Blackwater projects and expansion of operations at New Afton.
New Gold is a mid-tier gold mining company with a portfolio of assets in top-rated mining jurisdictions. It has 18.5 million ounces of gold reserves across 7 operating mines and development projects. New Gold has a track record of low-cost production and plans to increase annual production to nearly 900,000 ounces through projects at Rainy River and Blackwater. The company is led by an experienced board and management team that has collectively invested over $80 million in New Gold.
RBC Global Mining & Materials Conferencenewgold2011
- The document discusses New Gold's portfolio of mining assets located in top-rated jurisdictions for mining investment including Canada, the United States, Mexico, Chile, and Australia.
- It provides details on the mine life at each of New Gold's operating and development projects ranging from 2 to 17 years.
- The document contains cautionary statements regarding the use of forward-looking information and the risks and uncertainties inherent in the mining industry.
Denver corporate presentation - september 2015newgold2011
New Gold hosted a Denver Gold Forum in September 2015 that included cautionary statements about forward-looking information in the presentation. The presentation outlined New Gold's investment thesis of having a portfolio of assets in top-rated jurisdictions, an experienced and invested team, being among the lowest-cost producers with an established track record, and having a peer-leading growth pipeline. Recent developments highlighted transactions that increased New Gold's liquidity by $240 million and eliminated $93 million in debt, including a $175 million gold and silver stream on Rainy River production and the sale of a 30% interest in the El Morro project to Goldcorp.
New Gold Corporate Presentation - BAML May 2014newgold2011
New Gold provides its 2014 consolidated guidance, forecasting gold production of 380-420 thousand ounces at total cash costs of $320-$340 per ounce and all-in sustaining costs of $815-$835 per ounce. The company expects copper production of 1.35-1.75 million pounds and silver production of 92-100 thousand ounces. New Gold highlights that its costs are among the lowest for gold producers and are expected to generate over $200 per ounce of incremental margin compared to industry peers.
The document provides cautionary statements regarding forward-looking information in the corporate presentation. It notes that statements regarding future financial performance, projects, plans and estimates are forward-looking. It outlines risks and uncertainties that could cause actual results to differ from expectations, including operational disruptions, inaccurate estimates, fluctuating commodity prices and exchange rates, lack of funding, legal and political challenges, and other permitting, economic, social and technical factors. Forward-looking statements are based on certain estimates and assumptions, and are subject to known and unknown risks and uncertainties, which could cause actual results to differ materially from expectations.
The document summarizes a tour of New Gold's New Afton mine project in Kamloops, British Columbia on September 22-23, 2010. It includes cautionary statements regarding the use of forward-looking information and non-GAAP measures in the document. Key details provided include that the document contains forward-looking information about New Gold's future financial and operating performance, defines how New Gold calculates total cash costs per ounce, and notes that the technical information was prepared under the supervision of a qualified person.
This document provides cautionary statements regarding forward-looking information in the context of a mining conference presentation by New Gold. It notes that all monetary amounts are in US dollars unless otherwise stated. It cautions that forward-looking statements involve known and unknown risks and uncertainties that may cause actual results to differ materially. It also provides additional cautionary notes regarding the use of terms like "resources" and "reserves" as defined under Canadian standards. The document concludes by stating that the technical information has been reviewed by a qualified person at New Gold.
New gold announcement presentation - v finalnewgold2011
This document provides cautionary statements regarding forward-looking information in a proposed acquisition by New Gold of Rainy River. It notes that all monetary amounts are in Canadian dollars unless otherwise stated. It also contains details on the qualifications of individuals involved in the technical disclosure and outlines the parameters used to estimate Rainy River's mineral reserves and resources.
- New Gold reported first quarter 2014 results with gold production of 91,317 ounces at an all-in sustaining cost of $674 per ounce.
- New Afton mine achieved record quarterly gold and copper production of 27,364 ounces of gold and 22 million pounds of copper.
- The company generated $81 million in net cash from operations and increased its cash balance to $438 million.
- New Gold is advancing projects including the planned expansion at New Afton, development of the Rainy River project, and exploration at its properties to fuel production growth.
2013 fourth quarter and year end webcastv finalnewgold2011
The document summarizes New Gold's 2013 fourth quarter and full-year results. It notes that the fourth quarter was their highest gold production quarter of 2013 and they achieved their lowest total cash costs in company history for the full year. For the fourth quarter, they generated $93 million in adjusted net cash from operations. For the full year, they achieved their lowest annual total cash costs in history and generated $249 million in adjusted net cash from operations.
- The corporate presentation provides an overview of New Gold Inc., including highlights of its portfolio of mining assets located in top-rated jurisdictions, its investment thesis, and forward-looking production and cost guidance.
- New Gold has a portfolio of assets in Canada, the United States, and Mexico, including the Rainy River and Blackwater projects which have the potential to add over 300koz to annual gold production.
- Key aspects of New Gold's investment thesis are its majority of gold reserves located in Canada, low-cost production profile, and a peer-leading growth pipeline including the fully-funded Rainy River project.
- The document is a corporate presentation from May 2016 that contains cautionary statements about forward-looking information.
- It warns that statements regarding future financial performance, projects, activities, and expectations are forward-looking and subject to risks and uncertainties that could cause actual results to differ materially.
- The presentation outlines numerous risk factors that could affect the company's projections including economic, geological, permitting, environmental, social, regulatory, political, and financial risks.
Print version (td) corporate presentation - january 2014newgold2011
New Gold presented at the 2014 TD Securities Mining Conference in January. The presentation provided an overview of New Gold's portfolio of assets located in top-rated mining jurisdictions, its experienced management team with significant investments in the company, and its track record of low-cost production and organic growth. New Gold also highlighted the potential of its development projects Rainy River and Blackwater to significantly increase annual gold production.
The document cautions readers that certain information in the presentation regarding New Gold's future performance are forward-looking statements that are based on estimates and assumptions that are subject to risks and uncertainties. It provides context for forward-looking production, cost, and capital expenditure guidance. The document also lists key assumptions underlying the forward-looking statements and outlines risk factors that could materially affect actual results.
The document discusses cautionary statements regarding forward-looking information in the presentation. It notes that all statements other than historical facts are considered forward-looking and lists important risks and assumptions. It cautions readers that actual results could differ materially from what is forecasted. The document also provides an overview of New Gold's experienced management team and high quality asset portfolio located in top-rated mining jurisdictions.
The document is a corporate presentation from New Gold that outlines its investment thesis. It discusses New Gold's portfolio of assets in top-rated jurisdictions, its invested and experienced team, and its track record of being among the lowest-cost gold producers. It also highlights New Gold's peer-leading growth pipeline, which is expected to deliver around 8% production growth in 2015. The presentation notes that New Gold has a history of value creation and that its share price has outperformed industry indexes since 2009.
The document is a corporate presentation from New Gold that outlines its investment thesis. It discusses New Gold's portfolio of assets in top-rated jurisdictions, its invested and experienced team, and its track record of being among the lowest-cost gold producers. It also highlights New Gold's peer-leading growth pipeline, which is expected to deliver around 8% production growth in 2015. The presentation emphasizes New Gold's history of value creation and outperforming the market, noting its share price has outperformed the S&P/TSX Global Gold Index by over 90% since 2009.
Corporate presentation september 2016 v finalnewgold2011
- The document is a corporate presentation from New Gold that outlines cautionary statements regarding forward-looking information.
- It notes that statements in the presentation that address events, results, outcomes or developments that New Gold expects to occur are forward-looking statements which are based on certain assumptions and are subject to risks and uncertainties.
- It lists numerous risks and uncertainties that could cause actual results to differ materially from expectations, including risks related to prices, currency fluctuations, estimates, permitting, political and legal factors, and other operational risks.
Print version (cibc) corporate presentation - january 2014newgold2011
- The document is a presentation for an investor conference in January 2014 by New Gold.
- It provides an overview of New Gold's portfolio of assets in top-rated mining jurisdictions, experienced management team, low-cost production profile, and peer-leading growth pipeline.
- New Gold has organic growth projects that could increase annual production by over 2 times current levels through the development of Rainy River and Blackwater in Canada.
Print version (cibc) corporate presentation - january 2014newgold2011
The document is a presentation for CIBC Whistler 2014 Investor Conference in January 2014. It provides cautionary statements regarding forward-looking information in the presentation and outlines New Gold's investment thesis of having a portfolio of assets in top-rated jurisdictions, an invested and experienced management team, being among the lowest cost producers with a solid track record, and having a peer-leading growth pipeline and a history of value creation.
Barclays print version corporate presentation - march 2014 v finalnewgold2011
1) The document discusses New Gold's portfolio of assets located in top-rated mining jurisdictions and its peer-leading growth pipeline.
2) New Gold provides guidance for 2014 of 380-420koz of gold production at all-in sustaining costs of $815-835/oz.
3) The growth pipeline includes the Rainy River and Blackwater projects which could add over 900koz of annual production.
Print version corporate presentation - may 2014 v finalnewgold2011
This corporate presentation provides an overview of New Gold Inc., including:
- New Gold has a portfolio of assets located in top-rated mining jurisdictions, including Canada, the United States, Mexico, Chile, and Australia.
- In Q1 2014, New Gold achieved record production at its New Afton mine in Canada and had total cash costs of $254/oz and all-in sustaining costs of $674/oz.
- For 2014, New Gold guidance is for gold production of 380-420koz at total cash costs of $320-340/oz and all-in sustaining costs of $815-835/oz.
- The Rainy River gold project in Ontario, Canada is expected to begin production in mid-2017. Construction is currently 35% complete and $82 million was spent in the first quarter of 2016.
- The feasibility study estimates the project will have an after-tax NPV of $760 million, IRR of 15.3%, and payback period of 5.2 years, using a gold price of $1,200/oz. Average annual gold production is forecast at 325,000oz over the first 9 years at total cash costs of $570/oz and all-in sustaining costs of $670/oz.
- The project benefits from proximity to infrastructure in Canada's top-rated mining jurisdiction
New Gold provided a cautionary statement regarding forward-looking statements in their 2015 TD Securities Mining Conference presentation. The statement outlined important risk factors and uncertainties that could cause actual results to differ from expectations. It noted the reliance on assumptions around commodity prices, currency exchange rates, production estimates, cost estimates, permitting timelines, and other operational factors. The statement also highlighted risks including changes in economic conditions, variations in reserve and resource estimates, reliance on key personnel, and legal and regulatory challenges.
- The document is a corporate presentation from New Gold that provides cautionary statements regarding forward-looking information.
- It notes that statements regarding future financial performance, events, developments and operating parameters are forward-looking and that actual results could differ materially from expectations.
- Key risks to the forward-looking statements include uncertainties around estimates, commodity prices, exchange rates, permitting, political and economic factors, and other operational risks.
Corporate presentation january 2017 v finalnewgold2011
This corporate presentation provides cautionary statements regarding forward-looking information in the document. It notes that all dollar amounts are in US dollars unless otherwise stated. It also outlines key assumptions and risk factors that could cause actual results to differ from forward-looking statements. Forward-looking statements include production guidance, resource and reserve estimates, construction timelines and costs for the Rainy River project, and other operating parameters. These statements are based on certain material assumptions regarding the business, including around political and economic conditions, commodity prices, exchange rates, costs, and permitting. However, forward-looking statements are subject to risks and uncertainties that could cause actual results to differ from expectations.
Corporate presentation january 2017 v finalnewgold2011
This corporate presentation discusses Cautionary Statements regarding forward-looking information. It notes that all amounts are in US dollars unless otherwise stated. It provides definitions for forward-looking statements and notes that actual results may differ materially from expectations. It lists key assumptions underlying forward-looking statements including assumptions regarding operations, political/legal factors, resource/reserve estimates, exchange rates, prices, costs, permits/approvals, Indigenous group arrangements, feasibility studies, payments from Royal Gold, and 2016 cost guidance. It cautions that forward-looking statements are subject to risks/uncertainties that could cause actual results to differ.
- The document is a corporate presentation from New Gold that contains forward-looking statements and cautionary language regarding those statements.
- It discusses New Gold's portfolio of assets in top-rated jurisdictions including Canada, the US, Mexico, and Australia.
- The presentation provides highlights from 2015 including record gold production that exceeded guidance and lower than planned costs. It also outlines New Gold's growth pipeline and 2016 guidance.
The document provides a corporate presentation for New Gold Inc. It cautions readers that forward-looking statements are based on estimates and assumptions that may prove to be inaccurate. Some key points:
- New Gold is a Canadian-focused gold producer with over 90% of its 14.8 million ounces of gold reserves located in Canada.
- Its assets include the Rainy River mine in Canada, which began commercial production ahead of schedule and is expected to increase overall gold production by 30%.
- The company achieved its 2017 guidance ranges for gold and copper production and its estimates for development capital and all-in sustaining costs.
1. The document discusses New Gold's annual general meeting on April 25, 2018 and provides cautionary statements about forward-looking information.
2. It summarizes New Gold's priorities in 2017 which included streamlining operations, advancing growth projects, enhancing financial flexibility, and delivering operational results while pursuing optimization at Rainy River.
3. The document outlines how New Gold transformed in 2017 through strengthening management, reducing costs, selling non-core assets, achieving commercial production at Rainy River on time and on budget, and increasing earnings and cash flow per share.
New gold presentation april 2018 v finalnewgold2011
New Gold provides a corporate presentation detailing its strategic pillars, assets, and 2018 guidance. The company's key priorities are focusing on long-term shareholder value through its Canadian assets, operational track record, growth opportunities including Rainy River and Blackwater, and enhancing financial flexibility with no debt due until 2022. New Gold expects 2018 production to grow 30% to a range of 525-595 thousand ounces of gold due to the addition of Rainy River, and for all-in sustaining costs to be $555-595 per ounce. Sustaining capital is expected to decrease significantly over the coming years as Rainy River's costs revert to normal levels.
New Gold provides a corporate presentation detailing its strategic pillars of being a Canadian focused gold producer with operational track record and growth opportunities. Key highlights include over 14.8 million ounces of gold reserves over 90% located in Canada, 2018 production guidance of 525,000 to 595,000 ounces of gold, and decreasing sustaining capital profile over coming years as Rainy River capital expenditures decrease after initial years of operations. The presentation also outlines New Gold's liquidity position and decreasing leverage ratio, indicating financial flexibility.
New gold presentation january 2018 v final (4)newgold2011
New Gold provides its 2018 corporate presentation, which includes the following key points:
- Guidance for 2018 production of 525-595koz gold and 75-85mlb copper, a 30% increase over 2017.
- Rainy River mine achieved commercial production ahead of schedule in November 2017 and is expected to produce 310-350koz gold in 2018.
- Blackwater remains the next flagship project in permitting with EA approval expected in mid-2018.
- The company has established an operational track record and focuses on long-term shareholder value through its portfolio of assets in top-rated jurisdictions in Canada and growth opportunities like Rainy River and Blackwater.
New gold presentation november 2017v finalnewgold2011
The corporate presentation provides cautionary statements regarding forward-looking information in the document. It notes that all dollar amounts are in US dollars unless otherwise stated, and that the presentation contains forward-looking statements regarding New Gold's future performance, including expectations for production, costs, and development activities. It cautions that these forward-looking statements are based on a number of assumptions and are subject to various risks and uncertainties, such that actual results could differ materially from expectations.
New gold presentation october 2017v finalnewgold2011
This corporate presentation outlines New Gold's strategic pillars and 2017 key objectives. New Gold's strategic pillars are being a Canadian focused gold producer with over 90% of its 14.7 million ounces of reserves located in Canada, having low-cost operations with anticipated all-in sustaining costs of $671 per ounce in the first half of 2017, and pursuing growth opportunities from projects that could provide around 800,000 ounces of annual combined production. New Gold's 2017 key objectives are to streamline its organizational structure and strengthen the Rainy River team, advance its organic growth projects, enhance its financial flexibility, deliver operationally and pursue cash flow optimization opportunities, and execute on its updated plan for the Rainy River project.
New gold denver gold forum september 24 27, 2017newgold2011
New Gold's corporate presentation outlines its strategic focus on long-term shareholder value creation through its Canadian assets, low-cost growth, and disciplined management of capital resources. Key points include advancing the Rainy River project, which began production in September 2017 and is on schedule, as well as long-term growth opportunities through projects like New Afton C-Zone, Blackwater, and Rimfire that provide a pipeline of development options. New Gold also maintains a strong liquidity position and recently restructured its debt for increased financial flexibility.
New gold presentation september 2017 v finalnewgold2011
This corporate presentation from September 2017 provides an overview of New Gold Inc., including:
- Cautionary statements regarding forward-looking information in the presentation.
- Key characteristics of New Gold's portfolio including 14.7 million ounces of gold reserves located primarily in Canada, low costs of $671 per ounce, and potential for 800,000 ounces of annual gold production from growth projects.
- Recent management and board appointments and changes, including a new Executive Vice President & CFO and Vice Presidents of Projects and Business Development, and a new board member. The previous CFO will remain until October 2017 to assist with the transition.
New gold presentation june 2017 v finalnewgold2011
This corporate presentation provides cautionary statements regarding forward-looking information and key characteristics of New Gold's portfolio. It discusses New Gold's assets in top-rated jurisdictions, including operating mines and development projects. New Gold has 14.7 million ounces of gold reserves, over 90% located in Canada. Its first quarter 2017 all-in sustaining costs were $597 per ounce. Growth projects have the potential to increase annual production to approximately 800,000 ounces.
New gold baml global metals, mining & steel conference 16 18 may 2017newgold2011
New Gold provides a corporate presentation outlining its portfolio of assets located in top-rated mining jurisdictions. The presentation cautions that statements regarding future performance are forward-looking in nature. New Gold has a diverse portfolio including operating mines and development projects with potential for 800,000 ounces of annual gold production. Key priorities for 2017 include executing on an updated plan for the Rainy River project in Ontario, Canada, advancing organic growth projects, and enhancing financial flexibility.
New gold presentation march 2017 v websitenewgold2011
The corporate presentation provides an overview of New Gold Inc., including:
- New Gold has a portfolio of assets in top-rated mining jurisdictions like Canada, the USA, Australia and Mexico.
- Their key growth project is the Rainy River mine in Ontario, Canada, which is expected to have an initial 14-year mine life upon achieving commercial production in late 2017.
- New Gold's priorities for 2017 include strengthening their team at Rainy River to ensure successful execution of the project, as well as pursuing opportunities to further optimize cash flow from their operating mines.
Corporate presentation november 2016 v finalnewgold2011
The document provides an overview of New Gold's corporate presentation from November 2016. It cautions readers that statements regarding future financial or operating performance are forward-looking. It notes key assets in top-rated jurisdictions including Rainy River, New Afton, Mesquite, and Peak Mines. Construction at Rainy River is currently 60% complete with $680 million spent to date and $365 million remaining. The presentation highlights third quarter 2016 results including 95,546 ounces of gold produced and $151 million in cash. New Gold's liquidity position includes $502 million in cash and an undrawn $276 million credit facility.
The document provides an agenda for an Investor Day presentation on February 18, 2016. The presentation agenda includes an overview of the gold market, a company update, an overview of New Gold, operational results and outlook for 2015 and 2016, mineral reserve updates, development of the Rainy River project, 2015 financial results, and a conclusion. The document also includes cautionary statements regarding forward-looking statements and information contained in the presentation.
- The corporate presentation discusses New Gold's portfolio of assets in top-rated jurisdictions including Canada, operational and financial results, and growth projects.
- New Gold has over 15 million ounces of gold reserves, with over 80% located in Canada. The company expects to increase annual gold production by around 800,000 ounces from its growth projects Rainy River and Blackwater.
- All-in sustaining costs for Q3 2015 were $788 per ounce, and the company aims to further strengthen its board, executive team, and shareholder value.
Rainy river site visit presentation v finalnewgold2011
The document provides details about a site visit to the Rainy River gold mine project in Ontario, Canada. It includes:
- An agenda for the site visit with presentations on geology, development plans, operations, and life of mine planning.
- An overview of the Rainy River project including reserves, production targets, costs, and timeline.
- Details on funding for the project including proceeds from a streaming deal and the project's financial analysis.
Encryption in Microsoft 365 - ExpertsLive Netherlands 2024Albert Hoitingh
In this session I delve into the encryption technology used in Microsoft 365 and Microsoft Purview. Including the concepts of Customer Key and Double Key Encryption.
UiPath Test Automation using UiPath Test Suite series, part 6DianaGray10
Welcome to UiPath Test Automation using UiPath Test Suite series part 6. In this session, we will cover Test Automation with generative AI and Open AI.
UiPath Test Automation with generative AI and Open AI webinar offers an in-depth exploration of leveraging cutting-edge technologies for test automation within the UiPath platform. Attendees will delve into the integration of generative AI, a test automation solution, with Open AI advanced natural language processing capabilities.
Throughout the session, participants will discover how this synergy empowers testers to automate repetitive tasks, enhance testing accuracy, and expedite the software testing life cycle. Topics covered include the seamless integration process, practical use cases, and the benefits of harnessing AI-driven automation for UiPath testing initiatives. By attending this webinar, testers, and automation professionals can gain valuable insights into harnessing the power of AI to optimize their test automation workflows within the UiPath ecosystem, ultimately driving efficiency and quality in software development processes.
What will you get from this session?
1. Insights into integrating generative AI.
2. Understanding how this integration enhances test automation within the UiPath platform
3. Practical demonstrations
4. Exploration of real-world use cases illustrating the benefits of AI-driven test automation for UiPath
Topics covered:
What is generative AI
Test Automation with generative AI and Open AI.
UiPath integration with generative AI
Speaker:
Deepak Rai, Automation Practice Lead, Boundaryless Group and UiPath MVP
Dr. Sean Tan, Head of Data Science, Changi Airport Group
Discover how Changi Airport Group (CAG) leverages graph technologies and generative AI to revolutionize their search capabilities. This session delves into the unique search needs of CAG’s diverse passengers and customers, showcasing how graph data structures enhance the accuracy and relevance of AI-generated search results, mitigating the risk of “hallucinations” and improving the overall customer journey.
Full-RAG: A modern architecture for hyper-personalizationZilliz
Mike Del Balso, CEO & Co-Founder at Tecton, presents "Full RAG," a novel approach to AI recommendation systems, aiming to push beyond the limitations of traditional models through a deep integration of contextual insights and real-time data, leveraging the Retrieval-Augmented Generation architecture. This talk will outline Full RAG's potential to significantly enhance personalization, address engineering challenges such as data management and model training, and introduce data enrichment with reranking as a key solution. Attendees will gain crucial insights into the importance of hyperpersonalization in AI, the capabilities of Full RAG for advanced personalization, and strategies for managing complex data integrations for deploying cutting-edge AI solutions.
Generative AI Deep Dive: Advancing from Proof of Concept to ProductionAggregage
Join Maher Hanafi, VP of Engineering at Betterworks, in this new session where he'll share a practical framework to transform Gen AI prototypes into impactful products! He'll delve into the complexities of data collection and management, model selection and optimization, and ensuring security, scalability, and responsible use.
In his public lecture, Christian Timmerer provides insights into the fascinating history of video streaming, starting from its humble beginnings before YouTube to the groundbreaking technologies that now dominate platforms like Netflix and ORF ON. Timmerer also presents provocative contributions of his own that have significantly influenced the industry. He concludes by looking at future challenges and invites the audience to join in a discussion.
Essentials of Automations: The Art of Triggers and Actions in FMESafe Software
In this second installment of our Essentials of Automations webinar series, we’ll explore the landscape of triggers and actions, guiding you through the nuances of authoring and adapting workspaces for seamless automations. Gain an understanding of the full spectrum of triggers and actions available in FME, empowering you to enhance your workspaces for efficient automation.
We’ll kick things off by showcasing the most commonly used event-based triggers, introducing you to various automation workflows like manual triggers, schedules, directory watchers, and more. Plus, see how these elements play out in real scenarios.
Whether you’re tweaking your current setup or building from the ground up, this session will arm you with the tools and insights needed to transform your FME usage into a powerhouse of productivity. Join us to discover effective strategies that simplify complex processes, enhancing your productivity and transforming your data management practices with FME. Let’s turn complexity into clarity and make your workspaces work wonders!
GraphSummit Singapore | The Future of Agility: Supercharging Digital Transfor...Neo4j
Leonard Jayamohan, Partner & Generative AI Lead, Deloitte
This keynote will reveal how Deloitte leverages Neo4j’s graph power for groundbreaking digital twin solutions, achieving a staggering 100x performance boost. Discover the essential role knowledge graphs play in successful generative AI implementations. Plus, get an exclusive look at an innovative Neo4j + Generative AI solution Deloitte is developing in-house.
zkStudyClub - Reef: Fast Succinct Non-Interactive Zero-Knowledge Regex ProofsAlex Pruden
This paper presents Reef, a system for generating publicly verifiable succinct non-interactive zero-knowledge proofs that a committed document matches or does not match a regular expression. We describe applications such as proving the strength of passwords, the provenance of email despite redactions, the validity of oblivious DNS queries, and the existence of mutations in DNA. Reef supports the Perl Compatible Regular Expression syntax, including wildcards, alternation, ranges, capture groups, Kleene star, negations, and lookarounds. Reef introduces a new type of automata, Skipping Alternating Finite Automata (SAFA), that skips irrelevant parts of a document when producing proofs without undermining soundness, and instantiates SAFA with a lookup argument. Our experimental evaluation confirms that Reef can generate proofs for documents with 32M characters; the proofs are small and cheap to verify (under a second).
Paper: https://eprint.iacr.org/2023/1886
In the rapidly evolving landscape of technologies, XML continues to play a vital role in structuring, storing, and transporting data across diverse systems. The recent advancements in artificial intelligence (AI) present new methodologies for enhancing XML development workflows, introducing efficiency, automation, and intelligent capabilities. This presentation will outline the scope and perspective of utilizing AI in XML development. The potential benefits and the possible pitfalls will be highlighted, providing a balanced view of the subject.
We will explore the capabilities of AI in understanding XML markup languages and autonomously creating structured XML content. Additionally, we will examine the capacity of AI to enrich plain text with appropriate XML markup. Practical examples and methodological guidelines will be provided to elucidate how AI can be effectively prompted to interpret and generate accurate XML markup.
Further emphasis will be placed on the role of AI in developing XSLT, or schemas such as XSD and Schematron. We will address the techniques and strategies adopted to create prompts for generating code, explaining code, or refactoring the code, and the results achieved.
The discussion will extend to how AI can be used to transform XML content. In particular, the focus will be on the use of AI XPath extension functions in XSLT, Schematron, Schematron Quick Fixes, or for XML content refactoring.
The presentation aims to deliver a comprehensive overview of AI usage in XML development, providing attendees with the necessary knowledge to make informed decisions. Whether you’re at the early stages of adopting AI or considering integrating it in advanced XML development, this presentation will cover all levels of expertise.
By highlighting the potential advantages and challenges of integrating AI with XML development tools and languages, the presentation seeks to inspire thoughtful conversation around the future of XML development. We’ll not only delve into the technical aspects of AI-powered XML development but also discuss practical implications and possible future directions.
GDG Cloud Southlake #33: Boule & Rebala: Effective AppSec in SDLC using Deplo...James Anderson
Effective Application Security in Software Delivery lifecycle using Deployment Firewall and DBOM
The modern software delivery process (or the CI/CD process) includes many tools, distributed teams, open-source code, and cloud platforms. Constant focus on speed to release software to market, along with the traditional slow and manual security checks has caused gaps in continuous security as an important piece in the software supply chain. Today organizations feel more susceptible to external and internal cyber threats due to the vast attack surface in their applications supply chain and the lack of end-to-end governance and risk management.
The software team must secure its software delivery process to avoid vulnerability and security breaches. This needs to be achieved with existing tool chains and without extensive rework of the delivery processes. This talk will present strategies and techniques for providing visibility into the true risk of the existing vulnerabilities, preventing the introduction of security issues in the software, resolving vulnerabilities in production environments quickly, and capturing the deployment bill of materials (DBOM).
Speakers:
Bob Boule
Robert Boule is a technology enthusiast with PASSION for technology and making things work along with a knack for helping others understand how things work. He comes with around 20 years of solution engineering experience in application security, software continuous delivery, and SaaS platforms. He is known for his dynamic presentations in CI/CD and application security integrated in software delivery lifecycle.
Gopinath Rebala
Gopinath Rebala is the CTO of OpsMx, where he has overall responsibility for the machine learning and data processing architectures for Secure Software Delivery. Gopi also has a strong connection with our customers, leading design and architecture for strategic implementations. Gopi is a frequent speaker and well-known leader in continuous delivery and integrating security into software delivery.
Observability Concepts EVERY Developer Should Know -- DeveloperWeek Europe.pdfPaige Cruz
Monitoring and observability aren’t traditionally found in software curriculums and many of us cobble this knowledge together from whatever vendor or ecosystem we were first introduced to and whatever is a part of your current company’s observability stack.
While the dev and ops silo continues to crumble….many organizations still relegate monitoring & observability as the purview of ops, infra and SRE teams. This is a mistake - achieving a highly observable system requires collaboration up and down the stack.
I, a former op, would like to extend an invitation to all application developers to join the observability party will share these foundational concepts to build on:
GraphSummit Singapore | The Art of the Possible with Graph - Q2 2024Neo4j
Neha Bajwa, Vice President of Product Marketing, Neo4j
Join us as we explore breakthrough innovations enabled by interconnected data and AI. Discover firsthand how organizations use relationships in data to uncover contextual insights and solve our most pressing challenges – from optimizing supply chains, detecting fraud, and improving customer experiences to accelerating drug discoveries.
Securing your Kubernetes cluster_ a step-by-step guide to success !KatiaHIMEUR1
Today, after several years of existence, an extremely active community and an ultra-dynamic ecosystem, Kubernetes has established itself as the de facto standard in container orchestration. Thanks to a wide range of managed services, it has never been so easy to set up a ready-to-use Kubernetes cluster.
However, this ease of use means that the subject of security in Kubernetes is often left for later, or even neglected. This exposes companies to significant risks.
In this talk, I'll show you step-by-step how to secure your Kubernetes cluster for greater peace of mind and reliability.
2. Cautionary statements
All monetary amounts in U.S. dollars unless otherwise stated
Total cash costs shown net of by -product sales unless otherwise stated
CAUTIONARY NOTE REGARDING FORWARD-LOOKING STATEMENTS
Certain inf ormation contained in this presentation, including any inf ormation relating to New Gold’s f uture f inancial or operating perf ormance as well as inf ormation respecting Rainy Riv er and its assets,
may be deemed “f orward looking”. All statements in this presentation, other than statements of historical f act that address ev ents or dev elopments that New Gold expects to occur, are “f orward-looking
statements”. Forward-looking statements are statements that are not historical f acts and are generally , but not alway s, identif ied by the use of f orward-looking terminology such as “plans”, “expects”, “is
expected”, “budget”, “scheduled”, “estimates”, “f orecasts”, “intends”, “anticipates”, “projects”, “potential”, “believ es” or v ariations of such words and phrases or statements that certain actions, ev ents or
results “may ”, “could”, “would”, “should”, “might” or “will be taken”, “occur” or “be achiev ed” or the negativ e connotation. Without limiting the f oregoing, examples of f orward-looking inf ormation in this
presentation include, among others, statements with respect to: New Gold’s guidance f or production, cash costs, all-in sustaining costs, expenditures and cash f lows, modif ications to operations, the
timing of dev elopment decisions, the estimation of mineral reserv es and resources and the realization of mineral reserv es and resources, the timing and amount of estimated f uture production (including
mining and milling rates), the expected lif e of New Gold’s mines, expected f uture production costs (including cash costs) and the timing of completion of the acquisition of Rainy Riv er.
All such f orward-looking statements are based on the reasonable opinions and estimates of management as of the date such statements are made and are subject to important risk f actors and
uncertainties, many of which are bey ond New Gold’s ability to control or predict. Forward-looking statements are necessarily based on estimates and assumptions. In addition to assumptions specif ically
identif ied in this presentation, the key assumptions and estimates are discussed in New Gold’s most recent interim management discussion and analy sis and technical reports f iled at www.sedar.com.
The estimates and assumptions upon which the f orward-looking statements in this presentation are based are inherently subject to known and unknown risks, uncertainties and other f actors that may
cause actual results, lev el of activ ity, perf ormance or achiev ements to be materially dif f erent from those expressed or implied by such f orward-looking statements. Such f actors include, without limitation:
signif icant capital requirements; price v olatility in the spot and f orward markets f or commodities; f luctuations in the international currency markets and in the rates of exchange of the currencies of Canada,
the United States, Australia, Mexico and Chile; impact of any hedging activ ities, including margin limits and margin calls; discrepancies between actual and estimated production, between actual and
estimated Reserv es and Resources and between actual and estimated metallurgical recov eries; changes in national and local gov ernment legislation in Canada, the United States, Australia, Mexico and
Chile or any other country in which New Gold currently or may in the f uture carry on business; taxation; controls, regulations and political or economic dev elopments in the countries in which New Gold
does or may carry on business; the speculativ e nature of mineral exploration and dev elopment, including the risks of obtaining and maintaining the v alidity and enf orceability of the necessary licences and
permits and comply ing with the permitting requirements of each jurisdiction in which New Gold operates, including, but not limited to: in Canada, obtaining the necessary permits f or Blackwater and the
Rainy Riv er Gold Project; in Mexico, where Cerro San Pedro has a history of ongoing legal challenges related to our env ironmental authorization (EIS); and in Chile, where the courts hav e temporarily
suspended the approv al of the env ironmental permit f or El Morro; the lack of certainty with respect to f oreign legal sy stems, which may not be immune f rom the inf luence of political pressure, corruption or
other f actors that are inconsistent with the rule of law; the uncertainties inherent to current and f uture legal challenges N ew Gold is or may become a party to; diminishing quantities or grades of Reserv es;
competition; loss of key employ ees; additional f unding requirements; rising costs of labour, supplies, f uel and equipment; actual results of current exploration or reclamation activ ities; uncertainties
inherent to mining economic studies including the PEA f or Blackwater and the Rainy Riv er Feasibility Study f or the Rainy River Gold Project; changes in project parameters as plans continue to be
ref ined; accidents; labour disputes; def ectiv e title to mineral claims or property or contests ov er claims to mineral properties; New Gold may be unable to successf ully complete the acquisition of all of the
securities of Rainy Riv er or the completion of such acquisition may be delay ed or more costly than anticipated; uncertainties with respect to the successf ul integration of the business of Rainy Riv er within
the business of New Gold; unexpected delay s and costs inherent to consulting and accommodating rights of First Nations; and uncertainties with respect to obtaining all necessary surf ace rights f or the
Rainy Riv er Project. In addition, there are risks and hazards associated with the business of mineral exploration, dev elopment and mining, including env ironmental ev ents and hazards, industrial
accidents, unusual or unexpected f ormations, pressures, cav e-ins, f looding and gold bullion losses (and the risk of inadequate insurance or inability to obtain insurance to cov er these risks) as well as
“Risk Factors” included in New Gold’s (and, in respect to inf ormation related to the acquisition of Rainy Riv er Resources Ltd. (“Rainy Riv er”), Rainy River and/or the Rainy Riv er Gold Project, in Rainy
Riv er’s) disclosure documents f iled on and av ailable at www.sedar.com. Forward-looking statements are not guarantees of f uture perf ormance, and actual results and f uture ev ents could materially dif f er
f rom those anticipated in such statements. All of the f orward-looking statements contained in this presentation are qualif ied by these cautionary statements. New Gold expressly disclaims any intention or
obligation to update or rev ise any f orward-looking statements whether as a result of new inf ormation, ev ents or otherwise, except in accordance with applicable securities laws.
All f ootnotes and endnotes hav e been shown at the conclusion of the presentation.
2
4. Portfolio of assets in top-rated jurisdictions
Blackwater
New Afton
Rainy River
Mesquite
Cerro San Pedro
El Morro
Peak Mines
Mine Life: 15+ years
Mine Life: 14 years
Mine Life: 15+ years
Mine Life: 10+ years
Mine Life: 4+ years
Mine Life: 17 years
Mine Life: 8 years
#2
CANADA
#6
UNITED
STATES
#5
MEXICO
#3
CHILE
#1
AUSTRALIA
OPERATING
DEVELOPMENT
4
Mining investment – country rankings(1)
(1) Rankings based on 25 countries evaluated in 2013 Behre Dolbear Report – 2013 Ranking of Countries for Mining Investment: “Where Not to Invest”.
5. Portfolio of assets in top-rated jurisdictions
Growing gold resource base in Canada
18.0 Canada
5.7 USA
2.9 Chile
1.7 Mexico 0.9 Australia
GOLD RESERVES (Moz)
7.8
11.8
23.1
29.2
GOLD M&I RESOURCES (Moz) (1)(2)
NEW GOLD PRO FORMA GOLD M&I
RESOURCES (Moz) (1)
+44%
per share
+20%
per share
=
Canada
=
= +62%
• 18 million ounces in Canada
• 84% increase in M&I resources per share
since 2009
New Gold New Gold &
Rainy River(3)
New Gold New Gold &
Rainy River(3)
5
(1) Measured and Indicated Resources inclusive of Reserves.
6. Invested and experienced team
Collectively ~$85 million invested in New Gold
6
Randall Oliphant Executive Chairman
Robert Gallagher President & CEO
Brian Penny Executive VP & CFO
Ernie Mast VP Operations
EXECUTIVE MANAGEMENT TEAM BOARD OF DIRECTORS
David Emerson Former Canadian Cabinet Minister
James Estey Former Chairman,
UBS Securities Canada
Robert Gallagher President & CEO
Vahan Kololian Founder, Terra Nova Partners
Martyn Konig Former Executive Chairman,
European Goldfields
Pierre Lassonde Chairman, Franco-Nevada
Randall Oliphant Executive Chairman
Raymond Threlkeld Mining Consultant
Significantly invested team
7. Among lowest-costproducers with established track record(1)
• Generating ~$200 per ounce
incremental margin
• More than $100 per ounce decrease
in cash costs(2) from 2009 to 2013E
• Copper and silver create effective hedge
2013 GUIDANCE –
ALL-IN SUSTAINING COSTS ($/OZ)(3)
New Gold Mid-Tier
Average(4)
Senior Average(5)
$875
~$1,050
~$1,100
7
Lower costs driving margin expansion
8. 2012 ACTUAL
Gold production
412 Koz
Gold production(1)
440–480 Koz
2013 GUIDANCE
2013
Total cash costs(2)
~$350/oz
2013
All-in sustaining
costs(2)(3)
~$875/oz
8
Among lowest-costproducers with established track record(1)
By-product price assumptions: Copper ~$3.25 per pound; Silver ~$22.50 per ounce.
2013 GUIDANCE
9. New Afton hitting its stride
• Mining and milling rates averaged
more than 11,000 tonnes per day
in Q2 – a 19% increase over Q1
• Targeting throughput of 12,000
tonnes per day by year-end 2013
GOLD
0.67
0.78
Q1 2013 Q2 2013
COPPER
0.79%
0.96%
Q1 2013 Q2 2013
GRADE (g/t) GRADE (%)
83%
87%
Q1 2013 Q2 2013
81%
88%
Q1 2013 Q2 2013
RECOVERY (%) RECOVERY (%)
15
22
Q1 2013 Q2 2013
12
19
Q1 2013 Q2 2013
PRODUCTION (Koz) PRODUCTION (Mlbs)
+16%
+4%
+46%
+21%
+7%
+58%
9
Among lowest-costproducers with established track record(1)
10. Evaluating further throughput expansion potential
10
Among lowest-costproducers with established track record(1)
Design capacity • 11,000 tonnes perday
2013 year-endtarget • 12,000 tonnes per day
Additionalexpansion
potential
• 50 drawbells needed to support 11,000tonnes per day – 68 completed
as of mid-2013
• Crusher capacity – 20,000 tonnes per day (commissioned January 2013)
• Conveyor capacity – 14,500 tonnes per day
• Record daily mill throughput – 18,638 tonnes
11. New Afton C-Zone exploration program
EA-9
C-Zone
B-Zone
Reserve
4,900m
Far East Extension /
Hanging Wall Lens
Targets
Drilled
Planned
EA-31
EA-32
EA-34
EA-36
EA-35
EA-37*
EA-33
HIGHLIGHTS POST C-ZONE RESOURCE UPDATE
Drill
Hole
From
(m)
To
(m)
Interval
(m)
Gold
(g/t)
Copper
(%)
EA-31 644 708 64 0.86 1.33
EA-32 478 622 144 0.92 1.10
EA-34 744 810 66 0.90 0.93
EA-36 592 678 86 2.32 2.61
11
Among lowest-costproducers with established track record(1)
• May 2013 update increased
resources by more than 300%
• C-Zone remains open down plunge
C-ZONE RESOURCE SUMMARY
Measured and
Indicated
Inferred
GOLD 0.3 Moz at 0.77 g/t 0.4 Moz at 0.62 g/t
COPPER 211 Mlbs at 0.77 301 Mlbs at 0.68%
12. New Afton successful start with continued upside potential
• Achieved commercial and full production
ahead of schedule in mid-2012
• 2012 exploration work led to two-year
mine life extension from 12 to 14 years
• +300% increase in C-Zone resources in
May 2013
• Targeting throughput of 12,000 tonnes per
day by end of 2013
• Evaluating potential for further throughput
increases in 2014 and beyond
12
Among lowest-costproducers with established track record(1)
13. Peer-leading growth pipeline
Industry leading organic growth profile
• Growth projects expected to increase gold
production by ~1.75 times over current
operations
• Blackwater and Rainy River acquisitions
increased shares outstanding by 25% for
potential +150% increase in production
• Projecting below current industry
average cash costs at each project
Four current
operations
Three organic
projects
440–480 Koz
+800 Koz
Blackwater
Rainy River
2013 Gold
Production Guidance
Annual Production
Potential of Growth Assets
El Morro
13
14. Peer-leading growth pipeline
Three world-class projects
Rainy River (97%) Blackwater El Morro (30%)
Significant Gold
Resource Base(1)(2) 6.2 Moz 8.6 Moz 2.9 Moz
Exploration
Potential
Intrepid Zone/Multiple
Regional Targets
Capoose/Multiple
Regional Targets
El Morro Zone/
Block Cave Potential
Jurisdiction Ontario, Canada British Columbia, Canada Chile
Robust Production/
Low Cash Costs(3)
~225 Koz at below
average cash costs
~500 Koz at below
average cash costs
~90 Koz Au/85 Mlbs Cu at
~($700) cash costs(4)
RAINY RIVER BLACKWATER EL MORRO
14
15. Peer-leading growth pipeline
Control of two underexplored districts
• +169 km2 land package
• Multiple targets
including recently
discovered Intrepid Zone
• Two drills active
15
RAINY RIVER
Rainy River
Existing resource
Exploration targets
Intrepid
Intrepid extension
Son of Intrepid
Western Zone
Off Lake
5km
16. Peer-leading growth pipeline
Control of two underexplored districts
• +1,000 km2 land
package
• Initial resource at
Capoose ~25 km from
main Blackwater
resource
• Multiple regional targets
• Five drills active
16
BLACKWATER
Blackwater
Capoose
Auro
Van Tine Fawnie
Existing resource
Exploration targets
10km
17. Peer-leading growth pipeline
Limited capital required to advance projects to construction-ready status
• Simultaneously advancing Rainy River and Blackwater through remaining technical
and economic studies and permitting
• Regional exploration continues at both projects
• Project development and sequencing decision expected in second half of 2014
RAINY RIVER SECOND HALF 2013
PROJECT SPENDING(1)
BLACKWATER SECOND HALF 2013
PROJECT SPENDING(2)
Exploration(3)
$5mm
Engineering/Studies/
Environment/Other
$20mm
Exploration(3)
$20mm
Engineering/Studies/
Environment/Other
$30mm
17
18. (39%) (27%)
(14%)
45%
303%
A history of value creation
Increasing Net Asset Value drives share price growth
March 2009
Net Asset Value(1)
September 2013
Mesquite, Cerro San Pedro, Peak Mines
~$875 $1,138
New Afton
~$120 $1,561
El Morro(2)
~$40 $432
Blackwater(3)
$– $808
Rainy River(4)
$– $479
18
S&P/TSX Global
Gold Index
FTSE Gold
Mines Index
HUI
Index
Gold Price New Gold
PRICE PERFORMANCE SINCE BUSINESS COMBINATION WITH
WESTERN GOLDFIELDS IN MARCH 2009
19. A history of value creation
Near-term catalysts
2013 guidance – increased resources, production growth and lower costs
Blackwater resource update
New Afton C-Zone exploration update
Completion of Rainy River acquisition
Blackwater/Rainy River/New Afton exploration updates
Completion of Blackwater Feasibility Study
New Afton mill to reach 12,000 tonnes per day/results of throughput increase evaluation
Resolution of El Morro temporary permit suspension
19
20. Establishing the leading
intermediate gold company
New Gold investment thesis
Portfolio
of assets
in top-rated
jurisdictions
Invested
and
experienced
team
Among
lowest-cost
producerswith
a history of
delivering
Peer-leading
growth
pipeline
Track record
of value
creation
21. Appendix
21
Appendices
Page
1. Financial information 22
2. Consolidated operating performance 28
3. Mesquite, Cerro San Pedro, Peak Mines 37
4. New Afton 41
5. Rainy River 45
6. Blackwater 47
7. El Morro 55
8. Reserves and resource notes 62
9. Commodity price/foreign exchange assumptions 69
22. Capitalization and liquidity
22
1. Cash and equivalents as at June 30, 2013.
2. $50 million of total $150 million currently used for Letters of Credit.
3. See Appendix 1 – Summary of debt for detailed breakdown of components of debt.
• All corporate debt due in 2020
or beyond(3)
• Two senior unsecured note offerings
during 2012 ($300 million at 7.00%,
$500 million at 6.25%)
• Total common shares outstanding of
502 million
• Paid $66 million to eliminate legacy
gold hedges on May 15, 2013
Liquidity
Position
$563mm
$100mm
$663mm
Appendix 1
Cash and
Equivalents(1)
Undrawn Credit
Facility(2)
23. Summary of debt
23
Undrawn Credit
Facility
Senior Unsecured Notes
(April 2012)
Senior Unsecured Notes
(November 2012)
El Morro Funding
Loan
Face Value $150 million(1) $300 million $500 million $72 million
Maturity 1 year with annual
extensions permitted
April 15, 2020 November 15, 2022 n/a
Interest Rate See ‘Key features’ 7.00% 6.25% 4.58%
Payable Revolving credit Semi-annually Semi-annually Upon start of
production
Conversion price n/a n/a n/a n/a
Current trading value n/a ~102 ~96 n/a
Key features Normal financial
covenants
Interest Rate
• 3.00-4.25% over
LIBOR based on
ratios
• Standby fee of 0.75-
1.06%
• Senior unsecured
• Redeemable after April 15,
2016 at 103.5% down to
100% of face after 2018
• Unlimited dividends if
leverage ratio below 2:1
• Senior unsecured
• Redeemable after
November 15, 2017 at par
plus half coupon, declining
ratably to par
• Unlimited dividends if
leverage ratio below 2:1
New Gold to repay
Goldcorp out of
80% of its 30%
share of cash flow
once El Morro
starts production
1. $50 million currently allocated for Letters of Credit.
Appendix 1
24. 24
• New Gold’s 2013 estimated capital expenditures of $290 million are down 42% from 2012
• Capital includes costs related to ongoing annual sustaining capital as well as investments for
future production
• Capital estimates by site are shown below:
New Afton
$110mm
Peak Mines
$60mm
Cerro San Pedro
$40mm
Mesquite
$20mm
Blackwater
$60mm
New Afton
$302mm
Peak Mines
$47mm
Cerro San Pedro
$11mm
Mesquite
$11mm
Blackwater
$128mm
2012 and 2013 capital expenditures by site
TOTAL 2012 ACTUAL CAPITAL EXPENDITURES:
$499 MILLION
TOTAL 2013 CAPITAL EXPENDITURE ESTIMATE:
$290 MILLION
Appendix 1
25. 25
Direct investment for future production
• The below breaks down capital expenditures at each site into two categories – annual sustaining
capital and direct investments for future productiongrowth and mine life extension
New Afton - $110 million
Blackwater - $60 million
Peak Mines - $60 million
Annual sustaining capital
82%
18%
100%
50% 50%
• $90 million – continued cave and drawbell developmentas well as
related technical services
• Total of ~90 drawbells expectedto be completed by end of 2013
• Annual drawbell developmentto decrease overmine life with
commensurate decrease in capital
• $15 million – capitalized exploration
• $45 million – Feasibility and related engineering studies,permitting,
camp facilities/operation
• $30 million – underground developmentand capitalized exploration
• $30 million – equipment,mine and mill projects/maintenance
2013 capital expenditures by category
Appendix 1
26. 26
Cerro San Pedro - $40 million
Mesquite - $20 million
75%
25%
60%
40%
• $30 million – final leach pad expansion and capitalized stripping for
phase 5 development
• $10 million – site maintenance/processing improvements
• $12 million – two additional trucks and constructionof new welding and
tire shops
• $8 million – equipmentcomponents/site maintenance
2013 capital expenditures by category
Direct investment for future production Annual sustaining capital
New Gold’s 30% share of estimated El Morro capital cost of $23 million
fully carried by Goldcorp Inc.
Appendix 1
27. 27
• New Gold’s estimated exploration budgetfor 2013 is $50 million
• Capitalized: $20 million
• Expensed:$30 million
• Additional $5 million of exploration at Rainy River postacquisition
New Afton
40,000 metres
Peak Mines
33,000 metres
Blackwater
40,000 metres
Capitalized: $15 million
Expensed: $15 million
Expensed: $10 million
Capitalized: $5 million
Expensed: $5 million
2013 exploration program overview
Appendix 1
28. 28
1. Refer to Cautionary Statement and note on total cash costs under the heading “Non-GAAP Measures”.
2. Sustaining capital based on New Gold’s total 2013 estimated capital expenditures excluding expenditures related to growth-related initiatives.
3. Refer to Cautionary Statement and note on all-in sustaining costs under the heading “Non-GAAP Measures”. All-in sustaining cash costs calculated using the mid-point of New Gold’s estimated 2013 production range.
2013 estimated all-in sustaining costs
Appendix 2
Total cash costs(1)
~$350/oz
General and administrative ~$60/oz
Exploration expense ~$70/oz
Sustaining capital(2) ~$395/oz
ALL-IN SUSTAINING COSTS(3)
~$875/oz
29. 29
• Gold productiongrowth through full year of
productionat New Afton and increased
throughput and recoveries at Peak Mines
• Copperproductionforecastto double to 78
to 88 million pounds
• Copperand silver by-products continue to
act as natural hedge to industry-wide cost
pressures
• By-productprice assumptions:
• Copper~$3.25 perpound(3)
• Silver ~$22.50 perounce(3)
1. Gold sales range forecast to be 440,000 to 480,000 ounces.
2. Refer to Cautionary Statement and note on total cash costs under the heading “Non-GAAP Measures”.
3. Based on year-to-date average realized price through June 30, 2013 and $3.25 per pound and $20 per ounce for balance of year.
• By-productsensitivities:
• $0.25 per pound change in copper
impacts consolidated cashcosts by ~$45
per ounce
• $1.00 per ounce change in silver impacts
consolidated cashcosts by ~$3 per
ounce
2013 guidance
Gold production(1)
440 - 480Koz
Total cash costs(2)
~$350/oz
Appendix 2
30. 30
1. Refer to Cautionary Statement and note on total cash costs under the heading “Non-GAAP Measures”.
2. By-product price assumptions: Silver - ~$22.50/oz; Copper - ~$3.25/lb.
3. New Afton co-product cost estimates: Gold - $570-$590/oz; Copper - $1.20-$1.30/lb.
Gold Production
(Koz)
Silver Production
(Moz)
Copper Production
(Mlbs)
Total Cash Costs(1)(2)
($/oz)
2012A 2013E 2012A 2013E 2012A 2013E 2012A 2013E
Mesquite 142 130-140 -- -- -- -- $690 $830-$850
Cerro San Pedro 138 140-150 1.9 1.4-1.6 -- -- $232 $375-$395
Peak Mines 96 95-105 -- -- 14 12-14 $764 $670-$690
New Afton 37 75-85 -- -- 28 66-74 ($1,043)
($1,410)-
($1,390)(3)
412 440-480 1.9 1.4-1.6 42 78-88 $421 ~$350
2012 actuals versus 2013 guidance
Appendix 2
31. $465
$418
$446
$421
$350
$478
$557
$643
$738
$200
$400
$600
$800
2009 2010 2011 2012 2013E
31
1. Calculated based on YE’2012 GFMS industry average less mid-point of New Gold 2013 cost guidance.
2. Refer to Cautionary Statement and note on total cash costs under the heading “Non-GAAP Measures”.
3. Industry data per GFMS reports calculated net of by-product credits as at YE’2012.
TotalCashCosts(US$/oz)(2)
Incremental Margin to New Gold
Shareholders
(3)
Lower costs driving margin expansion
New Gold offers shareholders potential for over $375 per ounce(1) of incremental margin
Appendix 2
33. $690
2012A 2013E
142
2012A 2013E
33
Key assumptions and sensitivities
• Dieselcomprises ~25% of Mesquite’s total costs
• Rack dieselprice mostcorrelated to Brent oil price
• Budgeted dieselprice in 2013 is 8% higher
than 2012 average price paid
• Every 10% change in dieselprice has ~$20 per
ounce impact on costs
2012Aversus 2013E
• Productionexpected to decline moderately
due to the planned processing of ore from an
area within the mine plan that is below
reserve grade
• Increase in costs attributable to higher cost
leach pad inventory working through sales
and lower productionbase
1. Mesquite life-of-mine recovery continues to track at ~75% for oxides; ~35% for sulphides.
2. Refer to Cautionary Statement and note on total cash costs under the heading “Non-GAAP Measures”.
140
130
$850
$830
Mesquite
GOLD PRODUCTION(1) (Koz) TOTAL CASH COSTS(2) ($/oz)
Appendix 3
34. $232
2012A 2013E
138
2012A 2013E
1.9
2012A 2013E
34
Key assumptions and sensitivities
• Silver price - $30.00 perounce (2012A- $30.78 per
ounce)
• Mexican peso:U.S. foreignexchange – 13:1
• $1.00 per ounce change in silver equals ~$10 per
ounce change in Cerro San Pedro cash costs
• $1.00 change in Mexican peso equals ~$25 per
ounce change in Cerro San Pedro cash costs
2012Aversus 2013E
• Targeting 5% increase in gold production
• Decrease in tonnes processedoffsetby
increase in gold grade
• Increase in costs primarily driven by lower silver
by-productproductionas well as lower price
assumption
• ~$95 per ounce of increase in costs
attributable to lower silver by-productrevenue
• Silver grades decreasing by ~25%
1. Cerro San Pedro life-of-mine recovery continues to track at: Gold – ~60%; Silver – ~25%.
2. Refer to Cautionary Statement and note on total cash costs under the heading “Non-GAAP Measures”.
150
140 1.6
1.4
$395
$375
Cerro San Pedro
GOLD PRODUCTION(1) (Koz) TOTAL CASH COSTS(2) ($/oz)SILVER PRODUCTION(1) (Moz)
Appendix 3
35. $764
2012A 2013E
14
2012A 2013E
96
2012A 2013E
35
Key assumptions and sensitivities
• Copperprice - $3.50 per pound (2012A- $3.51 per
pound)
• Australian dollar: U.S. foreignexchange – 1:1
• $0.25 per pound change in copperequals ~$35 per
ounce change in Peak Mines cash costs
• $0.01 change in Australian dollar equals ~$10 per
ounce change in Peak Mines cash costs
2012Aversus 2013E
• Increased gold productiondriven by 50,000
tonne increase in tonnes processed
• Similar copperproductiona result of increased
tonnes processed and copperrecoveriesoffset
by lower coppergrades
• Reductionin estimated cash costs a result of
increased gold productionand lower foreign
exchange rate assumptionversus average 2012
exchange rate
105
95
14
12
$690
$670
1. Refer to Cautionary Statement and note on total cash costs under the heading “Non-GAAP Measures”.
Peak Mines
GOLD PRODUCTION(1) (Koz) TOTAL CASH COSTS(2) ($/oz)COPPER PRODUCTION(1) (Mlbs)
Appendix 3
37. 28
2012A 2013E
37
2012A 2013E
37
2012Aversus 2013E
• New Afton entering first full year of productionin 2013 after successful2012 start-up
• Increased gold productiondriven by a full year of operations as well as continued recovery improvements,
partially offsetby lower gold grade
• Copperproductionexpected to more than double,driven by full year of productionas well as increases in
coppergrades and recoveries
85
75
74
66
New Afton
GOLD PRODUCTION(1) (Koz) COPPER PRODUCTION(1) (Mlbs)
1. Refer to Cautionary Statement and note on total cash costs under the heading “Non-GAAP Measures”.
Appendix 4
38. ($1,043)
2012A 2013E
$656
2012A 2013E
$1.40
2012A 2013E
38
Key assumptions and sensitivities
• Copperprice - $3.50 per pound (2012A- $3.58 per pound)
• Canadian dollar: U.S. foreignexchange – 1:1
• $0.25 per pound change in copperequals ~$220 per ounce change in New Aftonby-productcash costs
• $0.01 change in Canadian dollar equals ~$15 per ounce change in New Afton by-productcash costs
($1,390)
($1,410)
$590
$570
$1.30
$1.20
1. Refer to Cautionary Statement and note on total cash costs under the heading “Non-GAAP Measures”.
New Afton (cont’d)
TOTAL CASH COSTS(1) ($/oz)
(By-Product)
TOTAL CASH COSTS(1) ($/oz)
(Co-Product Copper)
TOTAL CASH COSTS(1) ($/oz)
(Co-Product Gold)
Appendix 4
39. 39
Kenora
Fort Frances
Thunder Bay
Rainy River Gold Project
• Mining friendly Northwestern Ontario
• 65 km northwest of Fort Frances
• 80 km south of Kenora
• Within 25 km of rail and power
• Local skilled labour force
HWY 600 Site Topography
RainyRiver – Location
Appendix 5
40. 40
• Central British Columbia near infrastructure
• Year-round accessibilityfor drilling/
development
• Total 2012 drilling over 270,000 metres
projectwide
• Ability to fund continued exploration/
developmentinternally
• Tax synergies with New Afton
• PEA completed September2012
• Targeting annual gold productionof
~500,000ounces
• Targeting completionof Feasibility Study by
late 2013
• Targeting productionin 2017
• Consolidated significantland position–
1,000 km2
1. Refer to appendix 8 for detailed disclosure on Reserve and Resource calculations.
2. Blackwater start date based on indicative timeline which is dependent on permit approvals.
• Additional Measured and Indicated
gold resources – stockpile material of
0.9 million ounces
Blackwater – A robust project
Measured and Indicated
Gold Resources(1) –
Direct Processing Material
8.6 Moz
Appendix 6
41. 41
1. Indicative timeline is dependent on permit approvals. There is no assurance this timeline will be achieved nor that the d eposit will ever reach the production stage.
Development activity
First Nations & Public Consultation
Preliminary Economic Assessment
Base Line Environmental Studies
Feasibility Study
Engineering Procurement
Production Target
Drilling
Project Description/Terms of Reference
Environmental Assessment Reports
Provincial Approval
Federal Approval
Construction
H1 H2 H1 H2 H1 H2H1 H2 H1 H2 H1 H2
2012 2013 2014 2015 2016 2017
Reflects critical path in timeline
Blackwater – Indicative timeline
Appendix 6
42. 42
• Start of production in 2017
• Conventional truck and shovel open pit mine with 60,000 tonnes per day
processing plant
• Life-of-mine strip ratio of ~2.4 to 1
• Low grade stockpiling strategy
• Simple, conventional flowsheet using whole ore leach process
• Life-of-mine gold and silver recoveries of 87% and 53%, respectively
• Conventional waste rock and Tailings Storage Facility
• Power supply from the hydroelectric power grid, via 133 kilometre transmission line
• Minimal off-site infrastructure required
• Good existing access road; water supply within 15 kilometres
• Low environmental risk and facility designed for closure
Blackwater – Project overview
Appendix 6
43. 43
• Projectis located 112 kilometres southwest
from Vanderhoof and has access to low cost
hydroelectric power
• Developmentcapital estimate of $1.8 billion
is inclusive of a 24% or $346 million
contingency
• Developmentcapital estimated based on the
current cost environment
• A parity foreignexchange rate was
assumed and the capital estimate was
held constant in the economic analysis
• Sustaining capital of $537 million,
reclamation and closure costs of $95 million
and $72 million in equipmentsalvage value
Blackwater PEA costs – Capital
Total development and sustaining
capital estimated at $294 per
recoverable gold ounce
Project Development Capital Costs
Description Cost ($ million)
Direct Costs
Mining & Pre-production Development $208
On Site Infrastructure $181
Process $539
Tailing and Water Reclaim $74
Infrastructure (Power, Water, Road) $85
Total Direct Costs $1,087
Owner's and Indirect Costs
Owner's Costs $54
EPCM $112
Other Indirects $215
Total Owner's and Indirect Costs $381
Subtotal $1,468
Contingency (24%) $346
Total Project $1,814
Appendix 6
44. Project Operating Costs
Area Unit Cost (C$/t milled) $ per gold ounce produced
Mining $6.21 $259
Processing $7.59 $317
General and Administrative $0.95 $40
Royalty (0.6%) $0.18 $8
Refining $0.23 $9
Silver by-product sales at$22.50 per ounce silver ($2.16) ($90)
Total cash costs
(1)
net of by-product sales $13.01 $543
44
Processing Costs
1. Refer to Cautionary Statement and note on total cash costs under the heading “Non-GAAP Measures” and PEA additional cautionary note.
Blackwater PEA costs – Operating
59%
11%
9%
6%
4%
4%
4% 2% Hauling
Auxiliary
Blasting
G&A
Drilling
Loading
General Maint.
General Mine
Mining Costs
44%
24%
17%
8%
6%
1%
Reagents
Grinding
Media/Liners
Electricity
Labour
Maint. Materials
Water Supply
Blackwater’s locationnear infrastructure,low stripping ratio,access to low costpower and silver
by-productrevenue expectedto resultin the Projecthaving wellbelow industryaverage cashcosts
Appendix 6
45. • Goldcorp – 70% partner and projectoperator
• New Gold’s 30% share of capital fully funded by
Goldcorp
• Current resource entirely within La Fortuna deposit
• Neighbouring El Morro depositunderexplored
• 2012 year end update added 0.4 million ounces of
gold and 229 million pounds of copperto reserves(1)
• Addressing recenttemporary suspensionof
environmental permit
• Chile evaluating various alternatives for a power
source to northern Chilean developmentprojects
45
1. New Gold’s attributable 30% share. Refer to Appendix 8 for detailed disclosure on reserve and resource calculations.
2. Refer to Cautionary Statements.
3. Refer to Cautionary Statements and note on total cash cost under the heading “Non-GAAP Measures”. Life of mine co-product costs estimated at $550/oz gold and $1.45/lb copper at commodityprice assumptions of $1,200/oz gold
and $2.75/lb copper.
Location Chile
Mine type Open Pit
Reserves1 – Gold/Copper (Moz/Mlbs) 2.9/2,097
Resources1 – Gold/Copper (Moz/Mlbs) 2.9/2,097
Estimate mine life 17 years
LOM production/yr (Au Koz/Cu Mlbs)2 90/85
LOM cash costs/oz by-product3 ($700)
El Morro (30%)
2.9 Moz
Gold Reserve(1)
2.1 Blbs
Copper Reserve(1)
Appendix 7
46. 46
• El Morro Feasibility Study was updated in December 2011
• Key parameters for New Gold include:
• 30% share of estimated development capital, or $1.2 billion, carried by Goldcorp
– Receive cash flow from start of production
– Interest rate fixed at 4.58%
• Base 17-year mine life
• 30% share of annual production: ~90,000 ounces of gold and ~85 million pounds
of copper
• Estimated total cash costs(1), net of by-products ($700) per ounce
– Co-product gold ~$550 per ounce
– Co-product copper ~$1.45 per pound
1. Refer to Cautionary Statement and note on total cash costs under the heading “Non-GAAP Measures” .
El Morro overview of updated FeasibilityStudy
Appendix 7
47. 47
2012 openpit Proven and
Probable reserves and Measured
and Indicated resources
Underground Inferred
resource with block
cave potential
500 metres
La Fortuna deposit
Appendix 7
48. 48
1. Capital estimates based on December 2011 Feasibility Study.
El Morro (30%) – Funding structure(1)
Appendix 7
Funded by
$1.2 billion
interest at 4.58%
~ $2.7 billion 70%
20% 80%
• New Gold’s 30% share of development capital 100% carried
• Interest fixed at 4.58%
30% 70%
30%
TotalCapital
100%
~ $3.9 billion
100% Average
annual
cash flow
Carried funding repayment
49. Au Grade
(g/t)
Cu Grade
(%)
$91/t
$44/t
$41/t
$27/t
$53/t
$52/t
$42/t
$33/t
$31/t
$30/t
--
0.10
0.20
0.30
0.40
0.50
0.60
0.70
0.80
0.20% 0.40% 0.60% 0.80% 1.00% 1.20%
49
Company disclosure.
1. Circle sizes are representative of contained metal value of the reserves per tonne of reserve. Contained metal value calculated using Street research consensus long-term commodity pricing.
2. Includes “Cadia East Underground” and “Ridgeway Underground” reserves as indicated in Newcrest’s February 8, 2013 press release; does not include “Other” Cadia province reserves.
El Morro
Producing Development
Chapada
Cadia-Ridgew ay
Alumbrera
New Afton
New Prosperity
Cobre Panama
Mt. Milligan
Cerro Casale
El Morro
Agua Rica(2)
New Afton
Selected porphyry gold/copper deposits/mines(1)
Appendix 7
50. 501. Based on Goldcorp’s December 31, 2012 year-end resource statements.
2. Gold equivalent calculated based on the following commodity prices: Gold - $1,600/oz; Silver - $30.00/oz; Copper - $3.50/lb; Lead - $0.90/lb; Zinc - $0.90/lb.
El Morro relative positioning(1)
EL MORRO WITHIN GOLDCORP PORTFOLIO
Asset Gold Reserves (Moz) Asset Gold Equivalent(2) (Moz)
Penasquito 15.7 Penasquito 43.9
Pueblo Viejo 10.0 El Morro 17.4
Los Filos 7.4 Pueblo Viejo 11.7
El Morro 6.7 Los Filos 8.4
Cerro Negro 5.7 Cerro Negro 6.7
Appendix 7
51. 51
1. Year end 2012 Mineral Resources updated for Blackwater Resource update on April 4, 2013 and New Afton C-Zone updated on May 1, 2013.
2. Year end 2011 Mineral Resources presented at Investor Day on February 2, 2012.
3. Rainy River shown on a 100% basis.
Reserves and resources summary
Mineral Reserves and Resources Summary
Current
(1)
Year End 2011
(2)
Gold
Koz
Silver
Koz
Copper
Mlbs
Gold
Koz
Silver
Koz
Copper
Mlbs
Proven and Probable Reserves 11,783 41,571 3,282 7,863 34,347 2,888
Measured and Indicated Resources (inclusive ofReserves) 29,242 159,585 4,223 18,797 115,268 3,946
Inferred Resources 6,822 88,359 1,187 6,323 76,856 2,202
M&I Resources (inclusive ofReserves)
Mesquite 5,684 - - 5,534 - -
Cerro San Pedro 1,703 57,980 - 1,812 55,860 -
Peak Mines 880 1,350 146 948 1,570 167
New Afton 2,224 7,292 1,980 1,742 5,470 1,586
Blackwater 9,497 70,128 - 5,423 25,774 -
Capoose 196 9,497 - 384 26,594 -
Rainy River 6,167 13,338 - n/a n/a n/a
El Morro 2,891 - 2,097 2,954 - 2,193
Total M&I 29,242 159,585 4,223 18,797 115,268 3,946
Appendix 8
52. 52
Reserves and resources summary (cont’d)
Mineral Reserves statementas atDecember 31,2012
Metal grade Contained metal
Tonnes
000s
Gold
g/t
Silver
g/t
Copper
%
Gold
Koz
Silver
Koz
Copper
Mlbs
Mesquite
Proven 13,140 0.68 - - 287 - -
Probable 114,409 0.56 - - 2,055 - -
Mesquite P&P 127,549 0.57 - - 2,342 - -
Cerro San Pedro
Proven 21,100 0.52 17.1 - 353 11,600 -
Probable 26,400 0.48 17.4 - 407 14,800 -
CSP P&P 47,500 0.50 17.3 - 760 26,400 -
Peak Mines
Proven 2,109 5.89 7.5 1.08 399 510 50
Probable 2,118 3.82 6.8 1.18 260 466 55
Peak P&P 4,227 4.85 7.2 1.13 659 976 105
New Afton
Proven - - - - - - -
Probable 52,500 0.65 2.3 0.93 1,100 3,880 1,080
New Afton P&P 52,500 0.65 2.3 0.93 1,100 3,880 1,080
Rainy River
Proven 27,700 1.14 1.94 - 1,015 1,728 -
Probable 88,600 1.06 3.01 - 3,017 8,587 -
Rainy River P&P 116,300 1.08 2.76 - 4,031 10,315 -
El Morro 100% Basis 30% Basis
Proven 307,949 0.57 - 0.56 1,705 - 1,135
Probable 335,152 0.37 - 0.44 1,186 - 962
El Morro P&P 643,101 0.47 - 0.49 2,891 - 2,097
Appendix 8
1. Year end 2012 Mineral Resources updated for Blackwater Resource update on April 4, 2013 and New Afton C-Zone updated on May 1, 2013.
2. Rainy River shown on a 100% basis.
54. 54
Reserves and resources summary (cont’d)
Measured and Indicated mineral Resource statement(inclusive ofReserves) as atDecember 31,2012
Metal grade Contained metal
Tonnes
000s
Gold
g/t
Silver
g/t
Copper
%
Gold
Koz
Silver
Koz
Copper
Mlbs
New Afton
A&B Zones
Measured 33,500 0.86 2.9 1.18 929 3,160 873
Indicated 45,900 0.67 2.4 0.89 984 3,530 896
A&B Zone M&I 79,400 0.75 2.6 1.01 1,913 6,690 1,769
C-Zone
Measured 1,282 0.75 1.4 0.79 31 56 22
Indicated 11,205 0.78 1.5 0.77 280 548 189
C-Zone M&I 12,486 0.77 1.5 0.77 311 602 211
Total New Afton M&I 91,886 0.75 2.6 1.00 2,224 7,292 1,980
Blackwater
Direct processing material
Measured 116,955 1.04 5.6 - 3,896 21,057 -
Indicated 189,044 0.78 6.0 - 4,729 36,467 -
M&I (directprocessing) 305,999 0.88 5.8 - 8,624 57,524 -
Stockpile material
Measured 26,521 0.30 4.1 - 256 3,496 -
Indicated 64,382 0.30 4.4 - 617 9,108 -
M&I (stockpile) 90,903 0.30 4.3 - 873 12,604 -
Total Blackwater M&I 396,902 0.74 5.5 - 9,497 70,128 -
Capoose
Indicated 14,200 0.43 20.8 - 196 9,497 -
Rainy River
Measured 27,638 1.33 1.90 - 1,182 1,689 -
Indicated 130,885 1.18 2.8 - 4,985 11,649 -
Total Rainy River M&I 158,523 1.21 2.62 - 6,167 13,338 -
El Morro 100% Basis 30% Basis
Measured 307,949 0.57 - 0.56 1,705 - 1,135
Indicated 335,152 0.37 - 0.44 1,186 - 962
El Morro M&I 643,101 0.47 - 0.49 2,891 - 2,097
Appendix 8
1. Year end 2012 Mineral Resources updated for Blackwater Resource update on April 4, 2013 and New Afton C-Zone updated on May 1, 2013.
2. Rainy River shown on a 100% basis.
55. 55
Reserves and resources summary (cont’d)
Inferred Resource statementas atDecember 31,2012
Metal grade Contained metal
Tonnes
000s
Gold
g/t
Silver
g/t
Copper
%
Gold
Koz
Silver
Koz
Copper
Mlbs
Mesquite
Oxide 35,200 0.33 - - 373 - -
Non oxide 15,700 0.55 - - 278 - -
Mesquite Inferred 50,900 0.40 - - 651 - -
Cerro San Pedro
Oxides 53,400 0.17 9.0 - 300 15,400 -
Sulphides 50,500 0.34 8.5 - 550 13,800 -
CSP Inferred 103,900 0.25 8.8 - 850 29,200 -
Peak Mines 1,700 2.64 4.8 1.13 144 261 42
New Afton
A&B-Zone 14,900 0.45 2.0 0.65 216 940 212
C-Zone 20,221 0.62 1.4 0.68 401 923 301
New Afton Inferred 35,121 0.56 1.5 0.68 617 1,863 513
Blackwater
Direct processing 13,815 0.76 4.1 - 337 1,821 -
Stockpile 3,785 0.31 3.6 - 38 438 -
Blackwater Inferred 17,600 0.66 4.0 - 375 2,263 -
Capoose 64,070 0.29 23.2 - 595 47,789 -
Rainy River 93,804 0.76 2.32 - 2,280 6,983 -
100% Basis 30% Basis
El Morro 137,555 0.99 - 0.70 1,310 - 632
Appendix 8
1. Year end 2012 Mineral Resources updated for Blackwater Resource update on April 4, 2013 and New Afton C-Zone updated on May 1, 2013.
2. Rainy River shown on a 100% basis.
56. 56
Mineral reserves are contained w ithin Measured and Indicated mineral resources. Measured and Indicated mineral resources that are not mineral reserves do not have demonstrated economic
viability as defined by a technicalFeasibility Study. New Gold reports its Measured and Indicated mineral resources inclusive of its mineralreserves. Inferred mineralresources are not know n
w ith the same degree of certainty as Measured and Indicated resources, do not have demonstrated economic viability, and are exclusive of mineral reserves. Mineralreserves have been
estimated and reported in accordance with the Canadian Institute of Mining, Metallurgy and Petroleum (‘CIM’) definition standards and guidelines and Canadian National Instrument 43-101
(‘NI 43-101’).
1) Mineral Reserves for the company’s mineral properties have been calculated based on the follow ing metal prices and low er cut-off criteria:
Mineral Property Gold
(US$/oz)
Silver
(US$/oz)
Copper
(US$/lb)
Lower Cut-off
Mesquite $1,300 - - 0.21 g/t Au – Oxide reserves
0.41 g/t Au – Non-oxide reserves
Cerro San Pedro $1,300 $24.00 - US$4.33 /t NSR
Peak Mines $1,300 $24.00 $3.00 A$120 – 253/t NSR
New Afton $1,300 - $3.00 US$24/t NSR
El Morro $1,350 - $3.00 0.20% CuEq
Rainy River $1,250 $25.00 - 0.30 g/t AuEq – Open Pit
3.5 g/t AuEq - Underground
Reserves and resources notes
Appendix 8
57. 57
2) Mineral Resources for the company’s mineral properties have been calculated based on the follow ing metal prices and low er cut-off criteria:
Mineral resources have been estimated and reported in accordance with CIM definition standards and guidelines and Canadian NI 43-101.
Mineral Property Gold
(US$/oz)
Silver
(US$/oz)
Copper
(US$/lb)
Lower Cut-off
Mesquite $1,400 - - 0.12 g/t Au – Oxide resources
0.24 g/t Au – Non-oxide resources
Cerro San Pedro $1,400 $28.00 - 0.1g/t AuEq – Open pit oxide resources
0.4g/t AuEq – Open pit sulphide resources
Peak Mines $1,400 $28.00 $3.25 A$97 - 137/t NSR
New Afton $1,400 $28.00 $3.25 0.40% CuEq – All resources
El Morro $1,500 - $3.50 0.15% Cu – Open pit resources
0.20% Cu – Underground resources
Blackw ater $1,400 - - 0.40 g/t AuEq
Capoose $1,400 - - 0.40 g/t AuEq
Rainy River $1,100 $22.50 - 0.35 g/t AuEq – Open Pit
2.5 g/t AuEq – Underground
3) Mineral resources are classified as Measured, Indicated and Inferred resources and are reported based on technical and economic parameters consistent w ith the methods most suitable for
their potential commercial exploitation. Where different mining and/or processing methods might be applied to different portions of a mineral resource, the designators ‘open pit’ and
‘underground’ have been applied to indicate envisioned mining method. Likew ise the designators ‘oxide’, ‘non-oxide’ and ‘sulphide’ have been applied to indicate the type of mineralization as
it relates to appropriate mineral processing method and expected payable metal recoveries. Additionaldetails regarding mineral resource estimation, classification and reporting parameters for
each of New Gold’s mineral properties are provided in the respective NI 43-101 TechnicalReports w hich are available on SEDAR.
4) Blackw ater April4, 2013 update:
1. Mineral resources are reported within a conceptualopen pit shell based on metal prices of $1,400/oz gold and $28.00/oz silver. The March 2013 mineral resource estimate utilizes
average metallurgical recoveries of 88.0% gold and 64.0% silver for oxide mineralization, 85.0% gold and 58.0% silver for transitionaloxide/sulfide mineralization and 85.0% gold and 44.0%
silver for sulfide mineralization. The 2012 year-end mineral resource estimate utilizes average metallurgical recoveries of 86% gold and 44.9% silver for all material types.
2. Total contained metal is calculated based on Tonnes*Grade / 31.10348 grams per troy ounce.
3. Gold-equivalent cut-off grade estimates are based on $1,400/oz gold and $28.00/oz silver and average metal recoveries as described in Note 1 above.
4. Direct processing material is defined as mineralization above a 0.40 g/t AuEq cut-off and likely to be mined and processed directly.
5. Stockpile material is defined as mineralization betw een a 0.30 g/t AuEq and a 0.40 AuEq cut-off that is suitable for stockpiling and future processing based on average metallurgical
recoveries as described in Note 1 above.
5) Qualified Person: The preparation of New Gold’s mineral reserve and resource statements has been done by Qualified Persons as defined under Canadian National Instrument 43-101
under the oversight and review of MarkPetersen, a Qualified Person under National Instrument 43-101 and employee of New Gold.
Reserves and resources notes (cont’d)
Appendix 8
58. 58
Guidance assumptions(1)
Spot:
2013
Gold price ($/oz) ~1,350
Silver price ($/oz) ~22.50
Copper price ($/oz) ~3.25
USD/AUD 1.00
USD/CAD 1.00
USD/MXN 13.00
Spot
Gold price ($/oz) 1,310
Silver price ($/oz) 21.75
Copper price ($/oz) 3.20
USD/AUD 0.93
USD/CAD 0.97
USD/MXN 12.95
1. Based on year-to-date average realized prices through June 30, 2013 and prevailing prices at time of second quarter results release on July 31, 2013.
Commodity price/foreign exchange assumptions
Appendix 9
59. Notes
Page 4
1. Rankings based on 25 countries evaluated in 2013 Behre Dolbear Report – 2013 Ranking of Countries for Mining Investment: “Where Not to Invest”.
Page 5
1. Refer to Endnotes and note under the heading “Cautionary note to U.S. readers concerning estimates of Measured, Indicated and Inferred Resources”.
2. Measured and Indicated Resources inclusive of Reserves.
3. Pro forma figures include Rainy River and assume 100% ow nership of Rainy River.
4. For a detailed breakdow n of Reservesand Resources, referto: New Gold’s “AnnualInformation Form for the Financial Year Ended December 31, 2012” dated March 27,
2013; new s release datedApril4, 2013 “New Gold Announces Increased Gold Resources at Blackw ater Project”; new srelease dated May 1, 2013 “New Gold Announces
2013 First Quarter Results – Increases Gold and Copper Resources at New Afton C-Zone by Over 300 Percent”; and new s release dated July 31, 2013 “New Gold Second
Quarter Delivers Increased Production at Low er Costs- Second Half of 2013 Remains on Track to Provide Strong Finish to the Year”.
Page 7
1. Based on comparison w ith costs published by issuers listed in notes 4 and 5. The manner in w hich costsare determined may vary fromone issuer to another.
2. Refer to Endnotes and note on total cash costs under the heading “Non-GAAP Measures”.
3. Refer to Endnotes and note on all-in sustaining costs under the heading “Non-GAAPMeasures”.
4. Mid-tier average includes: Alamos, Eldorado, Agnico Eagle, Aurico and IAMGOLD.
5. Senior average includes: Barrick, Goldcorp, Kinross and New mont.
Page 8
1. Gold sales expected to be in same general range as production.
2. Refer to Endnotes on total cash costs under the heading “Non-GAAP Measures”. Guidance for total cash costs and all-in sustaining costs incorporates realized prices and
foreign exchange rates to June 30, 2013 and assumes commodity prices and exchange rates consistent with those at July 30, 2013 for the balance of 2013.
3. Refer to Endnotes on all-in sustaining costs under the heading “Non-GAAPMeasures”.
Page 14
1. Refer to Appendix for detailed disclosure on Reserve and Resource calculations.
2. Refer to Endnotes and note under the heading “Cautionary note to U.S. readers concerning estimates of Measured, Indicated andInferred Resources”.
Measured and Indicated Resources are inclusive of Reserves. At Blackw ater, the 8.6 million ounces of Resources referred to above excludes 0.9 million ounces of material
to be stockpiled w hich has been classified as Measured and Indicated Resource. Refer to note 4 on page 5 for Reserve and Resource source information.
3. Refer to Endnotes on total cash costs under the heading “Non-GAAPMeasures”. Cash costs have been compared to industry data per GFMS
reports w hich calculated an average, net of by-product credits, cash cost of $738 per ounce for the YE’2012.
4. El Morro production and cash costs based on updated December 2011 Feasibility Study.
59
60. Notes continued
Page 17
1. For period fromAugust through December 2013.
2. For period fromJuly through December 2013.
3. Includes both capitalized and expensed exploration.
Page 18
Source: Broker Reports, Company Estimates and Announcements, Bloomberg; all amounts in USD.
1. Street consensus NAV.
2. Current street consensus NAV forEl Morro; includes $50 million cash payment received fromGoldcorp as part of transaction consideration.
3. New Gold acquired Richfield and Silver Quest on June 1, 2011 and December 23, 2011, respectively.
4. New Gold acquired 97.5% of Rainy River on August 9, 2013.
5. S&P/TSX Global Gold Index includes 54 gold companies in various stages of development/production.
6. FTSE Gold Mines Index includes 26 gold producing companies.
7. HUI Index includes 15 of the major global gold producers.
60
61. Endnotes
CAUTIONARY NOTE TO U.S. READERS CONCERNING ESTIMATES OF MEASURED, INDICATED AND INFERRED RESOURCES
Inf ormation concerning the properties and operations of New Gold has been prepared in accordance with Canadian standards under applicable Canadian securities laws, and may not be comparable to
similar inf ormation f or United States companies. The terms “Mineral Resource”, “Measured Mineral Resource”, “Indicated Mineral Resource” and “Inf erred Mineral Resource” used in this presentation are
Canadian mining terms as def ined in accordance with National Instrument 43-101 (“NI 43-101”) under guidelines set out in the Canadian Institute of Mining, Metallurgy and Petroleum (“CIM”) Standards
on Mineral Resources and Mineral Reserv es adopted by the CIM Council on Nov ember 27, 2010. While the terms “Mineral Resource”, “Measured Mineral Resource”, “Indicated Mineral Resource” and
“Inf erred Mineral Resource” are recognized and required by Canadian securities regulations, they are not def ined terms under standards of the United States Securities and Exchange Commission. Under
United States standards, mineralization may not be classif ied as a “Reserv e” unless the determination has been made that the mineralization could be economically and legally produced or extracted at
the time the Reserv e calculation is made. As such, certain inf ormation contained in this presentation concerning descriptions of mineralization and resources under Canadian standards is not comparable
to similar inf ormation made public by United States companies subject to the reporting and disclosure requirements of the United States Securities and Exchange Commission. An “Inf erred Mineral
Resource” has a great amount of uncertainty as to its existence and as to its economic and legal f easibility . It cannot be as sumed that all or any part of an “Inf erred Mineral Resource” will ev er be
upgraded to a higher category . Under Canadian rules, estimates of Inf erred Mineral Resources may not f orm the basis of f easibility or pre-f easibility studies. Readers are cautioned not to assume that all
or any part of Measured or Indicated Resources will ev er be conv erted into Mineral Reserv es. Readers are also cautioned not to assume that all or any part of an “Inf erred Mineral Resource” exists, or is
economically or legally mineable. In addition, the def initions of “Prov en Mineral Reserv es” and “Probable Mineral Reserv es” under CIM standards dif f er in certain respects f rom the standards of the United
States Securities and Exchange Commission.
TECHNICAL INFORMATION
The scientif ic and technical inf ormation contained in this presentation relating to the Rainy Riv er Gold Project has been rev iewed and approv ed by Garett Macdonald and Kerry Sparkes, both Qualif ied
Persons under NI 43-101 and of f icers of Rainy River. The other scientif ic and technical inf ormation contained in this presentation has been rev iewed and approv ed by Mark Petersen, a Qualif ied Person
under NI 43-101 and an of f icer of New Gold.
Mineral Reserv es and Mineral Resources
The estimates of Mineral Reserv es and Mineral Resources discussed in this presentation may be materially af f ected by env ironmental, permitting, legal, title, taxation, sociopolitical, marketing and other
relev ant issues. In addition to our February 5, 2013, April 4, 2013 and July 31, 2013 news releases, f urther details regarding Mineral Reserv e and Resource estimates, including classif ications, key
assumptions and parameters used in such estimates and other related inf ormation f or each of New Gold's mineral properties are prov ided in the respectiv e NI 43-101 Technical Reports, which are
av ailable at www.sedar.com.
BLACKWATER PEA – ADDITIONAL CAUTIONARY NOTE
This note regarding the preliminary economic assessment (“PEA”) is in addition to cautionary language already included in this presentation as required under NI 43-101. The Blackwater PEA is
preliminary in nature and includes Inf erred Mineral Resources that are considered too speculativ e geologically to hav e the economic considerations applied to them that would enable them t o be
categorized as mineral reserv es, and there is no certainty that the PEA based on these mineral resources will be realized. Mineral resources that are not mineral reserv es do not hav e demonstrated
economic v iability . This presentation includes inf ormation on New Gold’s PEA with respect to the Blackwater Project, which was outlined in the PEA Technical Report f iled on October 10, 2012. As
disclosed in the presentation, New Gold has, since the date of the PEA, completed sev eral non-material updates of the mineral resource estimate f or the Blackwater Project. Although the PEA represents
usef ul, accurate and reliable inf ormation based on the inf ormation av ailable at the time of its publication, and prov ides an important indicator as to the economic potential of the Blackwater Project, the
PEA is based on mineral resources estimates with an ef f ective date of July 27, 2012, which do not ref lect drilling conducted since their ef f ective date, and the PEA does not ref lect the latest mineral
resource estimate discussed in subsequent presentation. Certain assumptions used in the PEA, some of which relate to the July 27, 2012 mineral resource estimate, may hav e changed f rom those used
f or the new resource estimate, causing a v ariation of parameters. Moreov er, the updated mineral resource estimate may impact how New Gold intends to dev elop the deposit, including pit outlines,
production rates and mine lif e.
61
62. Endnotes continued
NON-GAAP MEASURES
TOTAL CASH COSTS
“Total cash costs” per ounce f igures are non-GAAP measures which are calculated in accordance with a standard dev eloped by The Gold Institute, which was a worldwide association of suppliers of
gold and gold products and included leading North American gold producers. The Gold Institute ceased operations in 2002, but the s tandard is widely accepted as the standard of reporting cash costs of
production in North America. Adoption of the standard is v oluntary and the cost measures presented may not be comparable to other similarly titled measures of other companies. New Gold reports total
cash costs on a sales basis. Total cash costs include mine site operating costs such as mining, processing, administration, roy alties and production taxes, but are exclusiv e of amortization, reclamation,
capital and exploration costs. Total cash costs are reduced by any by -product rev enue and are then div ided by ounces sold to arriv e at the total by -product cash cost of sales. The measure, along with
sales, is considered to be a key indicator of a company ’s ability to generate operating earnings and cash f low f rom its mining operations. This data is f urnished to prov ide additional inf ormation and is a
non-IFRS measure. Total cash costs presented do not hav e a standardized meaning under IFRS and may not be comparable to similarmeasures presented by other mining companies. It should not be
considered in isolation as a substitute f or measures of perf ormance prepared in accordance with IFRS and is not necessarily indicativ e of operating costs presented under IFRS. A reconciliation to the
nearest IFRS measure is prov ided in the MD&A accompany ing New Gold’s most recent interim f inancial statements.
ALL-IN SUSTAINING COSTS
Consistent with the recently announced guidance f rom the World Gold Council, an association of v arious gold mining companies f rom around the world of which New Gold is a member, New Gold def ines
“all-in sustaining costs” as the sum of mine site operating costs net of copper and silv er by -product sales, general & administrativ e costs, accretion and amortization, capitalized and expensed exploration,
mine dev elopment expenditures and sustaining capital expenditures. New Gold believ es this non-GAAP measure will prov ide f urther transparency into costs associated with producing gold. All-in
sustaining costs constitute a non-GAAP measure and are intended to prov ide additional inf ormation only and do not hav e any standardized meaning under IFRS. They should not be considered in
isolation or as a substitute f or measures of perf ormance prepared in accordance with IFRS. Other companies may calculate these measures dif f erently. A reconciliation to the nearest IFRS measure will
be prov ided in the MD&A accompany ing New Gold’s most recent interim f inancial statements.
62