Download to read offline

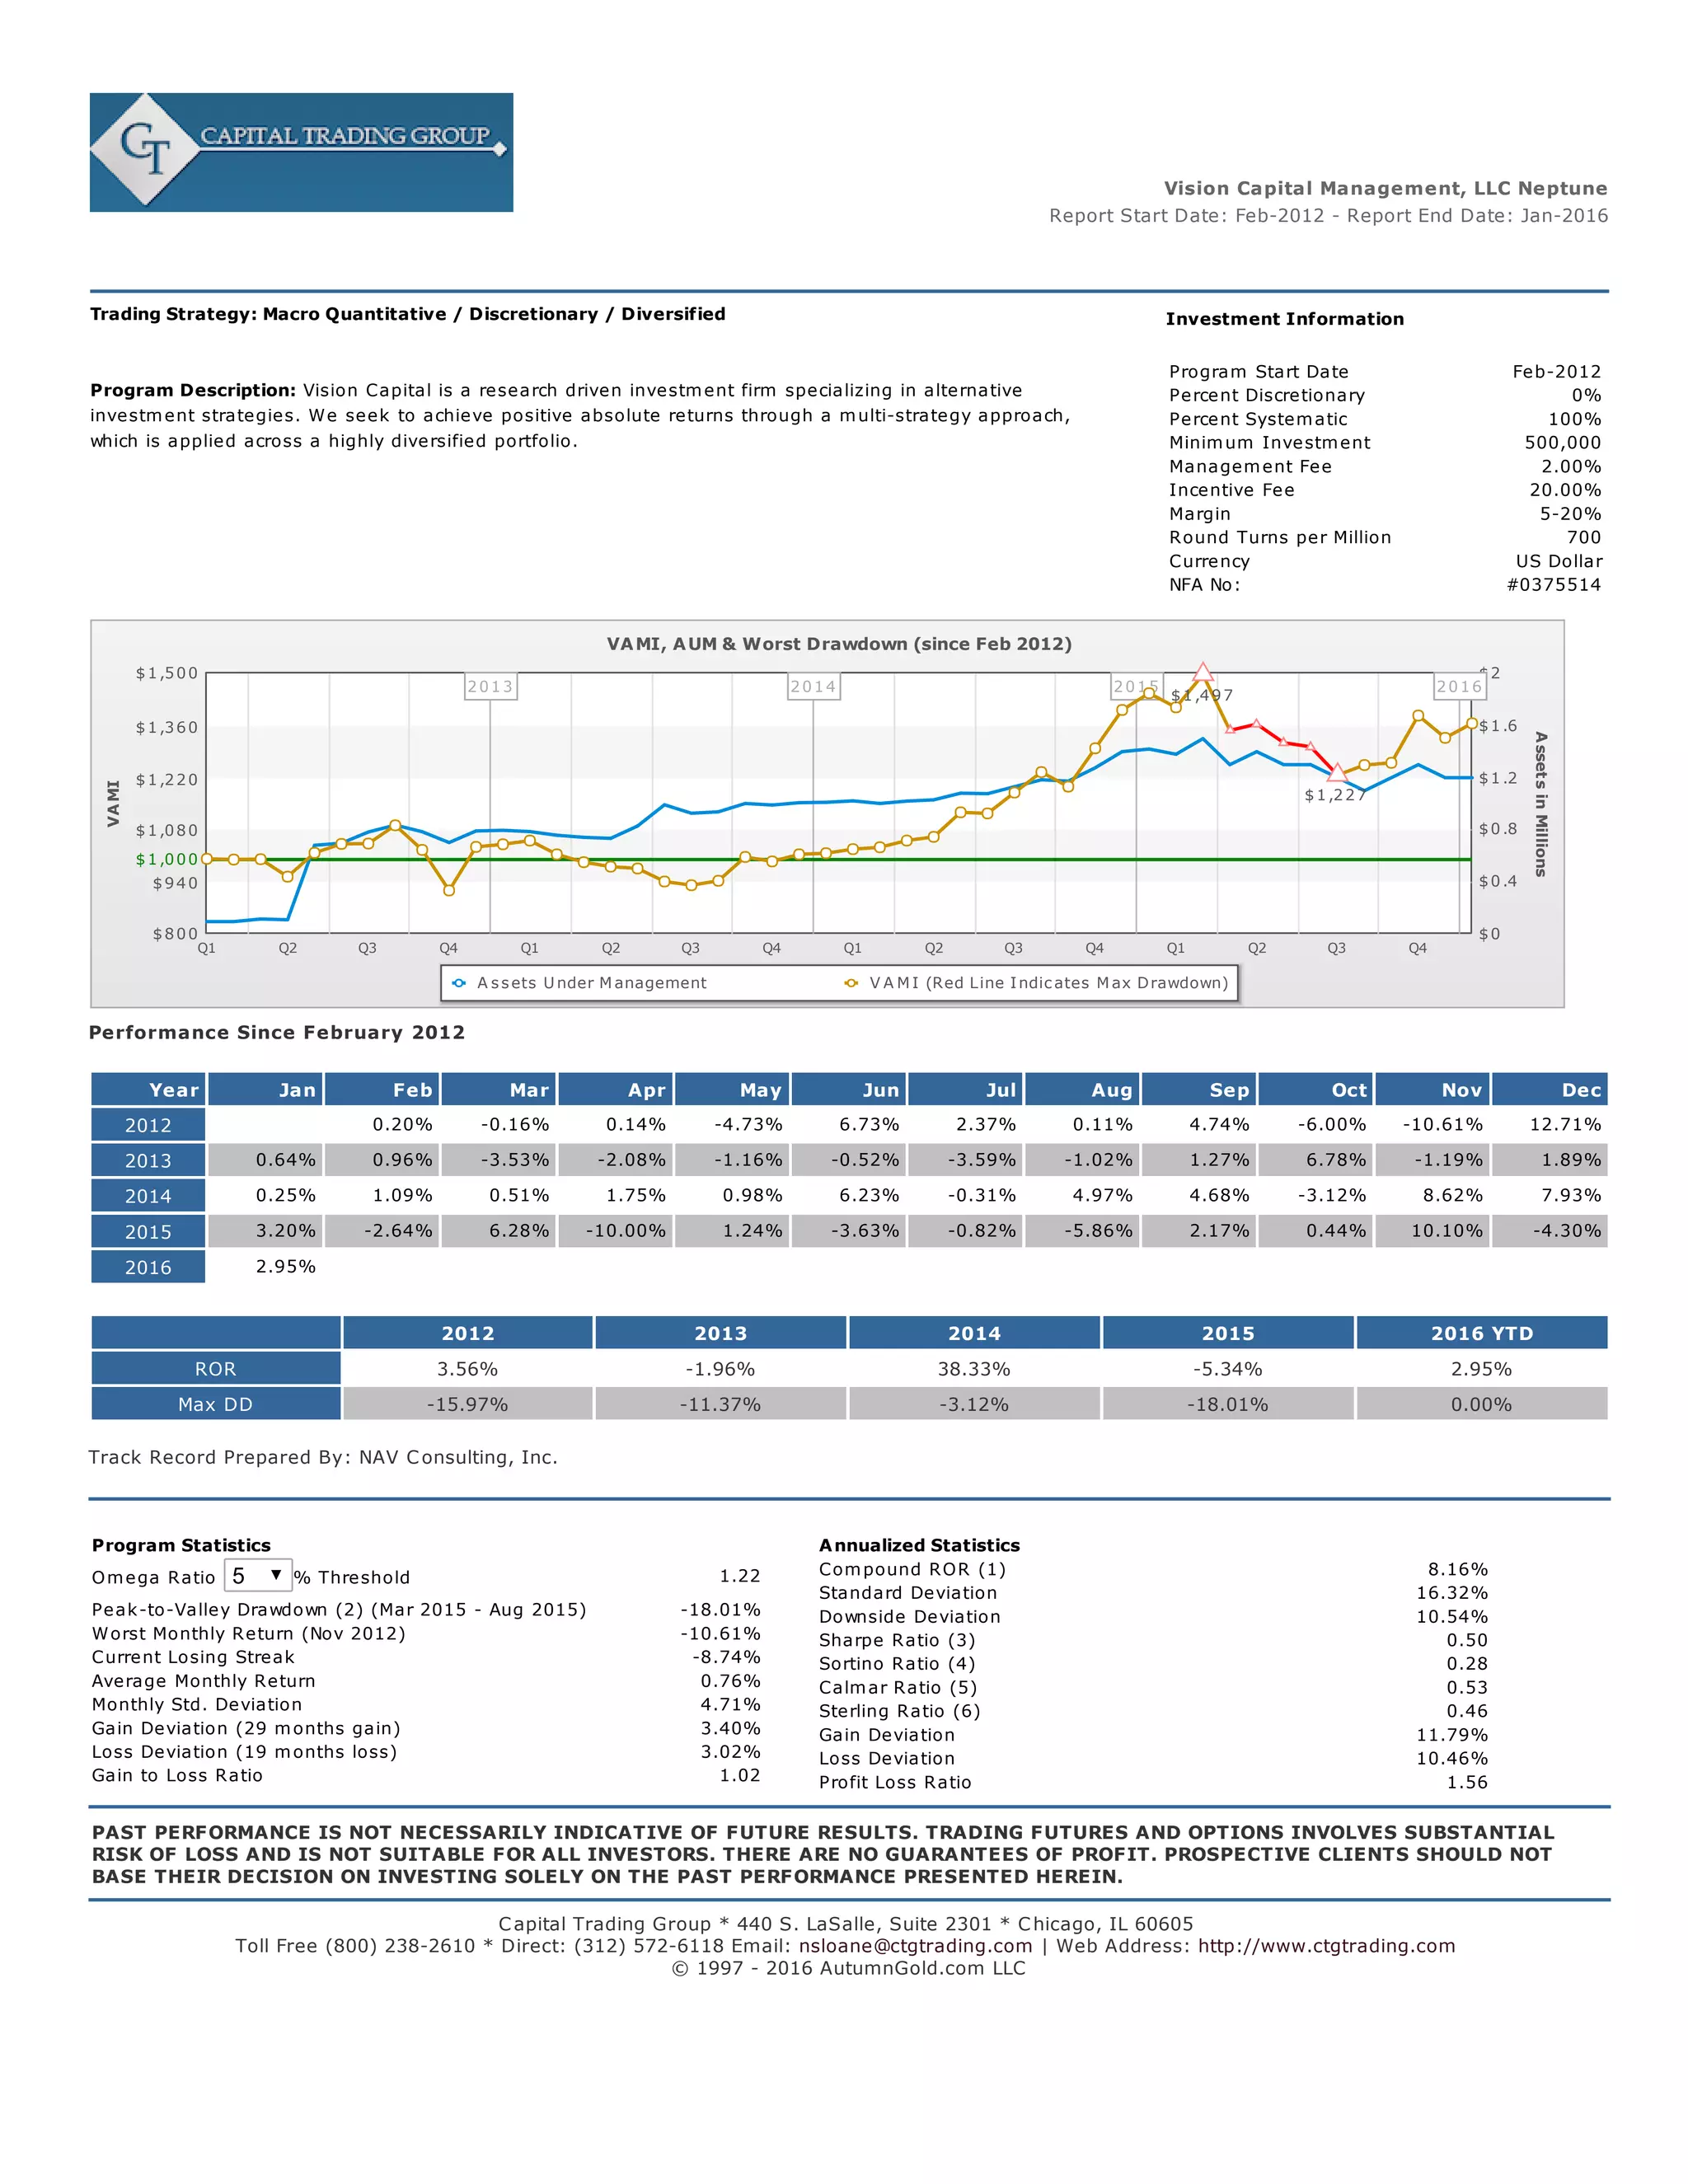

Vision Capital is a research-driven investment firm that seeks positive absolute returns through a diversified, multi-strategy approach. The firm has been in operation since February 2012, employs a 100% systematic trading strategy across a highly diversified portfolio, and has achieved an annualized return of 8.16% with moderate risk levels as measured by standard deviation and drawdown metrics.