SlideShare a Scribd company logo
1 of 5
Download to read offline
For financial adviser use only. Not to be distributed to, or relied upon by, retail clients.
AllianceBernstein:

Total assets by channel and asset class
By Channel By Asset Class
Institutional

52%
Retail

33%
Private Client

15%
Assets Under Management
Total: US$454 Bil.*
As of 31 March 2014
*Source: AllianceBernstein
Multi-Asset

13%
Structured/

Index

9%
Fixed

Income 

55%
Equities

20%
Other

3%
For financial adviser use only. Not to be distributed to, or relied upon by, retail clients.
Why is Dynamic De-risking important?

Portfolio volatility can vary dramatically
Simulated Portfolio Volatility
Static Asset Allocation Assuming 50/50 Equities and Bonds Hedged to GBP
The simulation was based on the AB Global Strategy 50/50 GBP portfolio allocation using daily returns with weekly rebalancing and fully hedged to GBP over the 10 year period from 30
June 2003–30 June 2013. Results are based on simulated or hypothetical performance results that have certain inherent limitations. Unlike the results shown in an actual performance
record, these results do not represent actual trading. Results exclude estimates of trading costs and market impact. Simulated or hypothetical trading programs in general are also subject
to the fact that they are designed with the benefit of hindsight. No representation is being made that any account will or is likely to achieve returns or a volatility profile similar to those
being shown. See Important Information. Historical information provided for illustrative purposes only
Source: AllianceBernstein
While the average risk of a balanced portfolio is moderate over long periods, 

in the interim, the risk can vary dramatically depending on the market environment.
0%
10%
20%
30%
40%
Jul 07 Jan 08 Aug 08 Mar 09 Oct 09 May 10Dec 10 Jun 11 Jan 12 Aug 12 Mar 13 Oct 13 May 14Dec 14 Jun 15 Jan 16 Aug 16 Mar 17
Average
volatility 6.3%
For financial adviser use only. Not to be distributed to, or relied upon by, retail clients.
Why is Dynamic De-risking important?

Aims to lower overall portfolio risk
Simulated Portfolio Volatility
Static Allocation vs. Target Volatility Allocation
(assumes 50/50 Equities and Bonds Hedged to GBP)
The simulation was based on the AllianceBernstein Global Strategy 50/50 portfolio allocation using daily returns with weekly rebalancing and fully hedged to GBP over the
10 year period from 30 June 2003–30 June 2013. The simulation results which incorporate the Target Volatility model dynamically reduce exposure to capital markets during
periods of high volatility and assume a 6.5% Target Volatility. Results are based on simulated or hypothetical performance results that have certain inherent limitations.
Unlike the results shown in an actual performance record, these results do not represent actual trading. Results exclude estimates of trading costs and market impact.
Simulated or hypothetical trading programs in general are also subject to the fact that they are designed with the benefit of hindsight. No representation is being made that
any account will or is likely to achieve returns or a volatility profile similar to those being shown. See Important Information.
The Target Volatility mechanism aims to reduce exposure to “riskier” 

assets during periods of higher market volatility.
0%
10%
20%
30%
40%
0%
25%
50%
75%
100%
Jul 07 Feb 08 Oct 08 Jun 09 Feb 10 Oct 10 Jun 11 Feb 12 Oct 12 Jun 13 Feb 14 Oct 14 Jun 15 Feb 16 Oct 16 Jun 17
PercentInvestedin“RiskyAssets”
Volatility
Percent Invested
in Risky Assets
50/50
VOLATILITY
50/50 without
Target Volatility
VOLATILITY
50/50 with Target
Volatility
For financial adviser use only. Not to be distributed to, or relied upon by, retail clients.
Why is this important?
It is harder to recover a loss, than it is to make a gain.
% loss
Source: BNY Mellon. Joint Investment Forum Absolute return: searching for returns independent of market conditions ,
January 2014
% Gain needed
For financial adviser use only. Not to be distributed to, or relied upon by, retail clients.
Where next for the Markets?

More Related Content

What's hot

COMMON INVESTING MISTAKES!
COMMON INVESTING MISTAKES!COMMON INVESTING MISTAKES!
COMMON INVESTING MISTAKES!Vidya Ashok
 
Risk and return analysis on equity share
Risk and return analysis on equity shareRisk and return analysis on equity share
Risk and return analysis on equity shareramanbn
 
Intraday Equities Trend System
Intraday Equities Trend SystemIntraday Equities Trend System
Intraday Equities Trend Systemsherif24
 
Identifying excessive credit growth and leverage
Identifying excessive credit growth and leverageIdentifying excessive credit growth and leverage
Identifying excessive credit growth and leverageSYRTO Project
 
Basic Financial Banking terms
Basic Financial Banking termsBasic Financial Banking terms
Basic Financial Banking termsamisamalia
 
Sage Fact Sheet Jun 2015
Sage Fact Sheet Jun 2015Sage Fact Sheet Jun 2015
Sage Fact Sheet Jun 2015Alan Chu
 
Teresa's ppt
Teresa's pptTeresa's ppt
Teresa's pptAbi Lin
 
Jp morgan investment funds income opportunity fund
Jp morgan investment funds   income opportunity fundJp morgan investment funds   income opportunity fund
Jp morgan investment funds income opportunity fundBobby Bob
 
Risk and Return Analysis
Risk and Return AnalysisRisk and Return Analysis
Risk and Return AnalysisRamziya Begam
 
An Introduction to the Black Litterman Model
An Introduction to the Black Litterman ModelAn Introduction to the Black Litterman Model
An Introduction to the Black Litterman ModelSimon Long
 
Gap analysis in banks
Gap analysis in banksGap analysis in banks
Gap analysis in bankshas10nas
 
Portfolio management strategies
Portfolio management strategiesPortfolio management strategies
Portfolio management strategiesBikash Kumar
 

What's hot (20)

Calculating Beta for Stocks
Calculating Beta for StocksCalculating Beta for Stocks
Calculating Beta for Stocks
 
COMMON INVESTING MISTAKES!
COMMON INVESTING MISTAKES!COMMON INVESTING MISTAKES!
COMMON INVESTING MISTAKES!
 
Risk and return analysis on equity share
Risk and return analysis on equity shareRisk and return analysis on equity share
Risk and return analysis on equity share
 
Intraday Equities Trend System
Intraday Equities Trend SystemIntraday Equities Trend System
Intraday Equities Trend System
 
Identifying excessive credit growth and leverage
Identifying excessive credit growth and leverageIdentifying excessive credit growth and leverage
Identifying excessive credit growth and leverage
 
Risk management
Risk managementRisk management
Risk management
 
Basic Financial Banking terms
Basic Financial Banking termsBasic Financial Banking terms
Basic Financial Banking terms
 
Sage Fact Sheet Jun 2015
Sage Fact Sheet Jun 2015Sage Fact Sheet Jun 2015
Sage Fact Sheet Jun 2015
 
Teresa's ppt
Teresa's pptTeresa's ppt
Teresa's ppt
 
Jp morgan investment funds income opportunity fund
Jp morgan investment funds   income opportunity fundJp morgan investment funds   income opportunity fund
Jp morgan investment funds income opportunity fund
 
Select Directional 2016 08 31
Select Directional 2016 08 31Select Directional 2016 08 31
Select Directional 2016 08 31
 
Chap008
Chap008Chap008
Chap008
 
Class 16 fin_mgmnt_slides_jmm2014p
Class 16 fin_mgmnt_slides_jmm2014pClass 16 fin_mgmnt_slides_jmm2014p
Class 16 fin_mgmnt_slides_jmm2014p
 
Introduction to Interest Rrate Risk Management
Introduction to Interest Rrate Risk ManagementIntroduction to Interest Rrate Risk Management
Introduction to Interest Rrate Risk Management
 
Chap007
Chap007Chap007
Chap007
 
Risk and Return Analysis
Risk and Return AnalysisRisk and Return Analysis
Risk and Return Analysis
 
An Introduction to the Black Litterman Model
An Introduction to the Black Litterman ModelAn Introduction to the Black Litterman Model
An Introduction to the Black Litterman Model
 
Gap analysis in banks
Gap analysis in banksGap analysis in banks
Gap analysis in banks
 
Risk Return Basics for Investing
Risk Return Basics for InvestingRisk Return Basics for Investing
Risk Return Basics for Investing
 
Portfolio management strategies
Portfolio management strategiesPortfolio management strategies
Portfolio management strategies
 

Similar to Brian b slidesaxa

DSP Equity Savings Fund Presentation.pdf
DSP Equity Savings Fund Presentation.pdfDSP Equity Savings Fund Presentation.pdf
DSP Equity Savings Fund Presentation.pdfDSP Mutual Fund
 
DSP Regular Savings Fund Presentation.pdf
DSP Regular Savings Fund Presentation.pdfDSP Regular Savings Fund Presentation.pdf
DSP Regular Savings Fund Presentation.pdfDSP Mutual Fund
 
DSP Regular Savings Fund
DSP Regular Savings FundDSP Regular Savings Fund
DSP Regular Savings FundDSP Mutual Fund
 
GIC Investment Ideas: Alternatives
GIC Investment Ideas: AlternativesGIC Investment Ideas: Alternatives
GIC Investment Ideas: AlternativesMarqus J Freeman
 
Bulls Eye October 2010
Bulls  Eye  October 2010Bulls  Eye  October 2010
Bulls Eye October 2010chetsons
 
Kyriba liquidity management jan 2014 final
Kyriba liquidity management jan 2014 finalKyriba liquidity management jan 2014 final
Kyriba liquidity management jan 2014 finalNicole Cuilis-Gregor
 
DSP Top 100 Equity Fund Presentation.pdf
DSP Top 100 Equity Fund Presentation.pdfDSP Top 100 Equity Fund Presentation.pdf
DSP Top 100 Equity Fund Presentation.pdfDSP Mutual Fund
 
Compelling Arguments or False Assumption No 2
Compelling Arguments or False Assumption No 2Compelling Arguments or False Assumption No 2
Compelling Arguments or False Assumption No 2Ralph K. Czichon
 
Lamar Van Dusen | Optimal Turnover Revisited : Levels Corresponding to Highes...
Lamar Van Dusen | Optimal Turnover Revisited : Levels Corresponding to Highes...Lamar Van Dusen | Optimal Turnover Revisited : Levels Corresponding to Highes...
Lamar Van Dusen | Optimal Turnover Revisited : Levels Corresponding to Highes...Lamar Van Dusen
 
Joseph Fabiilli - Cost and Fixed Portfolio Strategies
Joseph Fabiilli - Cost and Fixed Portfolio StrategiesJoseph Fabiilli - Cost and Fixed Portfolio Strategies
Joseph Fabiilli - Cost and Fixed Portfolio StrategiesJoseph Fabiilli
 
Cefa pitchbook 2010-0902
Cefa pitchbook 2010-0902Cefa pitchbook 2010-0902
Cefa pitchbook 2010-0902John Cole Scott
 
The Secrets to Long Term Investing Success - Session 1
The Secrets to Long Term Investing Success - Session 1The Secrets to Long Term Investing Success - Session 1
The Secrets to Long Term Investing Success - Session 1Bob Sloma
 
Parametric perspectives-winter-2010 (1)
Parametric perspectives-winter-2010 (1)Parametric perspectives-winter-2010 (1)
Parametric perspectives-winter-2010 (1)Kola Wade
 
testingsdadadadaaddadadadadadadadaad.pdf
testingsdadadadaaddadadadadadadadaad.pdftestingsdadadadaaddadadadadadadadaad.pdf
testingsdadadadaaddadadadadadadadaad.pdfDSP Mutual Fund
 
DSP Small Cap Fund Presentation December'23
DSP Small Cap Fund Presentation December'23DSP Small Cap Fund Presentation December'23
DSP Small Cap Fund Presentation December'23DSP Mutual Fund
 

Similar to Brian b slidesaxa (20)

DSP Equity Savings Fund
DSP Equity Savings FundDSP Equity Savings Fund
DSP Equity Savings Fund
 
DSP Equity Savings Fund Presentation.pdf
DSP Equity Savings Fund Presentation.pdfDSP Equity Savings Fund Presentation.pdf
DSP Equity Savings Fund Presentation.pdf
 
DSP Regular Savings Fund Presentation.pdf
DSP Regular Savings Fund Presentation.pdfDSP Regular Savings Fund Presentation.pdf
DSP Regular Savings Fund Presentation.pdf
 
DSP Regular Savings Fund
DSP Regular Savings FundDSP Regular Savings Fund
DSP Regular Savings Fund
 
GIC Investment Ideas: Alternatives
GIC Investment Ideas: AlternativesGIC Investment Ideas: Alternatives
GIC Investment Ideas: Alternatives
 
Ml inv rule_of100x
Ml inv rule_of100xMl inv rule_of100x
Ml inv rule_of100x
 
Bulls Eye October 2010
Bulls  Eye  October 2010Bulls  Eye  October 2010
Bulls Eye October 2010
 
DSP Midcap Fund
DSP Midcap FundDSP Midcap Fund
DSP Midcap Fund
 
Kyriba liquidity management jan 2014 final
Kyriba liquidity management jan 2014 finalKyriba liquidity management jan 2014 final
Kyriba liquidity management jan 2014 final
 
DSP Top 100 Equity Fund Presentation.pdf
DSP Top 100 Equity Fund Presentation.pdfDSP Top 100 Equity Fund Presentation.pdf
DSP Top 100 Equity Fund Presentation.pdf
 
DSP Top 100 Equity Fund
DSP Top 100 Equity FundDSP Top 100 Equity Fund
DSP Top 100 Equity Fund
 
Compelling Arguments or False Assumption No 2
Compelling Arguments or False Assumption No 2Compelling Arguments or False Assumption No 2
Compelling Arguments or False Assumption No 2
 
Lamar Van Dusen | Optimal Turnover Revisited : Levels Corresponding to Highes...
Lamar Van Dusen | Optimal Turnover Revisited : Levels Corresponding to Highes...Lamar Van Dusen | Optimal Turnover Revisited : Levels Corresponding to Highes...
Lamar Van Dusen | Optimal Turnover Revisited : Levels Corresponding to Highes...
 
Joseph Fabiilli - Cost and Fixed Portfolio Strategies
Joseph Fabiilli - Cost and Fixed Portfolio StrategiesJoseph Fabiilli - Cost and Fixed Portfolio Strategies
Joseph Fabiilli - Cost and Fixed Portfolio Strategies
 
Dsp Equity Savings Fund
Dsp Equity Savings FundDsp Equity Savings Fund
Dsp Equity Savings Fund
 
Cefa pitchbook 2010-0902
Cefa pitchbook 2010-0902Cefa pitchbook 2010-0902
Cefa pitchbook 2010-0902
 
The Secrets to Long Term Investing Success - Session 1
The Secrets to Long Term Investing Success - Session 1The Secrets to Long Term Investing Success - Session 1
The Secrets to Long Term Investing Success - Session 1
 
Parametric perspectives-winter-2010 (1)
Parametric perspectives-winter-2010 (1)Parametric perspectives-winter-2010 (1)
Parametric perspectives-winter-2010 (1)
 
testingsdadadadaaddadadadadadadadaad.pdf
testingsdadadadaaddadadadadadadadaad.pdftestingsdadadadaaddadadadadadadadaad.pdf
testingsdadadadaaddadadadadadadadaad.pdf
 
DSP Small Cap Fund Presentation December'23
DSP Small Cap Fund Presentation December'23DSP Small Cap Fund Presentation December'23
DSP Small Cap Fund Presentation December'23
 

More from Brian Boyd

Fx perpetual performance-flyer-3
Fx perpetual performance-flyer-3Fx perpetual performance-flyer-3
Fx perpetual performance-flyer-3Brian Boyd
 
SIPP Pension & Investment Bond Fixed Return 9.85%
SIPP Pension & Investment Bond Fixed Return 9.85%SIPP Pension & Investment Bond Fixed Return 9.85%
SIPP Pension & Investment Bond Fixed Return 9.85%Brian Boyd
 
Metlife Guaranteed funds Assets since launch 18Oct15-4
Metlife Guaranteed funds Assets since launch 18Oct15-4Metlife Guaranteed funds Assets since launch 18Oct15-4
Metlife Guaranteed funds Assets since launch 18Oct15-4Brian Boyd
 
Motion Picture Capital - Why invest in film & TV
Motion Picture Capital - Why invest in film & TVMotion Picture Capital - Why invest in film & TV
Motion Picture Capital - Why invest in film & TVBrian Boyd
 
MPC - What sets us apart-2 EIS Movies
MPC - What sets us apart-2 EIS MoviesMPC - What sets us apart-2 EIS Movies
MPC - What sets us apart-2 EIS MoviesBrian Boyd
 
FX Perpetual- Key Features
FX Perpetual- Key Features FX Perpetual- Key Features
FX Perpetual- Key Features Brian Boyd
 
Investec ISA 10%
Investec ISA 10%Investec ISA 10%
Investec ISA 10%Brian Boyd
 
FXPerpetual-Performance-Flyer-October
FXPerpetual-Performance-Flyer-OctoberFXPerpetual-Performance-Flyer-October
FXPerpetual-Performance-Flyer-OctoberBrian Boyd
 
div tech-talk-dividend-income
div tech-talk-dividend-incomediv tech-talk-dividend-income
div tech-talk-dividend-incomeBrian Boyd
 
Investec maturity-overview-February2015-3
 Investec maturity-overview-February2015-3 Investec maturity-overview-February2015-3
Investec maturity-overview-February2015-3Brian Boyd
 
Income reward sales aid 1412 ukv5 income1_v10_final-2
Income reward sales aid 1412 ukv5 income1_v10_final-2Income reward sales aid 1412 ukv5 income1_v10_final-2
Income reward sales aid 1412 ukv5 income1_v10_final-2Brian Boyd
 
Sophisticated ivestors
Sophisticated ivestors Sophisticated ivestors
Sophisticated ivestors Brian Boyd
 
Hnw and sophisticated investors
Hnw and sophisticated investors Hnw and sophisticated investors
Hnw and sophisticated investors Brian Boyd
 
High net worth individuals
High net worth individuals High net worth individuals
High net worth individuals Brian Boyd
 
Auto enrolment employer presentation
Auto enrolment employer presentationAuto enrolment employer presentation
Auto enrolment employer presentationBrian Boyd
 
Auto enrolment employer presentation
Auto enrolment employer presentationAuto enrolment employer presentation
Auto enrolment employer presentationBrian Boyd
 
What the Taxman does not want you to know
What the Taxman does not want you to know What the Taxman does not want you to know
What the Taxman does not want you to know Brian Boyd
 
What the taxman doesn't want you to know
What the taxman doesn't want you to knowWhat the taxman doesn't want you to know
What the taxman doesn't want you to knowBrian Boyd
 
Forestry investment with guarantees
Forestry investment with guaranteesForestry investment with guarantees
Forestry investment with guaranteesBrian Boyd
 

More from Brian Boyd (20)

Fx perpetual performance-flyer-3
Fx perpetual performance-flyer-3Fx perpetual performance-flyer-3
Fx perpetual performance-flyer-3
 
SIPP Pension & Investment Bond Fixed Return 9.85%
SIPP Pension & Investment Bond Fixed Return 9.85%SIPP Pension & Investment Bond Fixed Return 9.85%
SIPP Pension & Investment Bond Fixed Return 9.85%
 
Metlife Guaranteed funds Assets since launch 18Oct15-4
Metlife Guaranteed funds Assets since launch 18Oct15-4Metlife Guaranteed funds Assets since launch 18Oct15-4
Metlife Guaranteed funds Assets since launch 18Oct15-4
 
Motion Picture Capital - Why invest in film & TV
Motion Picture Capital - Why invest in film & TVMotion Picture Capital - Why invest in film & TV
Motion Picture Capital - Why invest in film & TV
 
MPC - What sets us apart-2 EIS Movies
MPC - What sets us apart-2 EIS MoviesMPC - What sets us apart-2 EIS Movies
MPC - What sets us apart-2 EIS Movies
 
FX Perpetual- Key Features
FX Perpetual- Key Features FX Perpetual- Key Features
FX Perpetual- Key Features
 
Investec ISA 10%
Investec ISA 10%Investec ISA 10%
Investec ISA 10%
 
FXPerpetual-Performance-Flyer-October
FXPerpetual-Performance-Flyer-OctoberFXPerpetual-Performance-Flyer-October
FXPerpetual-Performance-Flyer-October
 
div tech-talk-dividend-income
div tech-talk-dividend-incomediv tech-talk-dividend-income
div tech-talk-dividend-income
 
Investec maturity-overview-February2015-3
 Investec maturity-overview-February2015-3 Investec maturity-overview-February2015-3
Investec maturity-overview-February2015-3
 
P75 axa
P75 axa P75 axa
P75 axa
 
Income reward sales aid 1412 ukv5 income1_v10_final-2
Income reward sales aid 1412 ukv5 income1_v10_final-2Income reward sales aid 1412 ukv5 income1_v10_final-2
Income reward sales aid 1412 ukv5 income1_v10_final-2
 
Sophisticated ivestors
Sophisticated ivestors Sophisticated ivestors
Sophisticated ivestors
 
Hnw and sophisticated investors
Hnw and sophisticated investors Hnw and sophisticated investors
Hnw and sophisticated investors
 
High net worth individuals
High net worth individuals High net worth individuals
High net worth individuals
 
Auto enrolment employer presentation
Auto enrolment employer presentationAuto enrolment employer presentation
Auto enrolment employer presentation
 
Auto enrolment employer presentation
Auto enrolment employer presentationAuto enrolment employer presentation
Auto enrolment employer presentation
 
What the Taxman does not want you to know
What the Taxman does not want you to know What the Taxman does not want you to know
What the Taxman does not want you to know
 
What the taxman doesn't want you to know
What the taxman doesn't want you to knowWhat the taxman doesn't want you to know
What the taxman doesn't want you to know
 
Forestry investment with guarantees
Forestry investment with guaranteesForestry investment with guarantees
Forestry investment with guarantees
 

Brian b slidesaxa

  • 1. For financial adviser use only. Not to be distributed to, or relied upon by, retail clients.
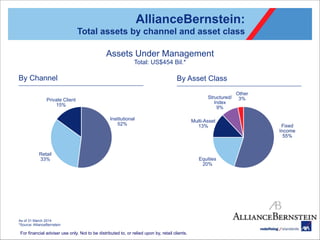
 AllianceBernstein:
 Total assets by channel and asset class By Channel By Asset Class Institutional
 52% Retail
 33% Private Client
 15% Assets Under Management Total: US$454 Bil.* As of 31 March 2014 *Source: AllianceBernstein Multi-Asset
 13% Structured/
 Index
 9% Fixed
 Income 
 55% Equities
 20% Other
 3%
  • 2. For financial adviser use only. Not to be distributed to, or relied upon by, retail clients. Why is Dynamic De-risking important?
 Portfolio volatility can vary dramatically Simulated Portfolio Volatility Static Asset Allocation Assuming 50/50 Equities and Bonds Hedged to GBP The simulation was based on the AB Global Strategy 50/50 GBP portfolio allocation using daily returns with weekly rebalancing and fully hedged to GBP over the 10 year period from 30 June 2003–30 June 2013. Results are based on simulated or hypothetical performance results that have certain inherent limitations. Unlike the results shown in an actual performance record, these results do not represent actual trading. Results exclude estimates of trading costs and market impact. Simulated or hypothetical trading programs in general are also subject to the fact that they are designed with the benefit of hindsight. No representation is being made that any account will or is likely to achieve returns or a volatility profile similar to those being shown. See Important Information. Historical information provided for illustrative purposes only Source: AllianceBernstein While the average risk of a balanced portfolio is moderate over long periods, 
 in the interim, the risk can vary dramatically depending on the market environment. 0% 10% 20% 30% 40% Jul 07 Jan 08 Aug 08 Mar 09 Oct 09 May 10Dec 10 Jun 11 Jan 12 Aug 12 Mar 13 Oct 13 May 14Dec 14 Jun 15 Jan 16 Aug 16 Mar 17 Average volatility 6.3%
  • 3. For financial adviser use only. Not to be distributed to, or relied upon by, retail clients. Why is Dynamic De-risking important?
 Aims to lower overall portfolio risk Simulated Portfolio Volatility Static Allocation vs. Target Volatility Allocation (assumes 50/50 Equities and Bonds Hedged to GBP) The simulation was based on the AllianceBernstein Global Strategy 50/50 portfolio allocation using daily returns with weekly rebalancing and fully hedged to GBP over the 10 year period from 30 June 2003–30 June 2013. The simulation results which incorporate the Target Volatility model dynamically reduce exposure to capital markets during periods of high volatility and assume a 6.5% Target Volatility. Results are based on simulated or hypothetical performance results that have certain inherent limitations. Unlike the results shown in an actual performance record, these results do not represent actual trading. Results exclude estimates of trading costs and market impact. Simulated or hypothetical trading programs in general are also subject to the fact that they are designed with the benefit of hindsight. No representation is being made that any account will or is likely to achieve returns or a volatility profile similar to those being shown. See Important Information. The Target Volatility mechanism aims to reduce exposure to “riskier” 
 assets during periods of higher market volatility. 0% 10% 20% 30% 40% 0% 25% 50% 75% 100% Jul 07 Feb 08 Oct 08 Jun 09 Feb 10 Oct 10 Jun 11 Feb 12 Oct 12 Jun 13 Feb 14 Oct 14 Jun 15 Feb 16 Oct 16 Jun 17 PercentInvestedin“RiskyAssets” Volatility Percent Invested in Risky Assets 50/50 VOLATILITY 50/50 without Target Volatility VOLATILITY 50/50 with Target Volatility
  • 4. For financial adviser use only. Not to be distributed to, or relied upon by, retail clients. Why is this important? It is harder to recover a loss, than it is to make a gain. % loss Source: BNY Mellon. Joint Investment Forum Absolute return: searching for returns independent of market conditions , January 2014 % Gain needed
  • 5. For financial adviser use only. Not to be distributed to, or relied upon by, retail clients. Where next for the Markets?