This document discusses neonatal mortality measurement and summarizes recent developments. It covers:
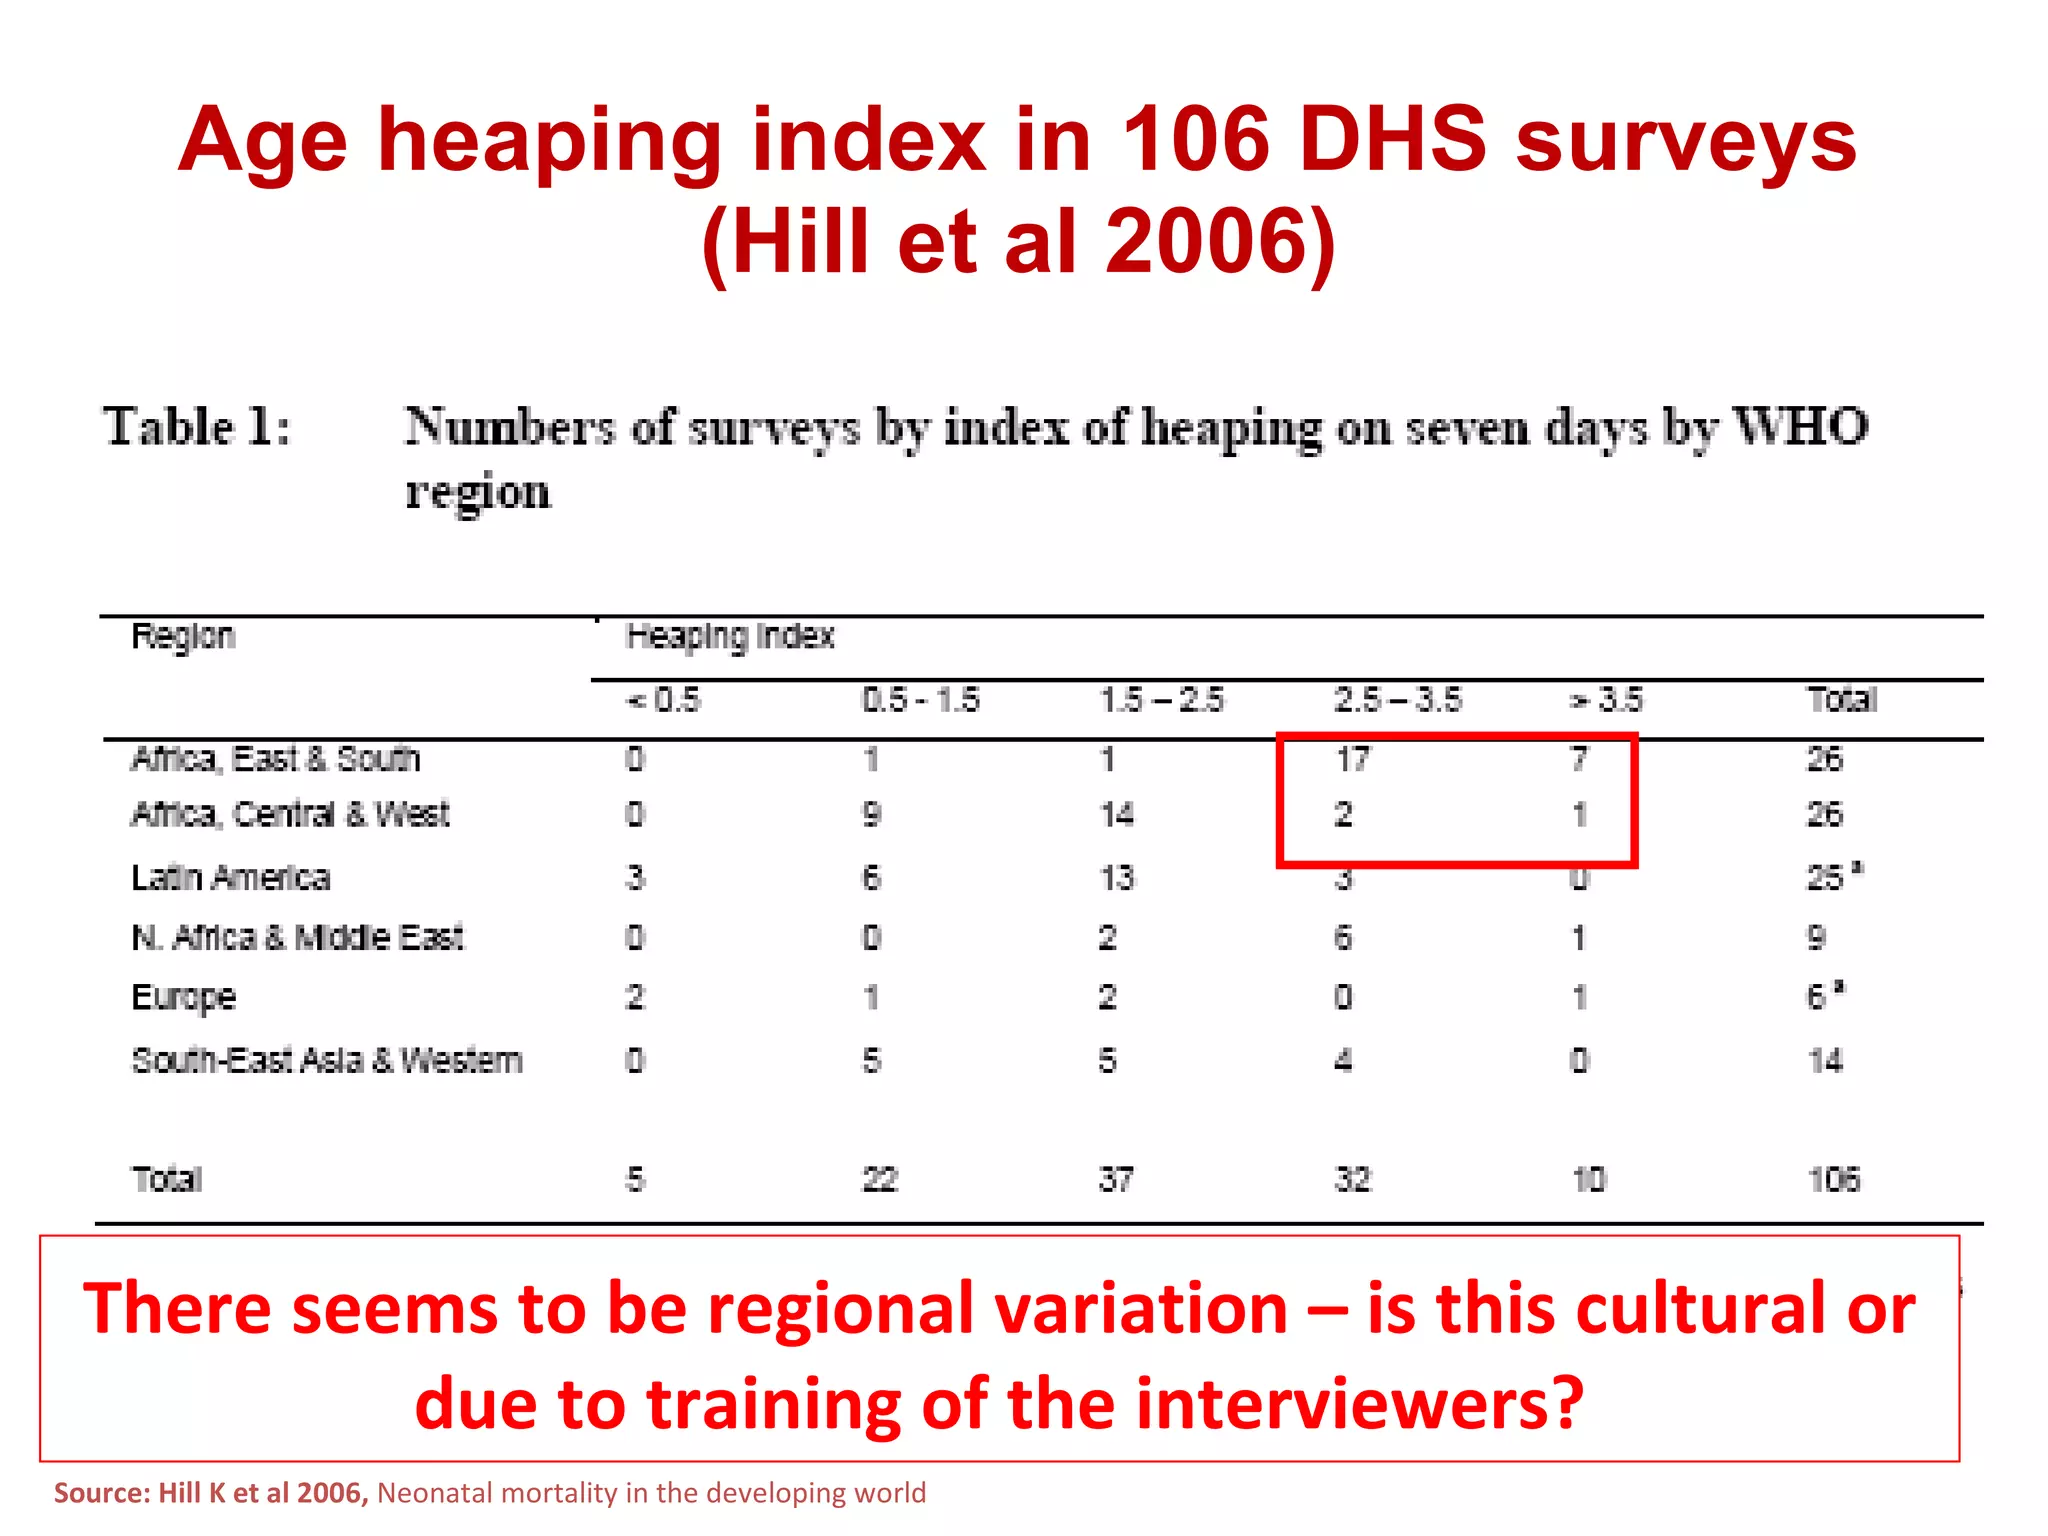
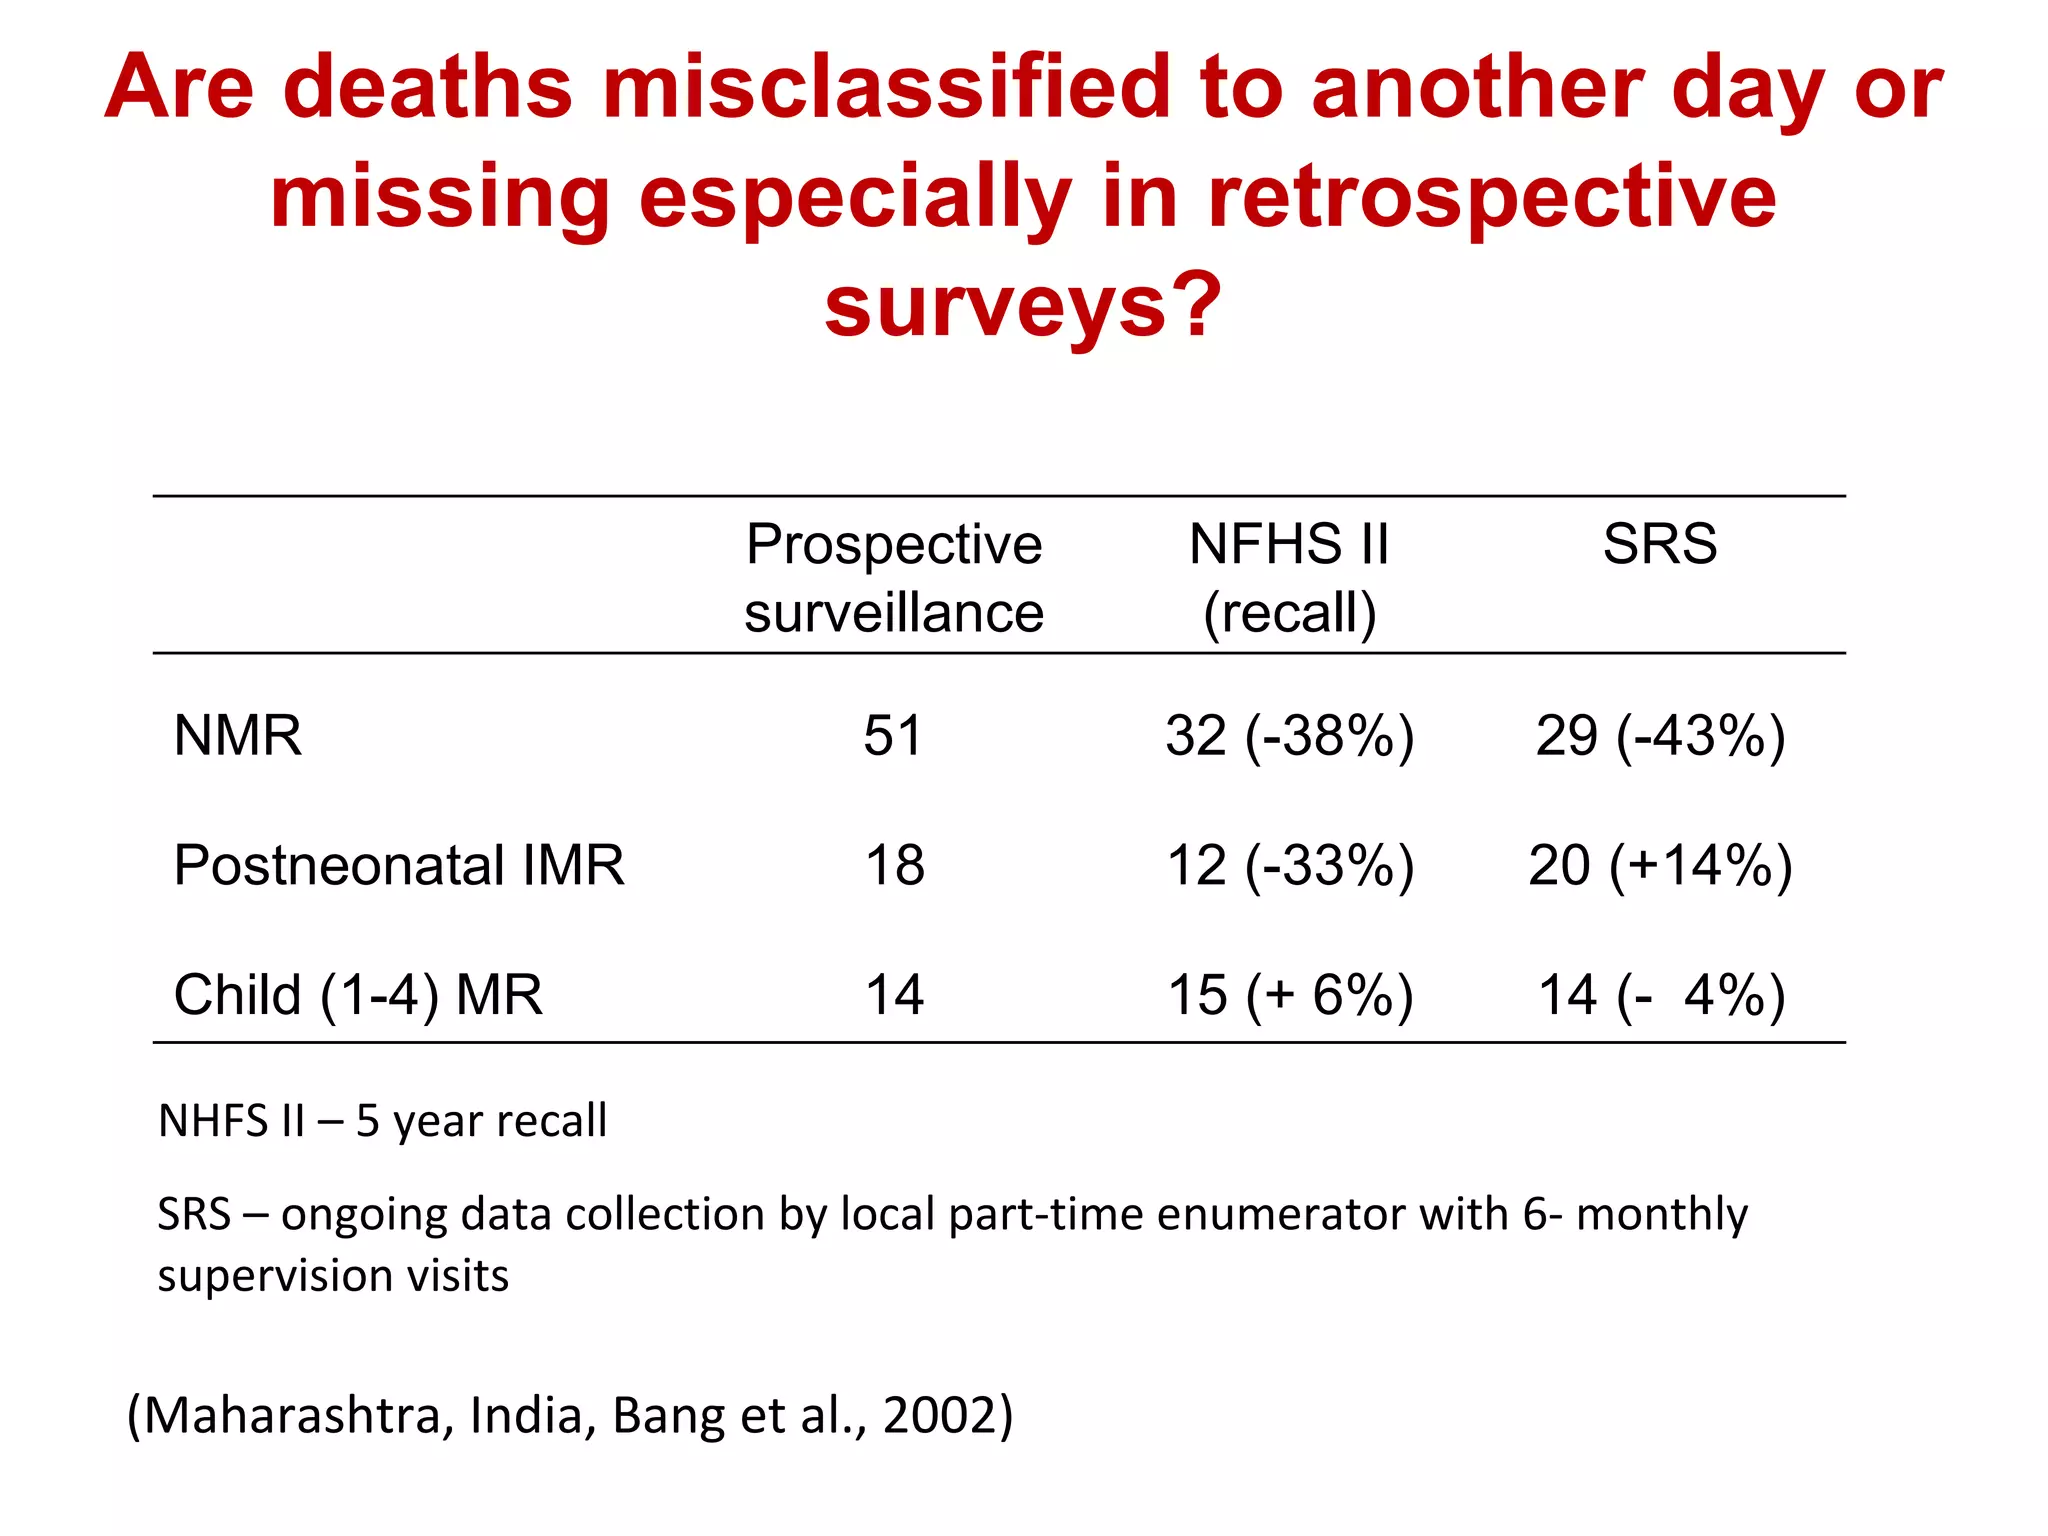
1) Neonatal mortality rates can now be estimated annually through improved surveys, though data reliability remains a concern. Pregnancy history modules may better capture neonatal deaths.
2) Estimates of neonatal causes of death have been improved through increased country data, especially for large countries like India and China. Rates of infections and tetanus appear to be declining in some areas.
3) Surveys can be improved by modifying questions to better capture neonatal mortality and stillbirths, and through follow up verbal autopsies to obtain cause of death data for over 75% of neonatal deaths dependent on surveys.